


Servicios Personalizados
Revista
Articulo
 Articulo en XML
 Referencias del artículo
 Enviar articulo por email
Indicadores
-
 Citado por SciELO
 -
 Accesos
Links relacionados
-
 Similares en
SciELO
Similares en
SciELO
Compartir

 Permalink
Archivos Latinoamericanos de Nutrición
versión impresa ISSN 0004-0622versión On-line ISSN 2309-5806
ALAN v.55 n.2 Caracas jun. 2005
Effect of the diuretic furosemide on urinary essential nutrient loss and on body stores in growing rats
Yelitza Berné, Diamela Carías, Anna M. Cioccia, Eduardo González, Patricio Hevia
Laboratorio de Nutrición. Universidad Simón Bolívar. Caracas, Venezuela
Funded by: Decanato de Estudios de Postgrado y Grupo de Bioquímica Nutricional del Decanato de Investigación y Desarrollo. Universidad Simón Bolívar.
SUMMARY. Studies using a model of non-infectious diarrhea, have shown that increasing fecal mass by using laxatives resulted in greater fecal losses of nutrients and lower intestinal absorption. In the present study we used a diuretic to determine if increasing urine volume could result in greater urinary losses of essential nutrients. This is a relevant question because diuretics are widely and successfully used in the treatment of diseases associated with water retention and hypertension. They are known to increase potassium losses. However, there is less information on the effect of diuretics on the urinary losses of essential nutrients. Accordingly, urinary nitrogen, phosphorous, sodium, potassium, magnesium, zinc and retinol were measured in young rats consuming increasing concentrations of furosemide (0, 0.5, 1.0, 1.5 mg/g diet) in the diet over 15 days. The results showed that dietary furosemide caused a dose-dependent polyuria. In addition it reduced food intake and feed efficiency and leaded to poor growth and greater urinary losses of all the measured nutrients and electrolytes. These losses were proportional to urine volume and represented an important fraction of the rats daily intake. The losses were negatively associated with the body and liver content of the same electrolytes and nutrients. In general, this study showed that the diuretic furosemide caused malnutrition in a short period of time by reducing food intake as well as the capacity of retaining macro and micronutrients including the liposoluble vitamin A in a relatively short period of time. This study, together with our previous studies on diarrhea, indicate that proper nutrient utilization requires both an adequate intestinal and renal function.
Key words: Furosemide, growth, urine losses, tissue reserves, macro and micronutrients, electrolytes.
RESUMEN. Efecto del diuretico furosemida sobre las pérdidas de nutrientes esenciales en orina y en las reservas corporales de ratas en crecimiento. Estudios previos en un modelo no infeccioso de diarrea, mostraron que un aumento en la masa fecal producido con laxantes aumenta las pérdidas de nutrientes en las heces y en consecuencia reduce su absorción. En el presente estudio se usó un diurético para determinar si un aumento en el volumen de orina podría tener un efecto similar pero en la retención de los nutrientes. Esta interrogante es válida ya que los diuréticos se han utilizado ampliamente y con éxito en el tratamiento de enfermedades como la hipertensión y edemas y se sabe que producen deficiencias de potasio. Sin embargo, se desconoce su efecto sobre las pérdidas urinarias de nutrientes esenciales. En consecuencia, se midieron las pérdidas urinarias de nitrógeno, fósforo, sodio, potasio, magnesio, cinc y retinol en ratas en crecimiento que consumieron concentraciones crecientes de furosemida en la dieta (0, 0.5, 1.0 y 1.5 mg/g de dieta) durante 15 días. Se observó que la inclusión de furosemida en la dieta causó poliuria así como una reducción en el consumo, la eficiencia del alimento, el crecimiento y aumentó las pérdidas urinarias de todos los electrolitos y nutrientes estudiados. La magnitud de estas pérdidas fue proporcional al volumen de orina, representó una fracción importante de su consumo diario y afectó negativamente a las reservas tisulares de los mismos. En general, este estudio mostró que la administración del diurético furosemida causó una desnutrición asociada con una reducción en el consumo de alimento y una disminución en la capacidad de retener el nitrógeno así como algunos micronutrientes esenciales incluyendo a la vitamina A en un tiempo corto. Estas observaciones en conjunto con nuestros estudios en diarrea indican que para lograr una utilización adecuada de los nutrientes dietarios, se requiere tanto de una apropiada función intestinal como renal.
Palabras clave: Furosemida, crecimiento, pérdidas urinarias, reservas tisulares, macro y micronutrientes, electrolitos.
INTRODUCTION
The concept of the biological value of dietary protein proposed by Mitchell in 1923 (1) indicates that protein utilization depends on how much of the protein consumed is absorbed and retained by the organism. Absorption and retention are determined by comparing protein intake with the amount of protein lost in the feces and in urine respectively. This concept, which was developed for the evaluation of protein quality, can be extended to almost all nutrients. The exception are dietary fat as well as a small group of nutrients whose main route of excretion is the bile secreted by the liver. Therefore, the utilization of the majority of the essential nutrients requires not only proper intestinal function to assure absorption but also proper kidney function to assure nutrient retention.
Previous studies (2-7) have shown that altering intestinal function by using diarrhea-causing laxatives resulted in a substantial reduction in the absorption of several dietary nutrients. This reduction was mainly associated with a decrease in transit time (7) and was proportional to fecal mass or the severity of diarrhea. Since one of the functions of the kidney is to reabsorb nutrients present in the glomerular filtrate back into the circulating blood, we arrived at the following possibility: if diarrhea induced by laxatives causes malabsorption in the intestine, thus increasing urine volume or causing diuresis, then diuretics may also cause a reduction of nutrient reabsorption in the nephron tubules. Therefore, diuresis may be associated with increased urinary losses of nutrients and consequently with reduced nutrient retention and lower tissue reserves.
In order to test this hypothesis, we employed a diuretic. We measured its effect on urinary loss of nutrients and on the nutritional status of rats. This model is relevant to nutrition both in health and disease since diuretics have been successfully used in the treatment of various pathologies associated with liquid retention (8) and hypertension (9). Moreover, their utilization has recently increased because they are extensively used as part of extreme and unhealthy weight-loss practices among overweight adolescents (10) and adults (11), as well as in sports in which thinness is considered advantageous (12-13).
The main side effect of diuretics is urinary electrolyte loss (14). However, in patients using diuretics, potassium loss is the main concern because of the severe health problems this occasions (15). Despite the emphasis placed on potassium, diuretics also increase the urinary losses of other water-soluble essential nutrients and metabolites such us calcium, magnesium, chloride, bicarbonate, vitamin C, B6 and thiamin (14,16-22). This indicates that individuals using diuretics may be at risk of developing nutritional deficiencies. In contrast to potassium, these deficiencies may be asymptomatic in the short term. Diuretics are prescribed for use over very long periods of time. Therefore, if nutrient losses are not prevented, they may eventually jeopardize the nutritional status of those using them. This is important because several micronutrients have been associated with the prevention of hypertension (23) which is one of the diseases diuretics are prescribed for.
Therefore, the objective of this study was to determine two things: the effect of the diuretic furosemide on urinary losses of essential nutrients, and the consequences of administrating this diuretic on the nutritional status of growing rats. Accordingly, we measured several nutrients and electrolytes in the urine of young rats. These were fed diets providing all the essential nutrients and increasing concentrations of the loop diuretic furosemide. In addition to several urinary cations and phosphate, also measured was the effect of the diuretic on the urinary loss of nitrogen and retinol. Urinary nitrogen loss was included because it is representative of protein catabolism, urinary loss of intact proteins and other nitrogen containing-metabolites. Retinol was included since increased urinary loss of retinol has been reported in children with infection and diarrhea (24).
In order to get an idea of the importance of the measured nutrient and electrolyte urinary losses, these were compared with the daily intake of the lost elements. Also, we assessed the effect of these losses on the nutritional status of the rats receiving the diuretic by measuring growth as well as lost electrolytes and essential nutrients in the rats´ carcasses and livers. Those which grew less and/or featured lower reserves of these compounds in their carcasses and livers than rats which did not receive the diuretic, were considered malnourished.
MATERIALS AND METHODS
Growing Sprague-Dawley female rats (approximately 6 weeks old) were fed a control diet (25) containing Isolated Soybean Protein 15%, Corn oil 5%, AIN 93G Mineral Mix 3.5%, AIN 93Vx Vitamin Mix 1%, Choline Bitartrate 0.2%, Methionine 0.3%, Corn Starch 50% and Sucrose 25% for four days. Then they were randomly assigned to four groups (6 rats/group). A control group received the same diet. The three other groups also received this diet, but with part of the corn starch replaced by ground furosemide-containing tablets (Lasix ™ Hoechst) to provide 0.5, 1.0 and 1.5 mg furosemide/g diets. Each tablet provided 40 mg furosemide and weighed 160 mg. Therefore the amount of corn starch replaced by the ground furosemide tablets in these diets was 200, 400 and 600 mg per 100g of diet, respectively. All the diets were prepared in our laboratory using commercial ingredients. The soybean protein was purchased from Protein Technologies International of Saint Louis MO. The mineral and vitamin mixes as well as the methionine, and choline bitartrate was purchased from Harlan/Teklad, from Indianapolis IN. The corn starch, sucrose and soybean oil were obtained from local sources. The four groups of rats were placed in hanging wire stainless steel metabolic cages and were offered their assigned diets and water ad libitum for 15 days. During this period of time body weight, food, and water intake were measured every other day. Twenty-four-hour urine collections were performed on days 1,4,8,12 and 15. After measuring urine volume, a sample of the urine was stored frozen until analyzed. The rats were killed under ether anesthesia by decapitation on last day of the experiment. Blood samples were collected, the livers were dissected and the remaining carcasses were dried in a convection oven at 105 ° C until constant weight. Serum was separated by centrifugation and all tissues were kept frozen at – 20° C until analyzed. All animal procedures conformed to the standard principles in the Guide for the Care and Use of Laboratory Animals (26).
In the dried rat carcasses, body nitrogen was determined using the colorimetric method of Hevia and Cioccia (27). Body protein was estimated as body nitrogen x 6.25. Body lipids were determined by the method of Blight and Dyer (28). Body ash was obtained by incineration in a Thermolyne Bench Top Furnace Muffle at 550° C. Then the ashes were diluted. Body magnesium and zinc were determined by flame ionization atomic absorption in a Perkin Elmer 2380 apparatus. Sodium and potassium were determined by emission (29). Body phosphorous was determined after acid digestion of the carcasses using Bartlett´s method. (30). Liver vitamin E and vitamin A were determined by HPLC after saponification and extraction using the procedure recommended by Ueda and Igarashi (31). The same vitamins were also measured in the serum by HPLC in the manner described by Chow and Omaye (32). Urinary vitamin A was determined by HPLC as described by Alvarez et al. (24). Urinary losses of magnesium, zinc, sodium, potassium, phosphrous and nitrogen were determined directly in the urine samples using the methods just described.
Growth was determined by substracting the initial from the final weight of each rat. Feed efficiency was calculated as: (weight gained / food consumed) x 100.
The data were analyzed using analysis of variance, correlation and regression (33). Duncan´s multiple range method (34) was used as a posteriori comparison of the means. For all these analyses, the level of significance was set at 5%. The BMDP statistical package version 7.0 (35) was used in all calculations.
RESULTS
Table 1 shows that the inclusion of furosemide in the diet of the rats caused a substantial increase in urine volume, proportional to the intake of this diuretic (y = 0.99 x +37.98, r = 0.86, p<0.01). The administration of the diuretic also caused a reduction in growth. This was associated with lower food intake and a severe decrease in feed efficiency.
Furosemide intake, food intake, feed efficiency, growth and urine volume in rats fed diets with increasing concentrations of furosemide for 15 days 1
Dietary Furosemide concentration (mg/g diet)
0 0.5 1.0 1.5
Furosemide
Intake (mg/15d) 0 a 84.5 ± 3.0 b 163.4 ± 12.5 c 226.5 ± 27.5 d
Food intake
(g/15d) 183.7 ± 23.7 a 165.4 ± 7.5 ab 161.2 ± 12.3 b 151.2 ± 18.2 b
Inicial weight
(g/15d) 128.2 ± 18.05 a 128.3 ± 19.22 a 127.7 ± 13.31 a 128.0 ± 12.88 a
Final weight
(g/15d) 180.1 ± 18.21 a 166.4 ± 18.88 b 162.3 ± 14.66 b 150.7 ± 20.3 c
(g/15d) 51.9 ± 8.6 a 38.1 ± 9.78 b 34.6 ± 4.0 b 22.7 ± 8.0 c
Feed efficiency
(%) 28.6 ± 5.8 a 21.9 ± 7.3 b 20.5 ± 2.1 b 12.6 ± 5.6 c
Urine volume
(mL/15d) 38.0 ± 13.5 a 119.2 ± 70.9 b 205.8 ± 70.8 c 257.4 ± 63.8 c
1
Data are mean ± SD for 6 rats per group. Within a row, values with different superscripts differ significantly, p< 0.05.Figure 1 shows that increased urine volume, caused by the administration of increasing concentrations of furosemide, was associated with elevations in urinary excretion of nitrogen, magnesium and retinol. The urinary excretion of these nutrients was proportional to urine volume. However, in accordance with the shape of the regression lines, the largest increment in nutrient excretion occurred in the first segments of the curve. This corresponded to urine volumes lower than 5 ml/24 hr and to dietary furosemide concentrations in the range of the 0.5 mg/g diet. It also corresponded to approximately 34 mg/kg body weight per day. The footnotes accompanying Figure 1 show equations for the regression lines explaining the effect of urine volume on the urinary losses of phosphorous, zinc, sodium and potassium in the same rats. The regression lines calculated for these minerals were similar to those shown for urinary nitrogen, magnesium and retinol in the figure. The slopes of these regression lines indicate that the effect of urine volume on nutrient excretion was more apparent in the case of magnesium, phosphorous and nitrogen than in the case of zinc, sodium, potassium and retinol. Relationships similar to those shown in Figure 1 and its footnotes were also found when dietary furosemide concentration or furosemide intake was used instead of urine volume as the independent variable. Also, the results showed that the diuretic caused an increase in plasma vitamin A and vitamin E. This increment was also proportional to urine volume. The relationship between urine volume (x) and plasma vitamin A (y) was explained by the straight line y = 0.019 x + 13.19 (r = 0.60, p< 0.01). The same relationship for vitamin E was y = 0.94 x + 296.6 (r = 0.35, p< 0.01).
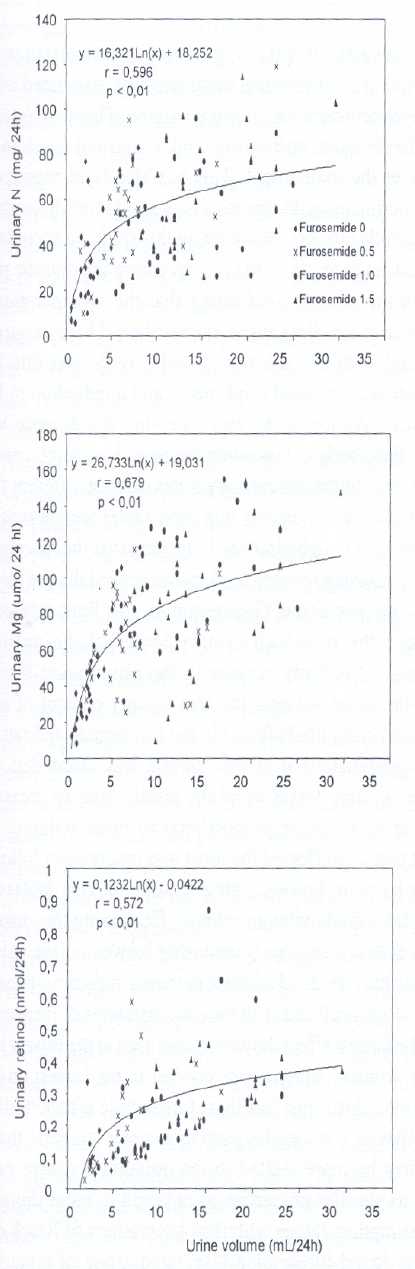
Relationship between urine volume (x) and urinary nitrogen, magnesium or retinol (y) in rats receiving increasing concentration of furosemide in the diet.
The figure shows the results of 5 individual urine collections performed on days 1, 4, 8, 12 and 15 of the experiment of each rat in each the four furosamide concentrations used (0, 0.5, 1.0 and 1.5 mg/g diet.). Similar relationships were found for urinary phosphorous expressed in m mol (y = 21.76Ln x –4.08 r= 0.56 p< 0.01), urinary zinc expressed in m mol (y = 0.18Ln x + 0.44; r = 0.45; p< 0.01), urinary sodium expressed in mmol ( y = 0.18Ln x + 0.43 r = 0.60 p< 0.01) and urinary potassium expressed in mmol ( y = 0.14 Ln x + 0.33 r = 0.68 p < 0.01).
Table 2 shows the fraction of the nutrient consumed which was lost in the urine of rats receiving increasing concentrations of furosemide in the diet. The percentage of the minerals and retinol consumed that was lost in the urine of the rats receiving the diuretic was higher than the loss seen in the control rats. The magnitude of these amounts varied with the nutrients. However in general terms, with the exception of phosphorous which increased approximately six times, the administration of furosemide was associated with a doubling in the fraction of the nutrient consumed that was lost in the urine.
Percent of the nutrient and electrolyte consumed that was excreted in a 24 h urine sample of rats receiving increasing concentrations of dietary furosemide 1.
Dietary Furosemide concentration (mg/g diet)
0 0.5 1.0 1.5
K 54.6 ± 21.9a 78.1 ± 11.3bc 85.1 ± 10.3c 67.6 ± 6.9ab
Na 42.3 ± 17.9a 73.0 ± 9.7b 66.2 ± 10.1b 75.1 ± 7.42b
Mg 14.7 ± 6.1a 22.4 ± 3.5a 38.2 ± 9.8b 32.6 ± 5.6b
N 11.7 ± 7.2a 21.3 ± 6.6b 20.3 ± 4.3b 26.3 ± 5.9b
Zn 10.0 ± 3.4a 13.6 ± 1.9ab 16.1 ± 3.0b 20.1 ± 3.5c
P 0.9 ± 0.5a 4.0 ± 1.8b 6.5 ± 1.7c 6.4 ± 1.3c
Retinol 0.3 ± 0.1a 0.5 ± 0.2ab 0.6 ± 0.1bc 0.7 ± 0.1c
1
Data are mean ± SD for 6 rats per group. Within a row, values with different superscripts differ significantly, p< 0.05. For calculating the values shown in the table, the average nutrient and electrolyte consumed and excreted in the urine on days 1, 4, 8, 12 and 15 of the experiment were used.Figure 2 shows that, the more the urine excreted the less the body content of protein, fat and potassium. Similar effects were also seen for total body ash, water and the rest of the minerals included in this study (footnotes Figure 2). In the majority of these cases, even though the relationship between body content and urine volume had negative slopes and negative correlation coefficients, they did not reach statistical significance. The footnotes of Figure 2 also show that total liver vitamin E and A showed tendencies to decrease in response to increase in daily urinary output.

Relationship between urine volume (x) and total body protein, total body fat or total body potassium (y) in rats receiving increasing concentrations of furosemide in the diet.
The figure shows the body content of protein, fat and potassium of the studied rats after receiving the four furosemide concentrations (mg/g diet) used in the study for 15 days. Similar relationships were found for total body ash, water, Mg, P, Na, K and total body Zn. With exception of total body Zn (y = -0.03 x + 58.61 r= -0.42 p<0.05), the rest also featured negative correlation coefficients. However, these did not reach statistical significance. Significant relationship between urine volume and liver vitamin E expressed in nmol (y = -0.32 x + 145.3 r = - 0.49 p< 0.05) with liver retinol, also in nmol ( y = - 1.73 x + 936.9 r = -0.43 p< 0.057), were found as well.
The results described here derive from urine collected every 24 hours for each rat on days 1,4,8,12 and 15. A correlation analysis including urine volume, urinary nutrient losses and experimental time showed that neither diuresis nor nutrient losses exhibited a significant tendencies to change over time.
DISCUSSION
The results of this experiment showed that the incorporation of furosemide in the diet was associated with a dose-dependent increase in urine volume. This was detected at the first urine collection and remained unchanged throughout the experiment. This has also been reported in other experiments with rats receiving similar or higher doses of furosemide (36-38). However, in this study, in accordance with Modena et al., (37), the rats receiving the diuretic grew less than the controls, indicating that the incorporation of furosemide in the diet caused malnutrition. The poor growth associated with the diuretic in this study was due to a combination of reduced food intake and a reduction in feed efficiency. Although the rats receiving the diuretic were smaller, their body composition expressed as the percentage of water, ash, lipids and carbohydrates was not different from the controls. This indicates that their lower weight was not simply related to dehydration. It appears that the diuretic, in addition to causing reduced food intake, limited the conversion of food into new tissue. One reason for this limitation could have been the increased urinary losses of the nutrients consumed. This finds support in the observation that the greater the urine volume, the less the net content of body protein and body lipids found in the furosemide-fed rats.
The administration of the diuretic was associated with increased urinary losses of all the metabolites we measured and these losses were proportional to urine volume. The nutrient that was affected the most was magnesium followed in order by phosphorous, nitrogen, sodium, zinc, potassium and the fat-soluble vitamin retinol. Examining the shape of the curves describing the relationship between urine volume and the urinary losses of all these nutrients, it became apparent that the losses occurred at all the concentrations of furosemide used. The largest effect, however, was seen at the lowest level of urine volume, which corresponded to the lowest dose of the diuretic. Also, the fact that furosemide affected all the metabolites in a somewhat similar manner suggests that its effect may be more related to the polyuria it causes rather than to its specific properties as opposed to other diuretics. This assumption agrees with the observations of Rieck et al. (20) who found furosemide-associated losses of thiamin in humans receiving low doses of this diuretic. They also are in line with the observations of Lubetsky et al. (18) who found that in rats, thiamin losses increased with furosemide, with other diuretics and also with volume load.
Comparing the nutrient and electrolyte losses associated with the administration of the diuretic with the intake of these same compounds, it is seen that the losses were important in magnitude since in most cases the diuretic almost doubled the fraction of the intake that was lost in the urine. In addition, these increased losses had consequences, since there was a tendency for the body reserves of all the measured compounds to decrease as the urine volume and the diuretic intake increased. This indicates that individuals using diuretics may have higher nutrient requirements than those who do not. It is interesting that this may apply not only to water-soluble electrolytes and micronutrients as has been shown before (14,16-22), but also to the macronutrients and liposoluble vitamins. This is because we found increased losses of nitrogen and retinol in the urine together with a tendency for lower body protein and lipids. Also we noted a lower liver content of both vitamin A and vitamin E in the rats receiving the diuretic. Although in this study the diuretic increased urinary losses of vitamin A, this increment was much lower than the urinary retinol losses seen by Alvarez et al. (24) in infection and diarrhea.
A point that should be addressed in regard to the possible nutritional implications of furosemide is the dose of the diuretic used. The usual therapeutic dose of this diuretic in hypertensive patients falls in the range of 40mg to 240 mg once or twice a day (9) or approximately 0.61 to 7 mg/kg per day. Hovewer, patients with severe congestion of the lungs, liver, and spleen, as well as ascites, pleural effusions and peripheral edema associated with heart failure are treated with high doses of diuretics (39). Edema associated with heart failure is a problem that affects a large number of people. It is the only cardiovascular disorder that is increasing both in incidence and prevalence and it is the most common medical diagnosis for hospitalized patients aged > 65 years (39). In these patients, the administration of 0.5 to 4g furosemide per day, for a few days to many months has been successfully used to alleviate congestion (8,39-44). These doses represent approximately 7 – 57 mg/kg body weight per day and they are in the range administered to the rats studied in this experiment, which consumed 34-103 mg/Kg/day during 15 days. High doses of furosemide (6.5 -25.5 mg/kg/day) have also been used to prevent oliguria associated with renal failure (45). A recent report of long-term furosemide abuse (46) showed that the daily dose of this diuretic ranged from 40 to 2800 mg/day or approximately 0.6 to 40 mg/kg/day. The studied subjects used this diuretic in order to control weight or edema, and they used for 3 to 28 years (46). From the previous analysis it is apparent that compared with the lowest dose used for the treatment of hypertension in humans, the rats studied here consumed from 56 to 168 times more furosemide (but for a much shorter time). However, the doses used in this study, did not greatly exceed the doses used in humans with renal or congestive heart failure or the amounts consumed by adult furosemide abusers. Therefore, the doses we administered may be used to evaluate the effect of this diuretic on nutritional status in longer-term studies.
In general, this study indicates that furosemide utilization may result in a deterioration of nutritional status including both the macro and the micronutrients. Based on the results of this study, it appears that individuals receiving high doses of this diuretic for long periods of time should pay special attention to dietary intake of all essential nutrients. This is important because it has been observed that older patients with congestive heart failure do not fulfill their daily nutritional requirements of thiamin (17). Also, this recommendation agrees with the results of Ali and Al-Qaravi, (16) who reversed thiamin deficiency in furosemide-treated rats with thiamin supplements. The recommendation is also in line with the results of Shimon et al. (21) who found, after thiamin repletion, an improvement in left ventricular function in long-term furosemide treated patients with moderate-to-severe congestive heart failure. The results of this study suggest that not only thiamin but also the rest of the essential nutrients including the macronutrients and the fat soluble vitamins, merit careful attention.
Studies in humans and further studies with animals appear to be needed to determine what nutritional precautions need to be taken when the use of diuretics is recommended.
In general, this study, together with our studies on the effect of diarrhea on fecal nutrient losses, indicates the following: in order to maximize the utilization of dietary nutrients, adequate intestinal absorption as well proper renal reabsorption are required. This is so because diarrhea reduces nutrient absorption and high diuresis reduces nutrient retention.
REFEREBCES
1. Mitchell HH. A method for determining the biological value of protein . J.Biol.Chem. 1923; 58:873-922. [ Links ]
2. Liuzzi JP, Cioccia AM, Hevia P. In well fed young rats lactose induced chronic diarrhea reduces the apparent absorption of vitamin A and E and affects preferentially vitamin E status. Journal of Nutrition 1998; 128: 2467-72. [ Links ]
3. Hevia P, Carías D, Cioccia AM, González E. Diarrea y Nutrición: experiencia en niños y ratas. Anales Venezolanos de Nutrición 1998; 11: 28-36. [ Links ]
4. Carías D, Cioccia AM, Hevia P, Romer H, Guerra M, Brito, O. Utilización de Nutrientes en niños con diarrea aguda alimentados con fórmula a base de pollo y de soya. Archivos Latinoamericanos de Nutrición 1999; 49: 130-7. [ Links ]
5. Arciniegas EL, Cioccia AM, Hevia P. Efecto de la diarrea inducida con lactosa sobre la disponibilidad de los macronutrientes y la función inmune en ratas nutridas y desnutridas. Archivos Latinoamericanos de Nutrición 2000; 50: 48-54. [ Links ]
6. González E, Sánchez G, Cioccia AM, Hevia P. Absorción de grasa proveniente de tres fuentes dietarias en ratas con diarrea inducida con lactosa. Archivos Latinoamericanos de Nutrición 2001; 51: 244-49. [ Links ]
7. De Lima M, González E, Cioccia AM, Hevia P. Efecto de la diarrea osmótica y secretora sobre la función y morfología del intestino en ratas. Archivos Latinoamericanos de Nutrición 2002;52: 20-8. [ Links ]
8. Rasool A, Palevsky PM. Treatment of edematous disorders with diuretics. American Journal of Medical Science 2000; 319:25-37. [ Links ]
9. Puschett JB. Diuretics and the therapy of hypertension. American Journal Medical Science 2000; 319:1-9. [ Links ]
10. Neumark-Sztainer D, Story M, Hannan PJ, Perry CL, Irving LM. Weight-related concerns and behaviors among overweight and nonoverweight adolescents: implications for preventing weight-related disorders. Archives of Pediatric and Adolescent Medicine 2000; 156:171-8. [ Links ]
11. Serdula MK, Collins ME, Williamson DF, Anda RF, Pamuk E, Byers TE. Weight control practices of U.S. adolescents and adults. Annals of Internal Medicine 1993 ;119:667-71. [ Links ]
12. DePalma MT, Koszewski WM, Case JG, Barile RJ, DePalma BF, Oliaro SM. Weight control practices of lightweight football players. Medical Science Sports and Exercise 1993; 25:694-701. [ Links ]
13. Moore JM, Timperio AF, Crawford DA, Burns CM, Cameron-Smith D. Weight management and weight loss strategies of professional jockeys. International Journal of Sport Nutrition Exercise and Metabolism 2002;12: 1-13. [ Links ]
14. Greenberg A. Diuretic complications. American Journal of Medical Science 2000; 319:10-24. [ Links ]
15. Escott-Stump S, Hypokalemia. In: Nutrition and Diagnosis Related Care. Maryland :Lippincott Williams & Wilkins; 1997. [ Links ]
16. Ali BH, Al-Qarawi AA. Thiamin status in furosemide-trated rats. Pharmacology Research 2000; 42: 21-4. [ Links ]
17. Brady JA, Rock CL, Horneffer MR. Thiamin status, diuretic medication, and the management of congestive heart failure. Journal of the American Dietetic Association 1995; 95: 541-44. [ Links ]
18. Lubetsky A , Winaver J, Seligmann H, Olchovsky D, Almog S, Halkin H, Ezra D. Urinary thiamine excretion in the rat: effects of furosemide, other diuretics and volume load. Journal of Laboratory and Clinical Medicine 1999; 134:232-7. [ Links ]
19. Mydlik M, Derzsiova K, Zemberova E. Influence of water and sodium diuresis on furosemide on urinary excretion of vitamin B6, oxalic acid and vitamin C in chronic renal failure. Mineral Electrolyte Metabolism 1999; 25:352-6. [ Links ]
20. Rieck J, Halkin H, Almog S, Seligman H, Lubetsky A, Olchovsky D, Ezra D. Urinary loss of thiamin is increased by low doses of furosemide in healthy volunteers. Journal of Laboratory and Clinical Medicine 1999; 34: 238-43. [ Links ]
21. Shimon I, Almog S, Vered Z, Seligman H, Shefi M, Peleg E, Rosenthal T, Motro M, Halkin H, Ezra D. Improved left ventricular function after thiamine supplementation in patients with congestive heart failure receiving long-term furosemide therapy. American Journal of Medicine 1995;98:485-90. [ Links ]
22. Suter PM, Haller J, Hany A, Vetter W. Diuretic use: a risk for subclinical thiamine deficiency in elderly patients. Journal of Nutrition Health and Aging 2000; 4: 69-71. [ Links ]
23. Krishnamurty D, Shyamala D. Blood pressure regulation and micronutrients. Nutrition Research Reviews 2001;14:3-43. [ Links ]
24. Alvarez J, Salazar E, Kohatsu J, Miranda P,. Stephensen Ch B. Urinary excretion of retinol in children with acute diarrhea. American Journa of Clinical Nutrition 1995; 6:1273-76. [ Links ]
25. American Institute of Nutrition. Report of the American Institute of Nutrition ad hoc committee on standards for nutritional studies. Journal of Nutrition 1993;107:1340-48. [ Links ]
26. National Research Council. Guide for the Care and Use of Laboratory Animals. . Washington DC: National Academy Press; 1996. [ Links ]
27. Hevia P, Cioccia AM. Application of a colorimetric method to the determination of nitrogen in nutritional studies with rats and humans. Nutriton Reports International 1988; 38:1129-36. [ Links ]
28. Blight EG, Dyer WJ. A rapid method of total lipid extraction and purification Canadian Journal of Biochemistry and Physiology 1959; 37:911- 16. [ Links ]
29. Perkin-Elmer . Analytical methods for Atomic Absorption Spectrophotometry. Norwalk Connecticut; 1982. [ Links ]
30. Bartlett GR. Phosphorous assay in column chromatography. Journal of Biological Chemistry 1958; 234: 466-68. [ Links ]
31. Ueda T, Igarashi O. Determination of vitamin E in biological specimens and foods by HPLC. Pretreatment of samples and extraction of tocopherols. Journal of Micronutrient Analysis 1990;7:79-86. [ Links ]
32. Chow FI, Omaye ST.Use of antioxidants in the analysis of vitamins A and E in mammalian plasma by high performance liquid chromatography. Lipids 1983;18: 837-41. [ Links ]
33. Daniel WW. Bioestadistica base para el análisis de las ciencias de la salud. México: Uthea Noriega; 1999. [ Links ]
34. Duncan DB. Multiple range and multiple F test. Biometrics 1955; 11: 1-6. [ Links ]
35. BMDP Statistical Software Inc., BMDP User´s Guide. Los Angeles Cal. 1993. [ Links ]
36. Scherzer WH, Popoptzer MM. Inhibition of thick ascending limb Na+-K+-ATPase activity in salt-loaded rats by furosemide. American Journal of Physiology 1989; 256:549-55. [ Links ]
37. Modena B, Holmer S , Eckardt KU , Schricker K, Riegger G, Kaissling B, Kurtz A. Furosemide stimulates renin expression in the kidneys of salt-supplemented rats. Pflugers Archives 1993; 424:403-9. [ Links ]
38. Merino A, Moreno G, Mercado A, Bobadilla NA, Gamba G. Na(+):K(+):ATPase mRNA expression in the kidney during adaptation to sodium intake and furosemide treatment. Archives of Medical Research 2000; 31: 486-92. [ Links ]
39. Howard PA, Dunn MI. Aggressive diuresis for sever heart failure in the elderly. Chest 2001;119: 807-10. [ Links ]
40. Kuchar DL, O´Rourke MF. High dose furosemide in refractory cardiac failure. European Heart Journal 1985; 11: 954-58. [ Links ]
41. Gerlag PG, van Meijel JJ. High-dose furosemide in the treatment of refractory congestive heart failure. Archives of Internal Medicine 1988;148: 286-91. [ Links ]
42. Dormans TP, van Meyel JJ, Gerlag PG, Tan Y, Russell FG, Smits P. Diuretic efficacy of high dose furosemide in severe heart failure: bolus injection versus continuous infusion. Journal of the American College of Cardiology 1996; 2: 376-82. [ Links ]
43. Murray MD, Deer MM, Ferguson JA, Dexter PR, Bennet SJ, Perkins SM, Smith FE, Lane KA, Adams LD, Tierney WM, Brater DC. Open-label randomized trial of torsemide compared with furosemide therapy for patients with heart failure. American Journal of Medicine 2001; 111: 513-20. [ Links ]
44. Licata G, Di Pasquale P, Parrinello G, Cardinale A, Scandurra A, Follone G, Argano C, Tuttolomondo A, Paterna S. Effect of high-dose furosemide and small-volume hypertonic saline solution infusión in comparison with a high dose of furosemide as bolus in refractory congestive Herat failure: long-term effects. American Heart Journal 2003; 145: 459-66. [ Links ]
45. Prandota J. High doses of furosemide in children with acute renal failure. A preliminary retrospective study. International Urology and Nephrology 1991; 23: 383-92. [ Links ]
46. Kim YG, Kim B, Kim MK, Chung SJ, Han HJ, Ryu JA, Lee YH, Lee KB, Lee JY, Huh W, Oh HY. Medullary nephrocalcinosis associated with long-term furosemide abuse in adults. Nephrology Dialysis Transplant 2001;16:2303-9. [ Links ]

