


Servicios Personalizados
Revista
Articulo
 Articulo en XML
 Referencias del artículo
 Enviar articulo por email
Indicadores
-
 Citado por SciELO
 -
 Accesos
Links relacionados
-
 Similares en
SciELO
Similares en
SciELO
Compartir

 Permalink
Revista de la Facultad de Ingeniería Universidad Central de Venezuela
versión impresa ISSN 0798-4065
Rev. Fac. Ing. UCV v.20 n.4 Caracas oct. 2005
Sediment Thickness and a WEST-EAST Geologic Cross Section in the Caracas Valley
PETER KANTAK1,2, MICHAEL SCHMITZ1, FRANCK AUDEMARD1
1FUNVISIS, Dpto. de Sismología y Dpto. de Ciencias de la Tierra, e-mails: mschmitz@funvisis.gob.ve;
faudemard@funvisis.gob.ve,
2Universität Bonn, Alemania, e-mail: schuetzig@yahoo.com
ABSTRACT
Caracas is located at the Caribbean - South America plate boundary zone, with an associated strike slip fault system, which accommodates the relative movement of both plates and is responsible for the seismic hazard in the region. The damage pattern of the 1967 Caracas earthquake emphasized the existence of important site effects due to the sedimentary basin fill of the Caracas valley. A revised map of the sedimentary thickness was developed during this study, based on drill holes (mostly from water exploration) and results of seismic refraction investigations. A local depression in the area of Los Palos Grandes / Santa Eduvigis with exceptionally high values of more than 300 m could be confirmed by the available data. The shape of the depression seems to be controlled by NW - SE striking tectonic features rather than east-west striking features, as suggested by previous compilations. The second most important depth of the valley fill, in San Bernardino, reaches 140 m, while sediment thickness in the remaining areas does not exceed 80m. The east-west geological cross section through Caracas valley (along Metro line 1) permits the recognition of the four main lithological units of the Quaternary sediments: alluvial fan deposits, which can be subdivided into a proximal and a distal facies, terrace deposits of the Guaire River, and lacustrine floodplain deposits originated in buildups of Guaire River and its tributaries. The classification of the sediments for seismic microzoning purposes is supported by local seismic refraction studies, which give information on the velocity structure of the uppermost sedimentary strata.
Keywords: Caracas, alluvial sediments, seismic microzoning, seismic refraction, GIS.
ESPESOR DE SEDIMENTOS Y UNA SECCIÓN TRANSVERSAL GEOLÓGICA OESTE-ESTE EN EL VALLE DE CARACAS
RESUMEN
La ciudad de Caracas está ubicada en la zona de contacto entre las placas del Caribe y de Sudamérica marcada por una amplia zona de fallas transcurrentes que acomodan su movimiento relativo y son responsables de la amenaza sísmica de la región. La distribución de daños generados por el terremoto de Caracas del año 1967 pone en evidencia la existencia de efectos de sitio importantes debido al relleno sedimentario del valle de Caracas. En este estudio se compiló un mapa revisado de los espesores de los sedimentos aluviales, basado en información de pozos (en su mayoría de exploración de aguas subterráneas) y resultados de estudios sísmicos de refracción. Una depresión local en la zona de Los Palos Grandes / Santa Eduvigis con un espesor de sedimentos mayor de 300 m ha sido confirmada por este estudio. La forma de la depresión parece controlada por accidentes tectónicos de rumbo NO - SE y no de rumbo O - E como sugieren compilaciones anteriores. La segunda profundidad más importante del relleno del valle, ubicada en San Bernardino, alcanza 140 m, mientras el espesor del sedimento no excede 80 m en el resto del valle. Una sección geológica O - E del Valle de Caracas (a lo largo de la línea 1 del Metro) permite reconocer las cuatro unidades litológicas principales de los sedimentos cuaternarios: depósitos de abanicos aluviales, que pueden ser sub-divididos en facies proximal y distal, terrazas del Río Guaire y depósitos lacustres generados por represamientos del Río Guaire y sus tributarios. La clasificación de los sedimentos para fines de microzonificación sísmica está apoyada en estudios de refracción sísmica locales, que proporcionan información sobre la estructura de velocidades de los sedimentos más superficiales.
Palabras claves: Caracas, sedimentos aluviales, microzonificación sísmica, refracción sísmica, SIG.
Recibido: mayo de 2003 Recibido en forma final revisado: diciembre de 2005
1. INTRODUCTION
Due to its location at the boundary between the oceanic Caribbean plate and the continental South American plate with a main fault system characterized by dextral strike-slip movements of about 1-2 cm/year (Audemard et al., 2000; Weber et al., 2001), Caracas, the capital of Venezuela, is subject to a moderate to high seismic hazard (e.g. Molina et al., 2002). Caracas is located in zone 5 of the seismic zoning map of Venezuela (Covenin, 2001) with maximum accelerations on bedrock of 0.3 g. The city of Caracas has been affected several times by disastrous earthquakes (table 1) and the most recent one, the 1967 Caracas earthquake, has been studied by a number of researchers, regarding the source mechanism (e.g. Suárez and Nábelek, 1990), the wave propagation (Papageorgiou and Kim, 1991), the characteristics of the sediments of the Caracas valley (Weston, 1969; Singer, 1977), and the relation between structural damage intensities, building characteristics (number of stories), sedimentary thickness and fundamental periods of the soil (e.g. Funvisis, 1978; Seed et al., 1970).
The effects of the soil conditions on the damage distribution have been evidenced with the concentration of the damage in the San Bernardino and Los Palos Grandes districts, areas which are characterized by a sediment thickness of over 100 and 300 m, respectively (figure 1).

Recently, microtremor measurements have been done in theCaracas valley for the evaluation of ground shaking
characteristics (Abeki et al., 1998; Enomoto et al., 2002; Rocabado et al., 2002; Semblat et al., 2002). The behaviour of the H/V curves is strongly related to the thickness of the sediments, and the areas of longest periods of soil vibrations coincide well with the regions strongly damaged during the

1967 earthquake. Predominant periods as high as 2.1 s are calculated for the center of the basin fill. Rock sites outside the basin show a predominant period of down to 0.2 s. The aim of this contribution is to provide comprehensive information essential to the performance of seismic and geological microzoning and estimating the vulnerability of the Caracas valley. We present the characteristics of a geological cross section of the alluvial deposits based on existing test boring data of the Metro line 1 (for location see figure 1), and the thickness of the unconsolidated sediments within the valley from the compilation of existing water well and geophysical data. Near surface seismic data are displayed to outline S-wave velocities in some type areas of Caracas. Nevertheless, further geophysical and geological data are required in the future for a more detailed image of
the soil-bedrock interface and improvement of the derived models.
2. GEOLOGY OF THE CARACAS AREA
2.1 Geological setting
The Caracas valley lays within the Cordillera de la Costa, belonging to the Caribbean mountain range (e.g. Bellizia & Dengo, 1990), that trends east-west along the north coast of Venezuela. The central zone is influenced by the San Sebastián, La Victoria and Tacagua El Ávila fault systems (Beltrán, 1993; Audemard et al., 2000). The Cordillera de la Costa forms the northern part of the Caribbean Mountain Range, comprising Precambrian to Mesozoic gneisses, amphibolites, marbles and schists (Urbani & Ostos, 1989), and is limited to the north by the Caribbean Sea through the east-west striking San Sebastian fault system. In the south, it is separated from the Serranía del Interior by aligned tectonic depressions, from west to east: valleys of Aragua, Santa Lucia – Ocumare del Tuy basin and Barlovento basin. The La Victoria fault plays a mayor role in controlling these
depressions.
As to topography (figure 2), the Caracas region can be divided into three main areas: the mountain range in the
north of Caracas valley, called Sierra del Avila, the Caracas valley, and the hills at the south and west of Caracas. The Sierra del Avila divides the Caracas valley from the Caribbean Sea with the highest peak reaching a height of 2765 m. The northern slopes are steep and dissected by deep V-shaped valleys, whereas the southern slope bounds the Caracas valley on the north along the east-west striking El Ávila fault with creeks flowing into the Caracas valley incising deeply into the mountains. The Caracas valley extends in the east-west direction,
exhibiting a relatively flat-floored topography between the Avila range and the hills It has a length of about 25 km from Antimano in the west to Petare in the east with a width of about 4 km in the northsouth (figure 2). The average elevation of the valley floor is about 900 m. In the northern part of the valley, the rivers flowing from the Avila range into the Caracas valley formed alluvial fans at the foot of the mountain range. In the southern
part, the Guaire River runs from west to east against the southern edge of the valley, changing abruptly its course to the south in Petare on the eastern edge of the valley. With elevations between 1200 and 1400 m, the hills at the south and west of the Caracas valley are lower than Sierra del Avila, and their slopes are much gentler.
Caracas valley is a halfgraben, subsided at the north side through the contact with the Avila fault that strikes eastwest, and divides the valley from the Avila range (Singer, 1977). The dip of the mayor component of the Avila fault is nearly vertical, dipping partly southward, and partly northward (inversed). The sediments deposited in this tectonic depression consist of alluvial fan deposits originated from the Sierra del Avila, fluvial deposits of Guaire River and its tributaries, and varved lacustrine sediments of local extent. According to the predominant lithology, the alluvial fan deposits can be divided into a chaotic proximal facies and a fine distal facies, as proposed by Singer (1977) for the debris flow deposits of the Holocene in the eastern part of the valley. In the west, the creeks coming from the Avila range are deeply incised into the alluvial depression. In the east, the chaotic proximal facies was deposited in the northern part of the valley, and consists of materials with coarse to very coarse particle size. They are widely dominated by angular to subangular gravel in a sandy matrix, but there are also units with pebbles, cobblestones, and boulders up to a few m3, which are irregularly arranged without preferred orientation. Silts and clays play a subordinated role in this region.
More to the south, the material changes transitionally and interfingers into a distal fine facies, with materials generally of finer particle size; large boulders are very rare. Most of these materials are sand dominated, with a more subordinated role of gravel. Silts and clays are more frequent, but still subordinate. Thin layers of coarse sand, frequently with organic material of chestnut color, are typical for this facies (Singer, 1977). The fluvial deposits accumulated by the Guaire River and its tributaries occupy the south of the valley, were it runs west-east. Delaware (1950) indicated several terrace levels of Guaire River, with unknown elevations. These terraces show many curves, indicating strong meandering when the river occupied the respective elevations. Interbedded with these terraces exist layers of sandy silts and/or layers of Holocene mud with a thickness of several meters. These layers correspond to floodplain deposits originated by strong inundations caused by buildups of the Guaire River and the creeks flowing from north into the valley. These layers are interbedded with the distal parts of the alluvial fans.
At isolated locations in the Caracas valley varved lacustrine sediments of Pre-Holocene age were found. These are of two facies, one silty-clayey of alternated colors of ochre and coffee, and the other with grayish, silty clays and fine sands or red silts. The mineralogical composition of the clays indicates local inputs of colluvial materials originated in soils developed over the calcareous Las Mercedes Schists.
The sediments have thickness between 6 and 15 meters and their bases have elevations that differ by more than 50 m. This indicates that they represent local, closed systems, probably controlled by buildups of Guaire River. The stratigraphic sequence of the Quaternary sediments is widely unknown, but Singer (1977) divides the alluvial fan deposits

in the eastern part of the Valley into three lithostratigraphic units of Pre-Holocene age, with a gradual change from older to younger deposits, from north to south in the valley, and the sediments originated in debris flows during the Holocene.
2.2 Geological cross section
A geological cross-section was constructed from 208 wells with depths of 20 to 30 m, which were carried out for the underground construction of the Caracas subway in 1976.
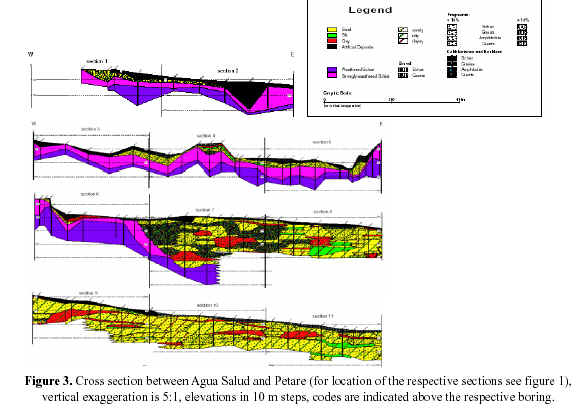
The wells were performed by several engineering consulting companies, and show, in comparison to other wells carried out in the valley, a very good quality. The well logs generally include a good lithologic description, results of Standard Penetration Tests (SPT), and in most cases test results, such as particle size, natural water content and plasticity limits. The wells are located along the roughly east-west striking Line 1 of the Caracas subway, crossing nearly the complete valley between Agua Salud (west) and Petare (east) stations with a length of 15 km (figures 1 and 3). The correlation of the wells was carried out in three steps:
first, a digital database was built up by means of the software Rockworks, which permits the digital generation of geologic profiles. This database includes the basic information of the wells, such as their position, depth, well markers, and their main lithologic characteristics (composing materials, particle size, and colour) in the form of abbreviations. Second, a plot of the profile was made based on this database using the program Rockworks and later exported to the GIS program MapInfo. In the third step, the correlation of the wells was done by means of the CAD functions of MapInfo and the generation of patterns and symbols for the layout. The cross section was finally linked with the digital map that includes the position of the wells, so that the information of the respective wells can easily be recalled within the GIS.
The correlation itself was carried out by interpretation of the well logs, taking into consideration lithology (schist,
gneiss, amphibolites etc.), particle size, colour, SPT results, and special characteristics such as the presence of organic materials. The first correlation steps were done by correlating the rocks and weathered rocks of schist at the east and west end of the profile based on the SPT, since they form a separate unit, easily distinguishable from the sediments. Another unit that was easy to distinguish is the artificial fills, which were grouped together with road surfaces in one unit forming a superficial layer that can be observed along nearly the complete profile. The alluvial sediments were now roughly divided regarding their source rocks, such as schist, gneiss, amphibolites, and an account of their grain size, such as sands, silts, clays, gravel and pebbles. Then, very characteristic and rarely appearing units were correlated, thus being index layers. These are for example very clean silts and clays, which sometimes can be observed over longer distances, layers with organic components, as well as characteristic bodies with a very high content of gravel and boulders. The largest and very frequently appearing units were correlated at the end. The profile provides the characteristics of the different geological
units within the valley, which can be divided into three groups: alluvial fan deposits, which can be subdivided into a proximal and a distal facies, floodplain, and terrace deposits.
The alluvial fan deposits, essentially transported as debris and mudflows from the Avila range on the north into the valley, are the major constituent of the sediments deposited in the valley. The materials generally consist, according to the source rocks composing the Avila range, of rather coarse detrital sediments of schist, gneiss and locally amphibolites, and are in its majority composed of lenticular and irregular shaped units of limited extent, and thin, but more extended, units of finer grained sediments deposited during overbank flows. The thickness of the beds vary generally between 1 to 5 meters, but there are also units of only a few decimeter,
and occasionally very thick ones with more than 5 m. Based on the material characteristics and geometry of the layers, two facies types can be distinguished, a proximal facies with coarse to very coarse particle size and a distal facies with finer particle size, which is sand-dominated, with mainly little, or no fragment portions (Singer, 1977). At their downstream end, the debris flows often terminate in characteristic lobes, with concentrations of large boulders and gravel (levees) (Singer, 1977).
The fluvial facies deposited by the Guaire River and its tributaries crops out along the southern part of the Caracas valley, where the river runs west-east. Here we can observe terraces, consisting of gravel in a sandy matrix deposited when the river occupied the respective elevations. Interbedded with these terraces exist deposits, dominated by layers of clean silts and clays with a very low portion of sand, free of rock fragments or gravel and sometimes with organic material or discolorations of decomposed organic material. The layers reach thicknesses of a few decimeters up to 9 m, and extend over large distances, of several hundred meters. The layers can be observed in the proximities of Guaire River, and are the result of large floods caused by buildups of the river. These layers are interbedded with alluvial fan deposits belonging to the distal facies. At the east and west end, the profile reaches the surrounding ranges of the Caracas basin, where the thickness of the alluvial sediments strongly decreases and metamorphic rocks are exposed, or only covered by a few meters of sediments
(0 to 5 m). The rocks consist mainly of calcareous quartzmica schist belonging to the Las Mercedes Schists and show a very strong weathering in the upper parts that decreases with increasing depth.
Due to the changing lithology and geometry of the geological units, the profile can be divided into several parts. In the following, the characteristics of the geology in the different parts of the profile will be described. Between sections 1-6 (Agua Salud - Capitolio), the profile belongs to the western outskirts of the basin, where the sediment thickness is very thin and the calcareous quartz-mica schist of the Las Mercedes Schists is exposed or only covered by a few meters of sediments (Kantak, 2001). This area was with few exceptions not influenced by alluvial fans, and the sediments covering the rocks are composed of residual deposits and talus or colluviums from the adjacent slopes, consisting mainly of coarse-grained materials such as gravel and layers with many fragments, generally in sandy matrix, but there are also silty and clayey layers. In section 4 an isolated channel deposit can be observed, consisting of amphibolite boulders in a sandy matrix.
Between sections 7-8 (Capitolio), the metamorphic rocks disappear beneath the alluvial fan deposits. Small channels of lenticular shape and limited extend dominate section 7, located at the western edge of the Caracas basin. They generally consist of coarse-grained material, with large portions of fragments, gravel, cobblestones and boulders, and belong to the proximal chaotic facies of the alluvial fan deposits. The channels are vertically and horizontally stacked, the younger ones cutting the older ones. The channel fills are generally boulders and cobblestones of amphibolite, schist and quartz in a sandy matrix as well as sandy units with varying portions of fragments. Silty sands free of rock fragments and silt and clay dominated layers are also observed, probably originated during overbank flows. A clear change of the lithology and geometry of the units is observed between sections 8-12 (Capitolio-Bellas Artes).
The materials are generally finer grained, without cobblestones and boulders. The units are lenticular and irregularly shaped and often with longer lateral extent than at section 7, indicating the transition to the distal fine facies of the alluvial fan deposits. Channel fills are sand dominated with varying but mainly small portions of fragments consisting of schist and quartz. Also here silts and clays are subordinated. Amphibolites disappear completely in this region indicating a change of the source rocks.
Again, important changes can be observed between sections 12-21 (Bellas Artes - Chacaito). The units are as before generally sand dominated, and cobblestones and boulders are absent, but the units are less lenticular shaped and there are many thick beds (> 5 m) of silty sands. The increasing presence of silt and clay dominated layers reflects the increasing proximity of the Guaire River, and the presence of floodplain deposits. Here, we can observe silts and clays that extend over long distances, of hundreds of meters, including partly organic material or discolorations of decomposed organic material that can be observed within the silts and clays. These layers have a thickness of several meters and become very thick in the sections 18 and 19 with up to 9 m and were deposited during strong flooding, caused by buildups of the Guaire River. They are interbedded with alluvial fan deposits belonging to the distal facies. At the bottom of sections 16 to 21 we can observe an extended
layer consisting of silty sands with a very high content of schist and quartz fragments. This layer has to be interpreted as a unit deposited originally as sandy gravel consisting of schist and quartz, probably forming part of one of the terraces deposited by the Guaire River. The schist of these sediments was strongly weathered and decomposed, so that in the well logs only fragments of schist and/or quartz can be observed.
With increasing distance to the Guaire River in sections 22- 27 (Chacaito-Altamira) the presence of floodplain deposits decreases strongly, and alluvial fan deposits, belonging to the distal fine facies, are again predominating in the subsurface (similar to sections 9-12). We can observe generally sand dominated deposits with no, or generally small portions of fragments of quartz and schist. But there are also layers with a higher content of fragments, which are more frequent towards the south. The thickness of the units varies strongly between layers several m in thickness and thin layers of only 2 m and less. The layers in some cases are lenticularly shaped, but generally predominate as irregularly shaped and horizontally extended layers. This area corresponds to the distal fan area, changing transitionally and interfingering to the proximal area in the north.
Between sections 27-36 (Altamira - La California) the proximal fan facies becomes dominant, reflecting the closer
distance to the Avila. Here the units are more lenticularly shaped and channel fills consisting of cobblestones and
boulders in sandy matrix as well as sandy ones with high content of fragments are very frequent. There are also sandy layers with fewer portions of fragments, but in contrast to the distal facies, fragments are almost ever present, and layers free of fragments are rare. In contrast to the proximal facies dominating in sections 8 and 9, the layers here are more extended, some are a few hundred meters in length, and sow considerable thicknesses of up to 14 m, indicating very strong debris flow events in this part of the valley. In this part we can also observe an important change of the source rocks, since they consist here of gneiss, schist and quartz. The gneiss could not be observed in the other parts of the profile and reflects the change of the source rocks
belonging to the San Julian schist exposed in the western part of the Avila range, to the rocks belonging to the Peña de Mora augengneiss.
In sections 37 and 38 (La California-Petare) we change to the outer ranges of the basin, with strongly decreasing sediment thickness and the metamorphic bedrock of the basin at a depth of only a few meters. Here, weathered calcareous quartz-mica schist belonging to the Las Mercedes Schists is exposed or only covered by a few meters of alluvial deposits.
2.3. Thickness of the Quaternary sediments
A large number of wells and geophysical investigations has been carried out in the last century in the Caracas valley by varying institutes and organizations, which resulted in two maps of the bedrock depth, one including only information of wells (Delaware, 1950) and the other one both well data and geophysical information (Weston, 1969; figure 1), which in fact is a revised version of the Delaware (1950) map including new seismic refraction data obtained after the 1967 Caracas earthquake. Both maps do not show the location of the base information needed to construct the maps, but the Weston report (Weston, 1969) does include detailed
quadrangle maps with specific refraction profile locations.
The map of the sediment thickness presented here is based on the data displayed in the maps of Delaware (1950) and Weston (1969) and additional well data. The aim was to provide a database that can be updated in the future and thus integrate new geological and geophysical information on the subsurface of Caracas valley.
In the Caracas valley, probably several thousands of wells have been drilled during the last century, which can be divided into two groups. One of them contains the wells for geotechnical studies, carried out for private companies as well as for public institutions. These wells form the large majority, and generally do not exceed depths of more than 30 m. Therefore, they are of minor interest for the creation of a bedrock map, since they reach the bedrock only in the outskirts of the valley and only a few of them were integrated in the model. The other group of wells contains those carried out in the scope of hydrogeologic investigations. These wells
are, in contrast to the geotechnical wells, of very limited use for geologic investigations, because of their very poor lithologic descriptions, but they are of special interest for the determination of the bedrock depth, as they reach depths generally between 50 and 100 m and in some cases even more. These wells and the seismic profiles form the majority of the data used for the creation of the bedrock map herein presented.
Most of the wells analyzed in this study originate from the hydrologic investigation carried out by Delaware (1950). The original data and documents of this study were almost completely destroyed, but the preliminary report that has been preserved, includes in the tabular listings of the hydrologic data of the wells a row with the information on bedrock depth. The wells used from this investigation amount to 130. The other hydrologic wells used for the determination of the bedrock depth are the wells carried out by Hidrocapital in the last 20 or 30 years. The data of these wells were compiled by the Hydrological Department of the Ministry of Environment (MARNR) and were kindly made available to the author; 40 wells of this origin were integrated into the model.
The geophysical data used for the determination of the sediment thickness are the results of the seismic refraction study carried out by Weston (1969) in order to determine the sediment thickness in the Caracas valley and also at selected sections of the Litoral Central. The quality of thesedata and the map created in this study could not be assessed, since the original seismic data are destroyed and they were not displayed in the official reports. The map created by Weston is basically a revised edition of the map of Delaware (1950), including the significant new data obtained from seismic refraction measurements. There is one important difference between both maps in the area of exceptionally high sediment thickness in Los Palos Grandes. Weston (1969) indicates a thickness up to 300 m (figure 1), whereas Delaware (1950) only accounts for 230 m of sediment thickness. The data of Weston (1969) was integrated by assigning the determined bedrock depth to the respective shot points of the refraction surveys. The map of the sediment thickness presented in this contriution is based on data of 168 wells and 14 refraction surveys (figure 4). The location of the wells and of the geophysical data used is indicated on the map and available in the digital database. It can be observed that there is an irregular, but relatively good distribution of well data in the complete valley, with exceptions in Los Palos Grandes and
in the area of the Country Club, at the west of Los Palos Grandes. In these areas, the model is based on the geophysical data of Weston (1969) only.
The map of the sedimentary thickness displayed in figure 4 was created from a digital database (GIS) of the well and geophysical data, and the model of the sediment thickness was carried out with Surfer, an application that permits modeling with a variety of gridding methods. Since the data is very irregularly distributed, «krigging», a geostatistical gridding method that has the characteristic to be very flexible and suitable to produce contour and surface plots from irregular spaced data, resulted as the most suitable gridding method for the interpretation of the data. The gridding with «krigging» is influenced by several options, which were tested during the elaboration of the final map. Since the data are not considered to have a linear or quadratic trend, the model of the sediment thickness was carried out applying «ordinary krigging» without smoothing, which thoroughly indicates possible errors in the data and problematic areas in account to a geologic interpretation.
Finally a contour line map with intervals of 20 m was created based on the calculated grid, in order to obtain a clear presentation of the results. The information available at this moment to account for bedrock depth contouring has still to be considered insufficient in some areas, so that the map only represents a preliminary version that will change with the integration of new information. Nevertheless, the new map looks very similar to the maps created by Delaware (1950) and Weston (1969), since large parts of the data used for the model
originate in these studies, but also provides valuable new information in regard of the interpretation of the bedrock depth. The map indicates a general increasing of the sediment thickness to the north, since the Caracas valley is a halfgraben (Singer, 1977), subsided on the north side through the contact with the Tacagua-El Ávila fault. The very steep gradient on this side in contrast to the south counterpart reflects the dip of the Avila fault, which is nearly vertical.
We can observe that in the area between Los Palos Grandes and the Country Club, no information of deep wells is available, and that the determined sediment thickness in this area is based on the geophysical data of Weston (1969), indicating an exceptionally high sediment thickness of 300 m in the area of Los Palos Grandes. Also, there is very important new information given by the well indicated in Santa Eduvigis, directly east of Los Palos Grandes. Thiswell has a depth of 340 m without reaching the bedrock, and confirms the presence of a local depression as indicated by the geophysical data. Another well log of unknown origin was found, which indicated a depth of 290 m, with a «conglomeratic rock» at a depth of 190 m, but this well does not reach the metamorphic bedrock of the basin. Unfortunately, this information could not be used in the model, since the given coordinates of the well are wrong. However, due to the information of this well, we can assume that its real location is probably in the area of the indicated local depression, and it confirms the magnitude of the determined bedrock depth. An inconsistency between the well logs and the geophysical data is given for the southern limit of the depression, which is located in the revised map (figure 4) more to the north than indicate an asymmetric shape with very steep gradient in the southeast. This disagrees with the geophysical data given in the area of Parque del Este as well as in the area of the airport La Carlota. In comparison with the well data, the geophysical data indicate here deeper bedrock depth, and a

lower gradient of the depression to the southeast. Due to these inconsistencies and to the fact that the geophysical data are not available, we have to assume some uncertainty of the seismic data indicated by Weston (1969). Furthermore, the area at the west of Los Palos Grandes should be reviewed very critically, since the information here is only based on the seismic data. Thus the geometry of this local depression, as indicated in figure 4, could change somewhat with integration of new information. However, the still insufficient data amount does not permit the exclusion or control of the geophysical data in the questionable areas, so
that additional studies are necessary to obtain a more detailed and reliable model of the bedrock topography in this area. Another anomaly with high sediment thickness can be observed in the area of 140 m, extended in the NW-SE direction. In this case the well and geophysical data agree very well, and the information in regard of the depth and topography of the bedrock in this area can be considered as satisfactory and reliable, although considerable differences are observed regarding the maps of Delaware (1950) and Weston (1969; figure 1) from San Bernardino towards the southwest.
Nevertheless, the information of the refraction surveys carried out by Weston in these areas, as for example in the area of La Vega, is in good agreement with the well data. In the rest of the Caracas valley the sediment thickness does not exceed 80 m, decreasing to the outer ranges. The available amount of data is insufficient to carry out a detailed model at small scale, and there are locally small data voids, but the distribution and amount of data gives a good and reliable estimate of the sedimentary thickness all over the Caracas valley.
The tectonic deformations that caused the strongly varying bedrock depth in the area of Los Palos Grandes and San Bernardino are not completely clear, but they are probably related to the Tacagua-El Ávila fault system, which is composed of NNW-SSE striking and E-W striking faults, exhibits an en echelon array. This arrangement caused the transfer of the vertical displacement on different segments in the east-west direction, and explains the higher subsidence in the discussed areas. However, this system seems to be complicated by N-S and NE-SW striking faults, forming a very complex structured zone. In order to understand the tectonic structure of this region in detail, it will be necessary to get more complete knowledge of the topography of the bedrock, especially in the area of Los Palos Grandes.
3. SOME REMARKS ON THE SEISMIC VELOCITY IN THE CARACAS VALLEY
Besides to the geologic data, this contribution provides basic geophysical parameters of the basin fill. Seismic velocities of the shallow subsurface were determined at 7 locations in the Caracas valley, based on seismic refraction surveys, using a sledgehammer as energy source. The knowledge of seismic velocities in the shallow subsurface (first 30 m), specially shear wave velocities, is of special interest for engineering purposes (BSSC-NEHRP, 2000; Covenin, 2001) and also provides basic information for future, more extensive
geophysical investigations. Due to the densely urbanized pattern of the city, areas with sufficient free space to carry out seismic refraction surveys are very rare. Thus, the selection of test sites was strongly limited and generally given by the available space and the local noise level. However, the distribution of the test sites
provides a good overview of shallow seismic velocities of the different geological units within the valley.
For recording, a 48 channel seismic recorder (Geometrics StrataView) with vertical (30 Hz) and horizontal (28 Hz)
geophones and a 10 kg sledgehammer as energy source (vertical impact on an aluminium plate for generation of Pwaves and horizontal impact on a loaded plank for S-waves) on profiles with a maximum offset of 96 m was used. Processing and analysis of the data was done with REFRA, an application for processing and interpretation of seismic refraction data.
The traveltimes of all shots of the corresponding surveying lines were then plotted together in a time distance diagram,and forward and reverse times were compared calculating the reciprocal time errors, to guarantee that picking of Pand S-wave arrivals were accurate. Then, 1D models werecalculated using the intercept-time-method (ITM; Lankston, 1990) in order to build up a start-model for the 2D forward modelling done with network raytracing. The 2D start-model was based on the 1D-models, and the model was iteratively adjusted until the calculated arrivals were in good agreement with the observed traveltimes, obtained from picking of the first arrivals. The quality of the data varies considerably with respect to the location of the surveys and the respective noise level. In some cases, the signal/noise ratio can be considered as very good but in other cases the data is strongly impaired by noise, especially at the end of the spreads. Comparing P-wave and S-wave
data, the P-wave data is generally of much better quality.
Signal enhancement by filtering was only possible in a few cases, as the noise is generally caused by low frequency surface waves. Since the signals generated with the sledgehammer are in the same frequency range, elimination of these frequencies was not possible.
Generally, 3 main geological units could be distinguished in the records based on the seismic velocities, dry alluvial sediments, saturated alluvial sediments (indicating the water level) and metamorphic rocks. A more detailed interpretation and subdivision of the unconsolidated sediments was not
possible, since they are very inhomogeneous alluvial deposits, consisting of very strongly varying, and unknown
portions of gravel, sand, silt, and/or clays and also varying particle size. This causes velocity variations within the alluvial sediments, which cannot be interpreted unambiguously, since sediments of different composition
may have a similar seismic velocity. Since S-wave velocities could be determined at two sites only, for the other sites they were estimated roughly from P-wave velocities (VP = 1,7 VS) to give an idea about the order of S-wave velocities.
For the saturated alluvial sediments, no S-wave velocity estimates were given, as the P-wave is strongly influenced by the water.
The original seismograms with markers for the first breaks, as well as the traveltime curves, and raytracing models, calculated during the model process for each of the surveys are displayed in Kantak (2001). An example for good quality data from the Country Club site is given in figure 5. The arrivals of P- and S-waves can be identified until the end of the section with good accuracy. The P-wave velocities can be derived down to 11-13 m, where saturated alluvial sediments show a velocity of 1860 m/s (figure 6). Above, P-wave velocities vary between 510 m/s for the uppermost layer up to 920 m/s. The corresponding S-wave velocities range between 290 and 570 m/s down to 11-13 m. The sites within the alluvial basin (Country Club, Parque del Este, La Carlota and Los Caobos) show P-wave velocities between 400 and 1000 m/s above the watersaturated sediments (table 2). The water table is located between 10 and 19 m in depth for the different sites. The corresponding S-wave velocities range between 250 to 400m/s (for the uppermost 1-3 m, corresponding to landfill or very loose sediments) and 350 to 600 m/s below (various types of alluvial sediments). At the sites close to the bedrock
the P-wave velocities of the uppermost parts of the metamorphic rocks range between 2200 and 2300 m/s.
The results of the seismic measurements obtained during this study were compared to the ones obtained by Weston (1969), where they covered the same area (table 2). This is the case for example at the Country Club site, where P-wave velocities of 400 - 500 m/s are reported for the uppermost 10 m, followed by a thin (5 m) saturated layer of 1500 m/s and then a thick layer with a velocity of 1700-1850 m/s, which corresponds to the saturated sediments, and was also interpreted by Weston (1969) as compact soil. The difference in seismic velocities of the uppermost strata might be


the study conducted by Weston (1969), where 12 geophones had been applied for recording distances of 100 to 300 m; furthermore, no lateral changes in seismic velocities were considered due to limitations in the analysis techniques used. Water table changes also might count for the differences in the depth of the layer with seismic velocity of about 1800 m/s. The presence of the 1.500 m/s velocity layer might correspond to an over-interpretation of the data and could be considered part of the saturated sediments (in fact it has
been interpreted as this). At the two sites in Parque del Este in this study coincide very well with the ones of Weston (1969), which indicate saturated sediments at depth of 10-12 m and 10-25 m, respectively. Above, the P-wave velocities vary between 400 and 900 m/s. Additional information concerning depths to rock and velocity values are included in the Weston (1969) report. Specifically, profiles and array of deep crosshole data (75 m) in the Los Palos Grandes area are presented there, with S-wave velocities of 180 to 230 m/s for the uppermost 5 m, 430 m/s down to 60 m and 480 m/s to the end of the drillings. The S-wave velocities for surface materials (uppermost 5-10 m) at various other sites in Cara attributed to the low resolution for the uppermost layers in cas range between 240 and 400 m/s except for San Bernardino, where 570 (?) m/s are given (Weston, 1969).
4. DISCUSSION AND CONCLUSIONS
The east-west cross-section through the Caracas valley created within the scope of this work permits the division of the Quaternary sediments into four lithological units: alluvial fan deposits, which can be subdivided in the eastern part of the valley in accordance with Singer (1977) into a proximal and a distal facies, alluvial terraces (either erosional or depositional) of the Guaire River, and floodplain deposits originated in buildups of Guaire River and its tributaries. Along Metro line 1, from east to west, lateral changes of the material characteristics in regard of their source rocks can be observed, that reflect the different materials the Avila range is composed of, and are of special interest for the correlation of the alluvial fan deposits. These characteristics could be used to determine the geometry of the different alluvial fans formed by the creeks running from the north into the valley, in order to understand the dynamics and dimensions of past debris flows for the planning of countermeasures. Due to the dense urbanization, the large amount of well data that exist in the Caracas valley (probably more than 3.500) represents a very important source of

geologic information that is largely unused. The compilation of this data in further studies is highly recommended, since it provides important information to understand the sedimentation processes and tectonic evolution of the
Caracas valley. The sediment thickness determined from available wells and geophysical information, confirms the presence of a local depression in the area of Los Palos Grandes with exceptionally high values of over 300 m as indicated by Weston (1969), with the deepest depression in bedrock depth in the area of Santa Eduvigis of at least 340 m (figure 4).
Regarding the shape and extension of this local depression, for its broader shape it seems to be controlled by NW - SE striking tectonic features rather than east-west striking features, as suggested by previous compilations (figures 1 and 4). This feature seems to be confirmed by recent seismic and gravimetric investigations done in the region (Sánchez et al., 2002). The knowledge of the detailed geometry of the bedrock surface is considered crucial for the seismic response of the structures as evidenced by the damage distribution during the 1967 Caracas earthquake (FUNVISIS, 1978).
The presence of a locally greater depth to rock in the area of San Bernardino can be confirmed with the geophysical and well data analysed in this study, indicating a depth of 140 m and, an extension in NNW-SSE direction of this depression. In the remaining areas of the Caracas valley, the bedrock depth does not exceed 80 m and is in good agreement with the halfgraben structure, which implies ageneral decrease of the depth of the sediments to the outer ranges with steeper gradients towards the north, close to the Tacagua - El Avila fault. The data available in a Mapinfo GIS format constitute an important base for further investigation within the scope of the seismic microzoning studies done by FUNVISIS in the Caracas metropolitan area. Seismic P- and S-wave velocities have been derived for the uppermost 10 to 20 m at several sites. Saturated alluvial
sediments follow P-values of 400 - 900 m/s, corresponding to alluvial sediments down to 10 - 19 m in depth. The results are in good agreement with previous investigations done by Weston (1969), which were focused on the deeper structure of the sedimentary basin. S-wave velocities in the range of 240 to 600 m/s for the alluvial sediments down to 10 - 19 m coincide well with the S-wave velocities obtained in borehole measurements in the Los Palos Grandes area (FUNVISIS, 1978), which indicate velocities of 180 to 230 m/s for the upper 5 m and below 430 m/s down to 60 m in depth, followed by a layer with 480 m/s down to 75 in depth. From results of microtremor measurements, Enomoto et al. (2001) estimate the average S-wave velocity of the alluvial sediments to 680 m/s (a value which seems reasonable, considering that already in the upper 15 m velocities of 240 - 600 m/s are reached). Semblat et al. (2002) use an estimate of 450 m/s as the S-wave velocity of the alluvial layer for a numerical analysis of the site effects. The accurate determination of the S-wave velocity of the basin fill, together with the detailed image of the geometry of the basin, are crucial parameters for the estimation of the site response to be expected in Caracas valley regarding the existing earthquake scenarios.
ACKNOWLEDGEMENTS
This study has been possible due to the data provided by the Ministry of Environment, hydrology branch (MARNR)
and HIDROCAPITAL. We thank INPARQUES and Caracas Country Club for access to the parks (seismic measurements). We thank V. Rocabado for participation in the seismic measurements. The reviews of A. Singer and V.
Murphy contributed to the improvement of this paper, many thanks. Contribution presented at the III Coloquio sobre Microzonificación Sísmica in Caracas in 2002.
REFERENCES
1. ABEKI, N., SEO, K., MATSUDA, I., ENOMOTO, T., WATANABE, D., SCHMITZ, M., RENDÓN, H. AND SÁNCHEZ, A., (1998). Microtremor observations in Caracas city, Venezuela. In: Irikura et al. (eds.), The Effects of Surface Geology on Seismic Motion, Balkema, Rotterdam, 619-624. [ Links ]
2. ALTEZ, R. (1998). Cronometrización extemporánea: Los sismos del 26 de marzo de 1812 en Caracas y Mérida.
Primeras Jornadas de Sismicidad Histórica en Venezuela. Revista Geográfica Venezolana U.L.A., 39, 297 – 326.
3. AUDEMARD, F. A., MACHETTE, M., COX, J., HART, R. AND HALLER, K., (2000). Map and database of Quaternary
faults in Venezuela and its offshore regions. U.S. Geological Survey Open-File-Report 00-18, 79 p. + map.
4. BELLIZIA, A. AND DENGO, G., (1990). The Caribbean mountain system, northern South America; a summary. In: Dengo, G. and Case, J.E. (eds.), The geology of North America, Vol. H, The Caribbean Region. Geol. Soc. Am., Boulder, Colorado, 167-175. [ Links ]
5. BELTRÁN, C. (compilador), (1993). Mapa neotectónico de Venezuela, escala 1:2.000.000, (FUNVISIS). [ Links ]
BSSC-NEHRP, (2000). NEHRP Recommended Provisions for seismic regulations for new buildings and other
structures. Part 1: Provisions (FEMA 368) ; Part 2: Commentary (FEMA 369). Prepared by the Building
Seismic Savety Council for the Federal Emergency Management Agency, Washington DC, (www.bssconline.org/NEHRP2000/).
6. COVENIN, (2001). COVENIN 1756-98 (Rev. 2001) - «Edificaciones Sismorresistentes», Ministerio de Desarrollo Urbano – FUNVISIS, FONDONORMA, Caracas. Delaware (Seismographic Service Corporation of Delaware/
Tulsa, EEUU), (1950). Informe sobre investigaciones de aguas subterráneas del valle de Caracas. Unpublished,
Instituto Nacional de Obras Sanitarias (INOS), (Ministerio de Obras Públicas), 189 p.
7. ENOMOTO, T., SCHMITZ, M., MATSUDA, I., ABEKI, N., MASAKI, K., NAVARRO, M., ROCABADO, V. AND SANCHEZ, A., (2001). Fundamental study on seismic risk assessment using soil dynamic characteristics in Caracas, Venezuela. International Workshop «Study on Countermeasures for Earthquake Disaster in Caracas (1999 – 2001), Caracas, Venezuela, August 24 - August 25, 2000, Série Técnica, FUNVISIS, Caracas, 40-45. [ Links ]
8. FUNVISIS, (1978). Segunda Fase del Estudio del Sismo ocurrido en Caracas el 29 de Julio de 1967. Ministerio
de Obras Públicas, Comisión Presidencial para el Estudio del Sismo, FUNVISIS, Caracas, Venezuela, Volumen A, 517 p.
9. GRASES, J., (1990). Terremotos destructores del Caribe 1502- 1990. 1ra ed., Orcyt-Unesco, Montevideo, Uruguay, 132 p. [ Links ]
10. KANTAK, P., (2001). Sediment thickness, an east-west cross section, shallow seismic velocities, and microtremor measurements in the Caracas valley. Graduate thesis, Universität Bonn (Germany) / FUNVISIS, Caracas, 268 pp (published on CD in GEOS, 35 (2002), UCV, Caracas). [ Links ]
11. LANKSTON, R.W., (1990). High-resolution refraction seismic data acquisition and interpretation. In: S.H. Ward (Ed.), Geotechnical and Environmental Geophysics, Investigations in Geophysics No. 5, SEG, (Tulsa,
Oklahoma), 45-73.
12. MOLINA, A., GRANADO, C., MEBARKI, A. Y SÁNCHEZ, J., (2002). Estudio de amenaza sísmica de Venezuela con fines de zonificación. . III Coloquio sobre Microzonificación Sísmica, Caracas, 15 al 18 de Julio 2002, Memorias, Serie Técnica No. 1-2002, FUNVISIS, (Caracas), 68- 70. [ Links ]
13. PAPAGEORGIOU, A.S. AND KIM, J., (1991). Study of the propagation and amplification of seismic waves in
Caracas valley with reference to the 29 July 1967 earthquake: SH waves. Bull. Seis. Soc. Am., 81, 2214-
2233.
14. ROCABADO, V., SCHMITZ, M., MALAVÉ, G. Y ENOMOTO, T., (2001). Períodos fundamentales y amplificación del suelo de la ciudad de Caracas utilizando la técnica de Nakamura. International Workshop «Study on Countermeasures for Earthquake Disaster in Caracas (1999 – 2001)», Caracas, Venezuela, August 24 - August
25, 2000, Série Técnica, FUNVISIS, (Caracas), 130-139.
15. SÁNCHEZ, J., SCHMITZ, M., CANO, V., (2002). Mediciones sísmicas profundas en Caracas para la determinación del espesor de sedimentos y velocidades sísmicas como aporte para el estudio de Microzonificación Sísmica. III Coloquio sobre Microzonificación Sísmica, Caracas, 15 al 18 de Julio 2002, Memorias, Serie Técnica No. 1- 2002, FUNVISIS, (Caracas), 119-124. [ Links ]
16. SEED, H.B., IDRISS, I.M. AND DEZFULIAN, H., (1970). Relationships between soil conditions and building
damage in the Caracas earthquake of July 29, 1967. EERC-Report 70-2, (Berkeley, California), 40 pp.
17. SEMBLAT, J.F., DUVAL, A.M. AND DANGLA, P., (2002). Seismic site effects in a deep alluvial basin: numerical analysis by the boundary element method. Computers and Geotechnics, 29, 573-585. [ Links ]
18. SINGER, A., (1977). Tectónica reciente, morfogénesis sísmica y riesgo geológico en el graben de Caracas. Memorias Quinto Congreso Venezolano de Geología, IV, 123-170. [ Links ]
19. SUÁREZ, G., AND NÁBELEK, J., (1990). The 1967 Caracas earthquake: Fault geometry, direction of rupture
propagation, and seismotectonic implications. J. Geophys. Res., 95, 17459-17474.
20. URBANI, F. Y OSTOS, M., (1989). El complejo Avila, Cordillera de la Costa, Venezuela. GEOS, 29, 205-215. [ Links ]
21. WEBER, J.C., DIXON, T.H., DEMETS, C., AMBEH, W.B., JANSMA, P., MATTIOLI, G., SALEH, J., SELLA, G., BILHAM, R. AND PEREZ, O., (2001). GPS estimate of relative plate motion between the Caribbean and South American plates, and geologic implications for Trinidad and Venezuela. Geology, 29, 75-78. [ Links ]
22. WESTON (Weston Geophysical Engineers International INC.), (1969). Investigaciones sísmicas en el valle de
Caracas y en el Litoral Central (bajo la planificación y supervisión de la Comisión Presidencial para el Estudio
del Sismo), Caracas, 22 pp.
