




 Inglês (pdf)
 Artigo em XML
 Referências do artigo

 Tradução automática
 Enviar este artigo por email
 Citado por SciELO
 Similares em
SciELO

 Permalink


I. INTRODUCTION
Induction motors play a crucial role in the operation of industrial machinery, and their reliable operation is vital for productivity and safety. Faults can lead to downtime, increased maintenance costs, and loss of efficiency 1. The industry has adopted motor fault detection as a means to ensure the consistent and reliable operation of modern industrial systems. Motors are subjected to various conditions and environments 2. Stator-related problems account for 38% of all faults in induction motors 3.
When an inter-turn insulation fault occurs, some turns in the stator winding short-circuit. Failure to detect and rectify this fault promptly accelerates its progression to more severe faults, such as inter-coil or inter-phase short circuits 4, culminating in phase-to-ground faults that can result in permanent damage to the induction motor 5. Recognized challenges include real-time monitoring and model interpretability, emphasizing the need for practical solutions. The severe impact of motor failures on productivity and safety underscores the urgency for early fault detection systems.
Over 40 years of research have demonstrated that many types of faults can be detected in motor sensor data before they cause a breakdown; therefore, there has been significant interest in leveraging this fact to reduce the losses caused by such failures 6. More than 40 years of research confirm that it is possible to detect these faults through the analysis of sensor data before a catastrophic failure occurs, thereby reducing associated economic losses 7.
In this context, the startup transient emerges as a critical phase where thermal and magnetic stress can reveal insulation weaknesses that are not visible under steady-state conditions. Time-frequency analysis tools, such as the Discrete Wavelet Transform (DWT) and the Wigner-Ville Transform (WVD), have emerged as promising alternatives. However, the need arises to determine which of these techniques offers greater robustness in the face of the non-stationary nature of the startup.
To address this problem, the present research poses the following research questions:
Is the Discrete Wavelet Transform more effective than the Wigner-Ville Transform for discriminating incipient insulation fault levels during the startup transient?
Which statistical metrics derived from these transformations possess greater separability power to characterize the motor’s condition?
To answer these questions, the following specific objectives are proposed:
Model and simulate the behavior of induction motors under healthy operating conditions and with incipient insulation faults (200 kΩ and 20 kΩ).
Extract a set of statistical features (energy, entropy, RMS, and kurtosis) from the representations generated by the DWT and the WVD.
Evaluate and compare the performance of both techniques using a Support Vector Machine (SVM) classifier and separability metrics such as the Fisher Score.
Finally, the success criterion for the comparative diagnosis is defined by obtaining a classification model with an accuracy greater than 70%, an area under the curve (AUC) value greater than 0.80, and the identification of at least three metrics with statistical significance (p < 0.1) that allow clear differentiation between the analyzed classes.
II. THEORETICAL BACKGROUND
A. Discrete Wavelet Transform (DWT)
The wavelet transform is a tool applied to analysis in the time and frequency domains. Ingrid Daubechies, a leading figure in wavelet research, revolutionized the field by creating compactly supported orthonormal wavelets, which enabled the development of discrete wavelet analysis. Members of this family are identified by the nomenclature dbN, where db corresponds to the researcher’s surname and N indicates the order of the wavelet 8.
The analysis of the motor’s transient current is performed in the time-scale domain using the Discrete Wavelet Transform (DWT). The DWT is based on Multiresolution Analysis (MRA), decomposing the signal x[n] into detail coefficients (D j ) and approximation coefficients (A j ) through a dyadic filter bank according to Mallat’s pioneering algorithm 9. Formally, the coefficients at level j are obtained through discrete convolution and downsampling operations, using a low-pass filter h[n] for the approximation and a high-pass filter g[n] for the detail:
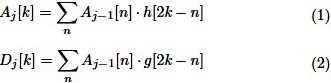
where A 0[n] = x[n] is the input signal. The justification for the DWT lies in its ability to provide a time-frequency representation of the signal, making it optimal for the analysis of transients and non-stationary signals, which are characteristic of insulation faults in electrical machines.
For this study, the Daubechies wavelet of order 10 (db10) is selected, and a decomposition level of 8 (J = 8). The db10 wavelet belongs to the family of orthogonal compactly supported wavelets. The selection of N = 10 is supported by two fundamental properties. First, its compact support: the filter support is finite (length 2N = 20 coefficients), which guarantees computational efficiency and good temporal localization for the detection of impulsive events. Second, its vanishing moments (N = 10): db10 has ten vanishing moments, meaning it is orthogonal to polynomials up to degree 9. This property is crucial, as it ensures that the detail coefficients (D j ) do not contain information about smooth low-frequency variations (trend), but instead concentrate on the energy of irregularities, peaks, or singularities in the signal 10.
The decomposition level J = 8 ensures adequate frequency resolution to isolate the bands where the fault energy manifests. With f s = 5000 Hz, the decomposition generates 8 detail bands, where D 1 corresponds to the highest frequency range (1250-2500 Hz) and D 8 represents the very low-frequency band (9.77-19.53 Hz).
B. Wigner-Ville Transform (WVD)
The Wigner-Ville Transform is the principal member of the class of bilinear (or quadratic) time-frequency distributions. Its main strength is providing optimal resolution simultaneously in the time (t) and frequency (f) domains. The WVD is based on the notion of an instantaneous autocorrelation function of the signal. For a signal s(t), the WVD is generally defined over its analytic signal z(t) to avoid interference caused by negative frequency components 11.

where W z (t, f) is the Wigner-Ville distribution, τ is the integration variable representing the time interval over which the instantaneous autocorrelation is calculated, and e −j2πfτ is the complex exponential factor that converts information from the delay domain (τ) to the frequency domain (f), acting as a band-pass filter for each instant t.
III. METHODOLOGY
This study tests the hypothesis that the Discrete Wavelet Transform (DWT) is more effective than the Wigner-Ville Transform (WVD) for diagnosing stator insulation faults during motor startup. Using numerical simulation, it ensures controlled conditions, safe replication of incipient faults, and generates a labeled dataset for a systematic comparison of the two techniques.
A. Simulation of Motors and Fault Modeling
A simulation environment was implemented in MATLAB/Simulink to replicate the dynamic behavior of 20 squirrel-cage induction motors with rated power distributed in the range of 10 to 4000 HP. This selection ensures industrial representativeness by covering prototypical applications, including pumping, ventilation, and compression systems predominant in manufacturing and continuous process sectors (see Fig. 1).
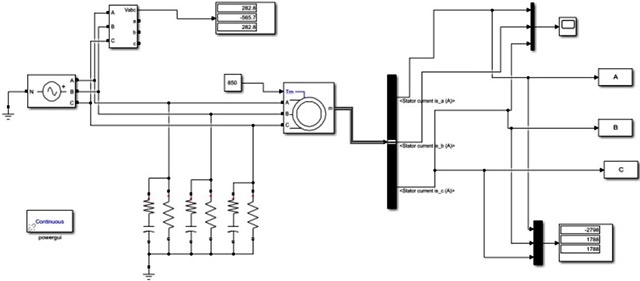
The characteristics (rated power, voltage, resistances, and inductances) corresponding to 20 induction motors were parameterized, ensuring an accurate representation of the three-phase system across various industrial power ranges. The insulation fault was simulated by connecting a resistive-capacitive (RC) circuit between phase and ground of each winding 1. The resistance of this circuit was adjusted to 200 kΩ and 20 kΩ to represent incipient and critical faults, respectively. The phase-to-ground capacitances were set between 1.5 nF and 21 nF 12.
B. Signal Acquisition and Structuring
A simulated cohort of 20 three-phase squirrel-cage induction motors with rated power from 10 to 4000 HP ensured industrial representativeness for applications such as pumping and ventilation. Data generation followed a factorial design combining three insulation states (healthy, 200 kΩ fault, 20 kΩ fault) and two load regimes (no-load, rated load) across each motor’s three phases, yielding a total of 360 three-phase signals (120 healthy, 240 faulty). Acquisition focused on the startup transient, capturing a 5-second window at 5000 Hz to adequately resolve non-stationary components. All signals were exported to MATLAB/Simulink, where time-frequency analysis algorithms were applied for the systematic extraction of diagnostic descriptors.
C. Feature Extraction using DWT and WVD
The processing of the acquired signals employed two feature extraction approaches to transform information from the time domain into a discriminative attribute space. A Daubechies 10 (db10) wavelet with eight decomposition levels was applied, leveraging its compact support and ten vanishing moments for precise transient detection and low-frequency trend filtering 9,10. The decomposition level J = 8 was determined considering the sampling frequency (f s = 5000 Hz) and the spectral range of interest for insulation faults (approximately 9.77-1250 Hz). From the detail coefficients obtained at each level D j (with j = 1, 2, . . . , 8) and for each of the three phases, five statistical metrics were systematically calculated.
Energy:

where D j [k] is the k-th detail coefficient at level j and N j is the number of coefficients at that level.
Maximum Value (MAX j ) and Minimum Value (MIN j ):

with units expressed in amperes (A).
Shannon Entropy:

Kurtosis:

where D̄ j and σ Dj are the mean and standard deviation of D j , respectively.
Root Mean Square (RMS):

with units expressed in amperes (A).
The Daubechies 10 wavelet transform was employed to characterize the impulsivity of insulation faults. Concurrently, the Wigner-Ville Distribution (WVD), a quadratic time-frequency representation offering optimal joint resolution, was applied 10. Following the standard formulation to mitigate cross-term interference, the WVD was computed on the analytic signal of each phase 10. From the resulting energy distribution, ten spectral attributes were extracted, including frequency moments and power levels at the three most significant peaks 10.
From the processing via WVD, ten metrics per phase were systematically extracted and organized into two fundamental categories. First, four central distribution statistics of the marginal spectral density were calculated, including the mean frequency (f̄ ):

as the first spectral moment, and the spectral standard deviation (σ f ), which quantifies spectral dispersion:

both expressed in hertz (Hz).
The analysis quantified the spectral envelope using bounding frequencies (f min, f max), and the three principal peaks characterized by their center frequency (f k ) and normalized dB magnitude (p k ). This compact parameterization captures both global spectral extent and fault-indicative harmonic features from the startup transient.

This normalization allows comparison between signals with different absolute energy.
D. Statistical Analysis and Attribute Selection
A two-stage pipeline was implemented for feature selection. First, univariate separability between Healthy (S) and Fault (F) classes was assessed using the Fisher Score for each feature 13. For a given feature x, its Fisher Score S f is calculated as:

where µ s , µ f and σ s 2, σ f 2 are the means and variances of x for the Healthy and Fault classes, respectively.
A value of S f close to zero indicates total overlap between class distributions, while higher values indicate greater separability. An empirical threshold of S f > 0.01 was established to consider a feature as potentially discriminative, thus filtering out attributes with insignificant separation power.
In the second stage, one-way ANOVA (MATLAB’s anova1 function) was applied for each feature, testing the null hypothesis of equal means among the three classes: Healthy, 200 kΩ Fault, and 20 kΩ Fault. Given the exploratory nature of the study and the need to detect subtle effects associated with incipient faults (200 kΩ), a significance level of α = 0.1 was adopted, less strict than the conventional α = 0.05 14. To control the increase in Type I error rate due to multiple comparisons, the Bonferroni correction was applied. The original p-value obtained for each feature was adjusted according to:

where m is the total number of tested features. Only features with p adjusted < 0.1 were considered statistically significant for discriminating between at least two of the analyzed operational states.
E. Supervised Classification using Support Vector Machines (SVM)
The automatic diagnosis phase was implemented using a Support Vector Machine (SVM). The complete pipeline consisted of the following stages.
Preprocessing: All extracted features (both from DWT and WVD) were standardized using Z-score normalization:

where µ and σ represent the mean and standard deviation of each feature in the training set. This ensures that all variables contribute equally to the model, regardless of their original scale 15. Class imbalance (120 healthy vs. 240 fault samples, 1:2 ratio) was addressed. The SVM with RBF kernel performed acceptably without balancing techniques, thanks to the features’ inherent separability, so the original data distribution was preserved.
Feature Selection: To reduce dimensionality and avoid the curse of dimensionality, a filter based on the Fisher Score was applied. Only features with a score S f > 0.01 were retained, a threshold that guarantees minimum significant separability between classes 16. Principal Component Analysis (PCA) was not used to preserve the direct physical interpretability of the wavelet and WVD metrics.
Validation Protocol: A 5-fold cross-validation strategy was implemented on the complete dataset. The process did not include a fixed traditional training/test split; instead, each fold simultaneously served for training and validation. The averages of accuracy, F1-score, and AUC over the five folds are reported.
SVM Model Configuration: A Radial Basis Function (RBF) kernel with MATLAB’s default parameters was used, without additional hyperparameter optimization. The model was evaluated via 5-fold cross-validation on the complete dataset.
F. Considerations on Validity and Scope of the Study
While numerical simulation provides controlled conditions for this proof-of-concept, the study’s external validity is limited by model idealizations. Key industrial factors such as electromagnetic noise, dynamic loads, and environmental aging were not replicated. Therefore, while the results demonstrate the technical superiority of DWT over WVD, validation in real-world environments with actual noise and variability is required for definitive implementation.
IV. RESULTS
Regarding the analysis of current signals using the Daubechies 10 Wavelet Transform with a decomposition level of 8, a total of 360 signals were processed: 120 corresponding to the motor’s healthy state and 240 associated with low insulation fault conditions. Table 1 details the technical specifications of the analyzed motors, classified by their nominal voltage levels and power. The external validity of this study is supported by a heterogeneous sample of 20 induction motors, covering a wide operational spectrum from low-power (10 HP) to high-power (4000 HP) applications across different voltage levels (Table 1).
Table 1 Technical specifications of the simulated induction motor population.
| Voltage (V) | Frequency (Hz) | Specific Motor Powers (HP) | Quantity |
|---|---|---|---|
| 220 | 60 | 10, 20 | 2 |
| 480 | 60 | 100, 150, 175, 200, 215, 300, 355, 400, 500, 600 | 10 |
| 4160 | 60 | 175, 830, 900, 1000, 1250, 1630, 2000, 4000 | 8 |
| Totals | 20 | ||
Fault patterns thus reflect insulation degradation independent of motor design, enabling robust SVM classification across operational variations. Although Fig. 2 and Fig. 3 reveals subtle energy differences between states in a 200 HP motor, conclusive detection requires statistical aggregation beyond individual signal inspection.
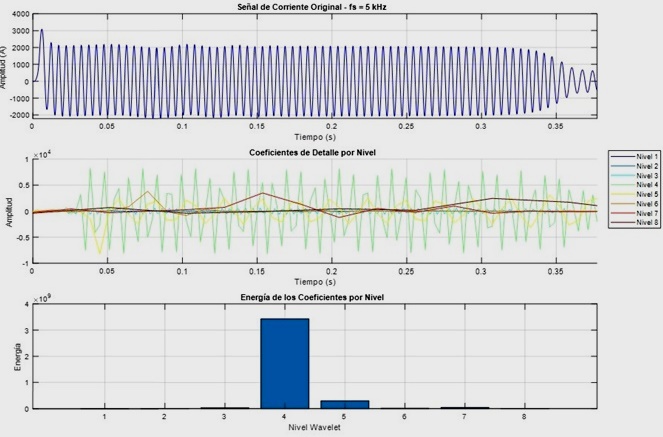
Fig. 2 Energy spectrum obtained from the wavelet transform of a 200Hp motor. Healthy state. The figure was generated in MATLAB 2019.
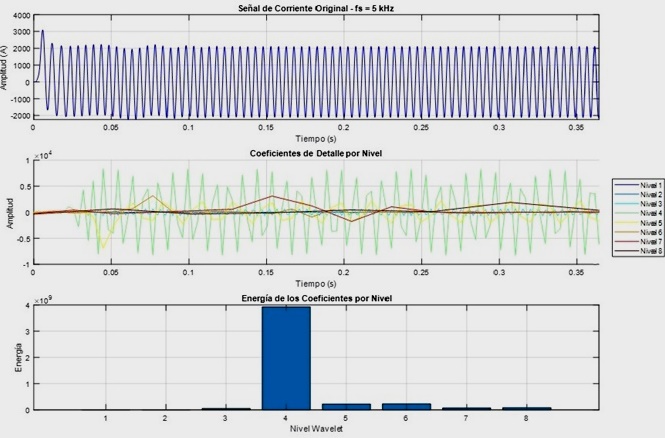
Fig. 3 Energy spectrum obtained from the wavelet transform of a 200Hp motor. Faulted state, unloaded, 200 KW. The figure was generated in MATLAB 2019.
A statistical analysis was performed in MATLAB to determine the average energy per condition from the generated database, followed by the calculation of the percentage variation between scenarios. This global comparison reveals overall trends in signal behavior. Fig. 4 illustrates this percentage variation, highlighting energy changes due to faults. The most significant reductions in energy occur in levels D 1 (−17.1%), D 2 (−20.2%), and notably D 7 (−24.1%), marking them as sensitive indicators for early anomaly detection. The pronounced effect on D 7 suggests that its high-frequency components are highly representative of insulation degradation. In contrast, level D 5 shows a moderate increase (+13.4%), potentially linked to fault-induced spectral redistribution. The remaining levels (D 3, D 4, D 6, D 8) exhibit smaller decreases or negligible variations, indicating their lower diagnostic relevance.
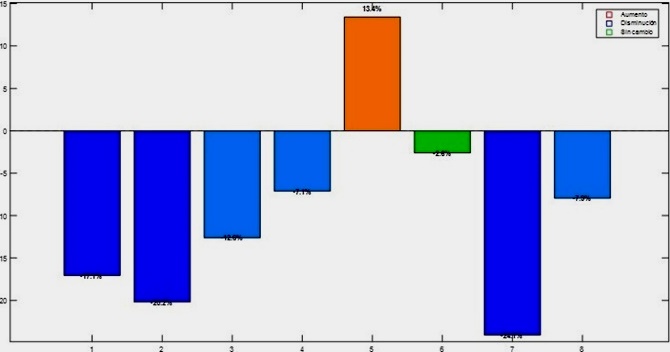
Fig. 4 Percentage variation in the energy levels of the wavelet transform from the 360 sampled signals. The figure was generated in MATLAB 2019.
Figure 5 compares statistical indicators across wavelet decomposition levels, revealing that levels D 1, D 6, and D 8 exhibit the most significant variations, indicating high sensitivity to low-severity insulation faults during motor startup. Specific changes include pronounced maxima perturbations in D 1 (−19.2%), D 6 (+22.4%), and D 8 (+49.8%) (Fig. 5a), notable minima shifts in D 2 (−17.6%) and D 5 (+41.5%) (Fig. 5b), moderate entropy variations in D 6 (−8.1%) and D 7 (+5.5%) (Fig. 5c), and energy redistributions in D 5 (+9.2% RMS) and D 7 (−10.5% RMS) (Fig. 5d). These findings confirm the wavelet transform’s efficacy for early fault detection.
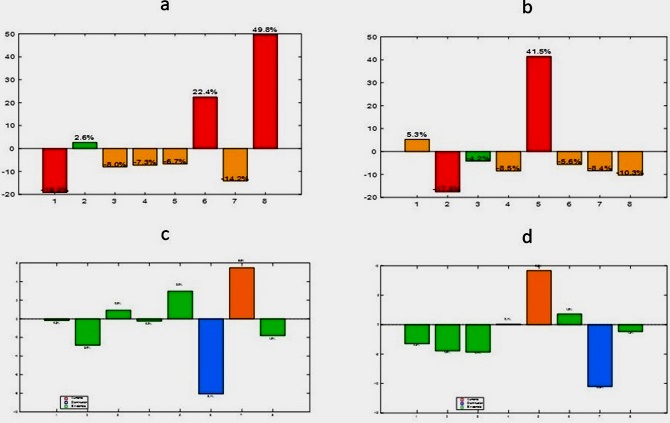
Fig. 5 Statistical indicators, per wavelet decomposition level; MAX (a); MIN (b); Entropy (c); RMS (d). The figure was generated in MATLAB 2019.
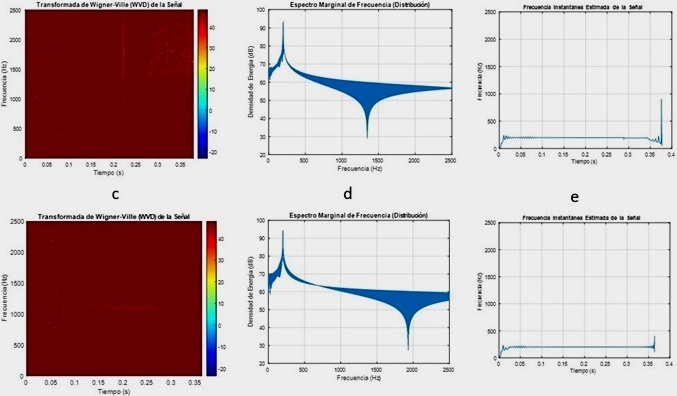
The same dataset was analyzed using the Wigner-Ville Transform (WVD). Figure 6 contrasts a healthy, unloaded 200 HP motor (top row) with its 200 kΩ fault counterpart (bottom row) via time-frequency distributions, marginal spectra, and instantaneous frequency profiles, clearly highlighting spectral and dynamic differences attributable to insulation degradation.
For the analysis of the Wigner-Ville Transform (WVD), the percentage variation of six key spectral metrics was calculated in MATLAB ( Figure 7), based on the database built from the obtained signal records. The analyzed metrics were: mean frequency, standard deviation, minimum frequency, maximum frequency, and the values of the two main peaks (Peak1 and Peak2). This processing allowed for a precise evaluation of the differences between operating conditions (healthy state, 200 kΩ low insulation fault, and 20 kΩ fault), providing a detailed characterization of the spectral behavior under different fault scenarios.
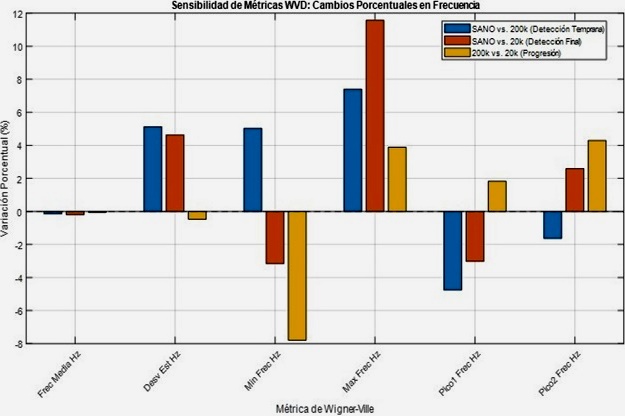
Fig. 7 Percentage variation of six spectral metrics from the Wigner-Ville Transform (WVD). The figure was generated in MATLAB 2019.
Frequency sensitivity analysis via the Wigner-Ville Transform (WVD) applied to 360 records-evenly distributed among healthy, low-severity (200 kΩ), and severe (20 kΩ) insulation fault conditions-revealed pronounced metric variations. Mean sensitivity decreased markedly from 158.18 (healthy) to 62.716 (200 kΩ) and further to −1008.5 (20 kΩ), indicating progressive spectral sensitivity loss. Percentage variations were substantial: 771.31% between healthy and moderate fault, 164.18% between healthy and severe fault, and 160.94% between fault severities. These results confirm the high sensitivity of WVD to insulation degradation, particularly during startup transients, enabling clear discrimination even at incipient fault stages.
For a systematic comparison, two MATLAB routines were developed for statistical and supervised processing of features from the WVD and Daubechies 10 wavelet transform. Each routine computed inter-class percentage variation, Fisher Score, ANOVA results (p-value and F-statistic), and the performance of an SVM classifier evaluated through cross-validation (5 folds). Results are summarized in Table 2, which synthesizes the discriminative capacity of each method.
Table 2 Final comparison between Wavelet Daubechies 10 and Wigner-Ville Transform (WVD).
| Criterion | Wavelet Daubechies 10 | Wigner-Ville (WVD) |
|---|---|---|
| Spectral Sensitivity | High in multiple metrics (up to +354%) | Low to moderate (max. ±9.48%) |
| Separability (Fisher Score) | Moderate to high (up to 0.0170) | Low (max. 0.0072) |
| Statistical Significance | Some metrics with p < 0.1 (e.g., Entropy D 6) | No metrics with p < 0.1 |
| SVM Classification Accuracy | 74.44% | 67.78% |
| SVM Classification - F1-score | 0.8322 | 0.7943 |
| SVM Classification - AUC | 0.8072 | 0.6193 |
| Multiscale Robustness | Yes (D 1-D 8 per metric) | No (global analysis) |
| Interpretability | High, by levels and specific metrics | Low, requires time-frequency expertise |
| Applicability in AI | Ideal for supervised classification | Limited by low discrimination |
The SVM model yielded the following performance (mean ± standard deviation): Accuracy = 74.44 ± 3.2%, F1-score = 0.832 ± 0.028, and AUC = 0.807 ± 0.032. Confidence intervals (95%) were derived assuming normally distributed metrics. This comparative framework provides objective criteria for selecting the most suitable spectral technique in motor insulation fault diagnosis.
The obtained results demonstrate that the Daubechies 10 Wavelet transform offers greater spectral sensitivity, better statistical separability, and superior performance in automatic classification compared to the Wigner-Ville transform. The metrics extracted by the Wavelet transform, especially kurtosis, entropy, and RMS at high levels (D 4-D 8), show significant percentage variations between classes and Fisher Score values that exceed the useful discrimination threshold (> 0.01). Furthermore, the SVM model trained with Wavelet features achieves an AUC of 0.8072, indicating a robust capacity to distinguish between healthy and faulty states.
In contrast, the Wigner-Ville metrics show low sensitivity and scarce statistical significance, which limits their direct applicability in automatic diagnostic systems. Therefore, it is concluded that the Daubechies 10 Wavelet transform is more suitable for the diagnosis of insulation faults in electric motors, both due to its multiscale segmentation capability and its compatibility with artificial intelligence models.
CONCLUSIONS
The study demonstrates that the Discrete Wavelet Transform (DWT) with Daubechies 10 constitutes a significantly more effective tool than the Wigner-Ville Transform (WVD) for the early detection of low insulation faults in induction motors during the starting transient. This superiority is confirmed by the SVM classification results, where the DWT achieved 74.44% accuracy compared to 67.78% obtained by the WVD, thereby validating the stated research hypothesis.
In terms of spectral sensitivity, the wavelet technique exhibited a notably superior discriminative capacity, with percentage variations of up to +354% in specific metrics, while the WVD showed maximum variations of only ±9.48%. Particularly, levels D 1, D 6, and D 8 of the wavelet decomposition emerged as the most sensitive indicators for detecting insulation anomalies, registering significant changes in maximum values (D 8: +49.8%) and energy (D 7: −24.1%). The technique demonstrated effectiveness across different fault severity levels (20 kΩ and 200 kΩ), broadening its applicability to various operational scenarios.

