Johana Katerine Loaiza, Jesús E. Larrahondo
Fondo Latinoamericano para Arroz de Riego (FLAR). Colombia-Palmira. Universidad Santiago de Cali y Universidad del Valle, Colombia-Cali.
RESUMEN. La espectroscopia de infrarrojo cercano NIRS (por sus siglas en inglés) se emplea para el control de calidad de los alimentos. La determinación de amilosa en el arroz es un carácter heredable que correlaciona con la calidad del grano, importante en los programas de fitomejormaiento de arroz. El presente trabajo, establece la viabilidad de evaluar el contenido de amilosa en el arroz con la técnica NIRS. Inicialmente, se determinó entre arroz paddy o integral, cuál es el más apropiado para evaluar amilosa empleando NIRS. Se tomaron espectros a las 540 materiales de arroz procedentes del germoplasma del Fondo Latinoamericano para Arroz de Riego FLAR, y posteriormente se hizo análisis de componentes principales y análisis de regresión múltiple en cada tipo de arroz. El arroz integral fue el que obtuvo mejores resultados estadísticos. En el desarrollo de la calibración se empleó como referencia otra calibración en NIRS basada en harina de arroz con un R2=0.9 de calibración y R2= 0.78 de validación, y se empleó Winisi para desarrollar la quimiometría. Se utilizó mínimos cuadrados parciales MPLS y una matemática de 2,1,1,2; longitud de onda de1100-2492,2, lo que arrojó un R2≥0.68 de validación externa, aceptable para caracterizar las generaciones tempranas, con aproximadamente el 83% de aciertos. Los programas de fitomejoramiento del FLAR evalúan 15.000 materiales en el año en las generaciones tempranas, lo que significa US$ 3.600 dólares y 45 días menos que evaluar con la calibración de harina de arroz, siendo la que actualmente se emplea en el FLAR.
Palabras clave: Amilosa, arroz integral, calibración, NIRS.
SUMMARY. Evaluation of rice amylose content by near infrared Spectroscopy. The determination of amilosa in the rice is an inheritable character that it correlates with the quality of the grain, importantly breeder rice. The present work, it establishes the viability of evaluating the content of amilosa in the rice with the technology NIRS. Initially, paddy or integral decided between rice, which is most adapted to evaluate amilosa using NIRS. Spectra took to 540 materials of rice of the germ plasms banks of the Latin American Found for Irrigated Rice. FLAR, and later there was done analysis of principal components and analysis of multiple regression in every type of rice. The brown rice was the one that most better statistical results. In the development of the calibration another calibration used as reference in NIRS based on flour of rice with a R2 = 0.9 of calibration and R2 = 0.78 of validation, and Winisi was used to develop the chemometrie. There was in use square minimums partial MPLS and a mathematics of 2,1,1,2; wavelength de1100-2492,2, which a R2 = 0.68 of external, acceptable validation to characterize the early generations, with approximately 83 % of successes. The programs breeding of the FLAR evaluate 15.000 materials in the year in the early generations, which means US$ 3.600 dollars and 45 days less that to evaluate with the calibration of flour of rice, being the one that nowadays is used in the FLAR.
]]> Key words: Amylose, brown rice, calibrations, NIRS.
Recibido: 17-05-2016 Aceptado: 18-11-2016
INTRODUCCIÓN
El arroz, el trigo y el maíz son los tres cereales de mayor importancia en el mundo, suscitando una alta influencia en la nutrición humana y en la seguridad alimentaria (1). Un aspecto importante en el arroz son las características culinarias las cuales están relacionadas con la estructura química del almidón (2), este polímero está compuesto por dos moléculas, una es la amilosa y la segunda la amilopectina (3), el mayor o menor contenido de amilosa en el grano determina la calidad en cuanto a su cohesividad, textura y brillo del arroz cocido (4).En general, se puede considerar que el contenido de amilosa relaciona varias características de la calidad culinaria del arroz.
Existen varias métodologías utilizadas para la determinación del contenido de amilosa, una es el método colorimétrico registrado por la Asociación Americana de Química de Cereales AACC (5),el cual ha sido considerado de referencia para determinar el contenido de amilosa en programas de mejoramiento de arroz (6). El NIRS,es un instrumento usado en la determinación del almidón de arroz (6 y 7). Para evaluar el contenido de amilosa empleando el NIRS, se requiere realizar una calibración utilizando la quimiometría como herramienta principal, que permite obtener un modelo matemático ideal para predecir el contenido de amilosa en el arroz. En la literatura se reportan diferentes calibraciones para determinar el contenido de amilosa de forma rápida y con poca cantidad de muestra, favoreciendo el proceso de selección genética en los programas de mejoramiento de arroz (3, 8 y 9).Asimismo, se reportan trabajos de caracterización de amilosa utilizando calibraciones obtenidas en el NIRS con muestras de arroz integral (10 y 11).
]]> La técnica NIRS para evaluar el contenido de amilosa, es la principal metodología empleada en el Fondo Latinoamericano para Arroz de Riego FLAR y en el Centro Internacional de Agricultura Tropical CIAT, esta metodología es utilizada con muestra de harina de arroz. La preparación de la harina, consiste en secar, descascarar, pulir y pulverizar el arroz, y luego dejar en reposo durante ocho horas para estabilizar la humedad de la harina, este proceso es considerado largo y dispendioso, afectando la eficiencia en la evaluación de amilosa. Se estimó una reducción significativa al calcular el tiempo y costo para realizar el mismo análisis empleado arroz con menos proceso de preparación de muestra: como arroz paddy o arroz integral, dejando como resultado optimización del proceso. En el mismo orden de ideas, evaluar el contenido de amilosa en muestra con la menor manipulación y preparación contribuye con los resultados del programa de fitomejoramiento del FLAR y el CIAT, no sólo porque se reduce el tiempo de preparación de muestras y el costo de operación, sino también porque se entregan más rápido los resultados y se genera mayor capacidad de análisis, teniendo en cuenta que, en los últimos años se ha venido incremento el número de evaluaciones de amilosa en el laboratorio de calidad de arroz del FLAR, pasando de evaluar 13000 muestras en el año2008 a 20000 muestras en el año 2014.
El objetivo de este trabajo es establecer la viabilidad de realizar una calibración en el NIRS que cuantifique amilosa con arroz en paddy o arroz integral ya que estos dos requieren menos proceso de preparación de muestra, contribuyendo en la optimización del análisis y en la efectividad en la entrega de resultados a los mejoradores de arroz, quienes utilizan los datos para continuar sus avances de mejoramiento genético.
MATERIALES Y METODOS
Área de estudio
Las actividades de este estudio se desarrollaron en el Laboratorio de Calidad de Arroz del Fondo Latinoamericano para Arroz de Riego FLAR, ubicado en el Centro Internacional de Agricultura Tropical – CIAT. Este Centro de Investigación está localizado en el kilómetro 17 recta Cali – Palmira, municipio de Palmira, Valle del Cauca. Con una temperatura promedio de 26ºC, una altura de 1001 m.s.n.m. y con coordenadas 3° 29’56.42” Latitud Norte, 76° 21’22.36” Longitud Oeste. La temperatura promedio del Laboratorio de Calidad es 22 ºC y humedad relativa de 56%.
Muestras ]]>
La muestra utilizada fue arroz paddy y arroz integral, para el método de referencia se utilizó harina de arroz pulido. Se tomaron 540 accesiones procedentes del banco de trabajo del CIAT con las cuales se realizó un barrido espectral que permitió determinar el estado del arroz ideal para desarrollar la calibración. Se realizó la calibración del equipo con los495 materiales más representativos de la muestra inicial, donde se utilizaron variedades de arroz del CIAT, líneas y variedades del FLAR, y un panel de diversidad de sub especies indicas de arroz obtenidas del banco de semilla del Instituto Internacional de Investigación de Arroz IRRI (por sus siglas en ingles). Para la selección de la muestra se tuvo en cuenta el contenido de amilosa por categoría: alta, intermedia y baja como también diversidad en la información genética.
Preparación de la muestras
La muestra utilizada en arroz paddy se secó al sol y luego se limpió las impurezas como piedras, raquis, raquillas arroz vano y otros. La muestra en arroz integral además de la limpieza se descascaró en un molino Suzuki MT-2005 N° 4.259-6; estos procesos se hicieron tanto para el barrido espectral como para el desarrollo de la calibración. Para el método de referencia se utilizó muestra en harina, la preparación de la harina de arroz también demandó de limpieza, secado, descascarado pulió del grano utilizando el molino Suzuki MT- 2005 N° 4.259-6, que además de tener la opción de descascarar permite pulir el arroz. Posteriormente, las muestras fueron pulverizadas en un molino Cyclone-Lab Sample Mill 3010-080p, con un tamaño de partícula 5mm.
Toma de espectros
Las muestras de arroz: paddy, integral y harina se analizaron y escanearon por duplicado empleando NIRS System 6500 con reflectancia (1/log R) y un rango de longitud de onda de 400-2,498 nm. Se tuvo en cuenta el mismo orden de escaneo desde el paddy hasta harina de arroz. ]]>
Análisis Espectral
En la selección del estado del arroz indicado para desarrollo de la calibración, se realizó análisis espectral utilizando herramientas estadísticas como: análisis de componentes principales ACP y la distancia de Mahalanobis (12).También, se realizó regresiones múltiples, y finalmente,se discrimino por tendencias teniendo en cuenta el comportamiento delos espectros con respecto a la clasificación por categoría de amilosa.
Calibración
Se empleo el software Winisi para establecer los ajustes decalibración: limpieza de ruidos, segmentación de espectro por longitudes de onda, aplicación de la segunda derivada utilizada en granos enteros (13), gap, smooth, logaritmos y regresión. Se hizo una matriz de resultados con los datos obtenidos teniendo en cuenta las diferentes variables mencionadas, de esta forma se proyectó el mejor coeficiente de determinación R2 , el error estándar de calibración SEC y el error estándar de validación cruzada SECV. Lo anterior se realizó utilizando la herramienta Monitor Result del programa Winisi que trae consigo el NIRS. Por otro lados se calculó la desviación residual predictiva RPD ≥ 3.0, considerando que para este rango se puede predecir datos y categorizar por alto, intermedio y bajo la amilosa (6).
Validación Validación Interna ]]>
Se tomaron232 muestras conocidas entre alta, intermedia y baja, estas muestras fueron también utilizadas en la calibración. Se calculó R2, SEP y Slope utilizando Monitor Result.
Validación Externa
En la validación externa se empleó 47 muestras desconocidas por la calibración, se calculó R2 y SEPcon el Monitor Result, y se hizo un ANOVA para determinar si se presentan diferencias significativas entre los valores de referencia y los predichos por la nueva calibración. Se halló el porcentaje de aciertos; donde aciertos=% aciertos/total. Lo anterior,dado que los fitomejoradores de arroz; buscan categorizar los materiales entre alto, intermedio y bajo en amilosa, y seleccionar los entre los descartables y los promisorios, sin importar la exactitud del valor.
Tiempo y Costos
Se realizó cálculos y tablas comparativas que permitieron estimar el tiempo y costo de la nueva calibración con respecto a la ecuación en harina de arroz.
]]> RESULTADOS
Análisis Espectral
Se encontraron APC mayores a 10,aceptables para realizar calibraciones en arroz paddy y arroz integral (13). Para el coeficiente de determinación el más representativo fue el R2 dela regresión múltiple de arroz integral (R2=0.47), se midió la distancia de Mahalanobis al centro poblacional (12) para lo cual se observaron 60 materiales atípicos en arroz paddy y 45 muestras atípicas para arroz integral.
Calibración
Dado los resultados del coeficiente de regresión fue considerado poco factible obtener una calibración con arroz paddy, por lo anterior, se consideró realizar solo una calibración empleando arroz integral. Las muestras atípicas identificadas por el cálculo de la distancia de Mahalanobis fueron eliminadas, considerando que los espectros restantes traen información limpia y representativa. En el Cuadro 1, se presenta las combinaciones más distintivas en las variables de calibración con la que se obtuvo 2inte.eqa;empleando 435 datos, con una matemática de 2,1,1,2 y una segmentación de longitud de onda de 11000-2492,2, un suavizado con la opción SNV and Detrend y un modelo de regresión de mínimos cuadrados parciales MPLS. Los resultados estadísticos obtenidos fueron SEC 0,33 SECV 1,20 R2 0,99 y RPD 3,06.
]]> Validación Interna
Se encontró un R2 = 0,83 (Figura 1) y SEP 1,23 y Slope 0.4, indicando una alta significancia en la predicción de datos.
Validación Externa
La validación interna fue mejor que la validación externa ya que en esta se obtuvo R2=0,68 (Figura 2) y SEP= 1,4. Los datos del ANOVA con un ∂ 0,05 (Tabla 1) no presento diferencias significativas con un p=0,34; lo que indica, que entre los datos obtenidos por la calibración con harina de arroz y los datos predichos por calibración con arroz integral se presentan similitud.

FIGURA 1. Correlación de la validación interna.

FIGURA 2. Correlación validación externa.
 ]]>
]]>
TABLA 1. ANOVA entre datos de referencia y datos predichos.

TABLA 2. Relación tiempo y costo por muestra.

TABLA 3. Tiempo y costo requerido para evaluar amilosa /año. ]]>

En la Tabla 3, se observa el tiempo y costo de evaluación del contenido de amilosa en el año, evaluando en generaciones tempranas, 15000 muestras aproximadamente con la calibración 2inte.eqa y 5000 muestras de líneas avanzadas empleando la calibración de harina de arroz.
DISCUSIÓN
De acuerdo a los resultados, se consideró realizar la calibración con arroz integral, donde se encontró un buen ajuste en las respuestas de los datos, con un mínimo de 23 componentes principales (>10 ACP) y adicionalmente se tuvo en cuenta el criterio de la distancia de Mahalanobis al centro poblacional (12) para lo cual se observaron 45 muestras atípicas las cuales fueron eliminadas, considerando que los espectros restantes traen información limpia y representativa. También se determinó el coeficiente de determinación dela regresión múltiple de R2=0.47 valorado comopoco representativo, pero siendo más alto al compararlo con el R2 obtenido para arroz paddy R2=0.10.Se probaron 32 combinaciones matemáticas de las cuales se encontraron 11 combinaciones con R2>0,90. Sin embargo, al realizar el análisis de desviación residual predictiva (RPD) se observaron solo tres combinaciones con valores cercanos a 3,0 (cuadro 1). Es de considerar que a mayor RPD mejor precisión, y que valores cercanos a 3,0 permiten establecer valores de referencias y permite categorizar por rango las muestras evaluadas (6).Con respecto al análisis de aciertos y a la predicción de los datos se puede considerar que es posible utilizar el modelo matemático encontrado con arroz integral 2inte.eqa para evaluar 15000 líneas de arroz en el año desde F3 hasta F6, con el 83 % de aciertos, considerando que es un porcentaje representativo para la selección temprana de poblaciones segregantes (9 y 10), las 5000 muestras evaluadas en generaciones avanzadas en el año requieren más detalle y precisión, para lo cual se pueden evaluar con la ecuación matemática hecha para harina de arroz, la cual tiene un R2 0.78 de validación externa. Simplificando el proceso de preparación de la muestras en la evaluación de amilosa en generaciones tempranas se puede optimizar el proceso en menor tiempo y costo, lo que significa reducción en 48 días laborales y US $3,500 dólares menos que al analizar el 100% de las muestras con harina de arroz, generando un valor agregado a los fitomejoradores del FLAR y el CIAT. ]]>
CONCLUSIONES
En los programas de mejoramiento de arroz es posible utilizar calibraciones en NIRS que permitan la predicción de datos en generaciones tempranas de acuerdo a los valores estadísticos en arroz integral, permitiendo contribuir de forma no destructiva, rápida y rentable en el desarrollo del cultivo de arroz para la calidad del grano.
AGRADECIMIENTOS
Ing. Andres Zuluaga Suarez, por la contribución durante su práctica profesional. A la Dra. Miryam Cristina Duque y Juan Cuasquer por la contribución y aportes en estadística. Al FLAR y al CIAT por el apoyo para el desarrollo de los trabajos en el Laboratorio de Calidad de Arroz.
REFERENCIAS
]]>
1.GRiSP (Global Rice Science Partnership). Rice Almanac, 4th edition, losBaños, Philippines: International Rice Research Institute; 2013. [ Links ]
2.Kusano M, Fukushima A, Fujita NO, Kobayashi M, Oitomen F, Ebana K, et al. Deciphering Starch Quality of Rice Kernels Using Metabolite Profiling and Pedigree Network Analysis. Mol. Plant. 2012; 5(2): 442 – 451.
3.Juliano, BO. Nutritive Value of Rice and Rice Diets. En: Philippine Rice Research Institute, editor. Rice Chemistry and Quality. 1 ed. Manila Philippine. Philippine Rice Research Institute; 2007. p 131-178.
4. [ Links ]Gaviria, L.J. Elaboración Culinaria y Organoléptica del Arroz Pulido Elaborado. En: Molinería de Arroz Tomo II. 1 ed. Bogotá DC.: Ediagro. LTDA. 2007, p 259-308.
[ Links ]
5.American Association of Cereal Chemists AACC. Approved Methods. 11th. ed. Determination of the pasting properties of rice with the Rapid ViscoAnalyser. Me- thod 61-02.01. Saint Paul, MN, USA; 2000. [ Links ]
6.Natsuga y Kawamura. (2006). Visible and Near-Infrared Reflectance Spectroscopy for Determining Physicochemical Properties of Rice.2006 American Society of Agricultural and Biological Engineers ISSN 0001−2351 1069. Vol. 49(4): 1069−1076.
7.Shenk, J.S.; Workman, J. and Westerhaus, M. Applications of NIRS. Agriculture products. In Handbook of NIRS.2ª.Editions.Burns.Pp 419-474.
[ Links ]
8.Bao, J. y Corke; H. Prediction of rice starch quality parameters by Near Infrared Reflectance spectroscopy. J Food Sci. 2001; 66(7): 936-939.
[ Links ]
9.Bao, J. y Liang, YS. Determination of thermal and retrogradation properties of rice starch using near infrared spectroscopy. JCereal Sci. 2007; 46(1): 75–81.
10.Wu, J.G. y Shi, C.H. Prediction of grain weight, brown rice weight and amylose content in single rice grains using near-infrared reflectance spectroscopy. Field Crops Res. 2004; 87(1): 13-21. [ Links ]
11.Wu JG, Shi CH. Calibration model optimization for rice cooking characteristics by near infrared reflectance spectroscopy (NIRS) Food Chem. 2007; 103 (3): 1054- 1061.(11).
[ Links ]
12.Cheewapramong, P. Use of Near-Infrared Spectroscopy for Qualitative and Quantitative Analyses of Grains and Cereal. Products. [Internet].University of Nebraska Lincoln: Food science Technology Department; December 2007. [citado 11 de mayo 2016]. Disponi- bleen:http://digitalcommons.unl.edu/foodscidiss/2/.
[ Links ]
13.Osborne, BG; Fearn, T; Hindle, PT. Practical NIR spectroscopy with applications in food and beverage analysis. Vol 1. 2nd ed. Addison-Wesley Longman & [ Links ]. ^rND^sKusano^nM^rND^sFukushima^nA^rND^sFujita^nNO^rND^sKobayashi^nM^rND^sOitomen^nF^rND^sEbana^nK^rND^sBao^nJ.^rND^sCorke^nH.^rND^sBao^nJ.^rND^sLiang^nYS^rND^sWu^nJ.G^rND^sShi^nC.H.^rND^sWu^nJG^rND^sShi^nCH^rND^nManuel^sJiménez Montero^rND^nSergio^sSánchez Silvera^rND^nManuel^sJiménez Montero^rND^nSergio^sSánchez Silvera^rND^nManuel^sJiménez Montero^rND^nSergio^sSánchez Silvera
Manuel Jiménez Montero y Sergio Sánchez Silvera
RESUMEN. El objetivo del presente estudio fue el de conocer la composición nutricional de los tubérculos de la papa de aire (Dioscorea bulbifera L.) especie subutilizada en la agricultura campesina panameña. Se seleccionaron 18 muestras obtenidas de parcelas de prueba ubicadas en comunidades campesinas del distrito de Donoso, provincia de Colón, en Panamá, durante los años 2012 y 2013. A las muestras seleccionadas se les determinó humedad, proteínas, azúcares, almidón, lípidos, cenizas y contenido energético. En el segundo año se incluyó el análisis de vitamina C, compuestos fenólicos y actividad antioxidante. No se encontraron diferencias significativas de los valores entre comunidades, tipo de parcela y año de cultivo, lo cual evidencia una alta estabilidad de estos valores nutricionales en las condiciones del trópico muy húmedo de Panamá. Los resultados obtenidos presentan un contenido nutricional similar al de otros tubérculos utilizados en la dieta campesina de Panamá. Los valores de actividad antioxidante y contenido de compuestos fenólicos encontrados le confieren características de alimento funcional.
Palabras clave: Cultivo subutilizado, alimento funcional, antioxidante, Panamá.
]]> SUMMARY. Nutritional evaluation of air potato (Dioscorea bulbifera L.) grown in Panamá. The goal of this study was to determine the nutritional composition of air potato (Dioscorea bulbifera L.) tubers, underutilized specie in the Panamanian peasant agriculture. The samples were obtained from test plots located in rural communities in the district of Donoso, Province of Colon in Panama, during the years 2012 and 2013. Contents of moisture, protein, sugars, starch, lipids, ashes and energetic were determined to the 18 selected samples. In the second year were included analysis of vitamin C, phenolic compounds and antioxidant activity. No significant differences of the values between communities, type of land and crop year were found, which suggest high stability of these nutritional values of air potato, in the very humid tropics conditions of Panama. The results show that the air potato tubers have a nutritional value similar to other tubers used in the peasant diet of Panama. The levels of antioxidant activity and phenolic content found, give D. bulbifera characteristics as a functional food.
Key words: Underutilized crop, functional food, antioxidant, Panama.
Recibido: 08-08-2016 Aceptado: 16-09-2016.
INTRODUCCIÓN
La papa de aire (Dioscorea bulbifera L.) es una especie perteneciente a la familia de los ñames (Dioscoreaceae), que ha sido utilizada en la alimentación humana en Asia, áfrica, Australia y América (1), principalmente por la población campesina e indígena de escasos recursos. Este nombre, y otros tales como ñame volador o papa voladora, hacen alusión a los tubérculos comestibles que produce, los cuales se originan en el tallo en las axilas de las hojas, y no en el suelo, como el resto de sus congéneres (Figura 1).
]]> Estudios recientes (2) señalan que la papa de aire es un cultivo de vieja presencia en las parcelas campesinas panameñas, pero con un nivel relativamente bajo de cultivo y consumo, lo cual lo ubica en el rango de cultivo subutilizado. En esa perspectiva, uno de los factores que limita su consumo es que no se tiene un conocimiento preciso de los aportes nutricionales que esta especie proporciona al ser humano, en las condiciones del medio rural panameño.
El presente estudio se sustenta en la hipótesis de que la papa de aire posee las cualidades nutricionales para convertirse en un importante fitorecurso para la alimentación humana en Panamá. Se plantea como objetivo conocer la composición química de la papa de aire (D. bulbifera) en las condiciones del trópico húmedo muy lluvioso de Donoso, Colón, destacando los aspectos relevantes para su promoción como cultivo alimenticio en la región.
MATERIALES Y MÉTODOS
Las muestras se obtuvieron en parcelas de prueba establecidas durante dos años consecutivos (2012 y 2013) en los terrenos de agricultores campesinos, y bajo su manejo y supervisión, en el distrito de Donoso en la provincia de Colón, República de Panamá. En dicha experiencia se seleccionaron seis comunidades (El Jobo, Dominical, Belorizal, San Luis, Concepción y Guasimo), y en cada una se establecieron tres (3) parcelas con 25 plantas cada una, para un total de 18 parcelas, con tres variantes de distancia de siembra entre plantas.
La cosecha de las parcelas se realizó en el mes de noviembre, siete meses después de la siembra. La primera se realizó entre el 10 y el 25 de noviembre de 2012 y la segunda entre el 9 y 24 de noviembre de 2013. En ambos casos se realizó la colecta total de los tubérculos de cada parcela, una por una. Las muestras se obtuvieron a partir de los tubérculos medianos (diámetro entre 5 y 10 centímetros), tomando 6 tubérculos al azar de ese grupo en cada parcela. Las mismas fue- ron llevadas al Laboratorio de Bioquímica de Alimentos y Nutrición de la Universidad de Panamá a fines del mes de noviembre de cada año, obteniendo los resultados en febrero de 2013 y mayo de 2014, respectivamente. El análisis químico proximal incluyó humedad, cenizas, lípidos, azúcares totales, almidón y proteína.
]]> De cada muestra se tomaron 120 g de la porción comestible, las cuales fueron deshidratadas en un horno a 105°C durante 16 horas. Esta porción seca fue transformada en un fino polvo, por homogenización utilizado un molino de cuchilla Black & Decker y se colocaron en envases herméticos para minimizar la rehidratación. Para la determinación de humedad, cenizas, lípidos, almidón y proteína cruda, se utilizaron los procedimientos analíticos recomendados por el AOAC (3) y los azúcares totales se analizaron según Osborne y Voogt (4).
En el segundo año (2013) se realizaron tres determinaciones adicionales: vitamina C, fenoles totales y actividad antioxidante, en porciones cruda y cocida de seis muestras de tubérculos, una por comunidad. La actividad antioxidante se determinó por el método ba- sado en la reducción de la solución metanólica de 2,2- difenilpicrilhidrazilo (DPPH) descrito por Lamaison et al (5). El contenido de vitamina C se determinó se determinó por titulación, utilizando 2,6-ciclorofenolindo- fenol (3). Los compuestos fenólicos se determinaron utilizando el reactivo de Folin-Ciocalteu con el método descrito por Singleton y Rossi (6). La porción cruda se procesó fresca y la porción cocida se obtuvo de tubérculos cocidos en agua durante 15 minutos, sin ningún tipo de adición.
Los resultados obtenidos se procesaron con el paquete estadístico STATISTICA 7. Este procesamiento incluyó el análisis exploratorio, estadísticas básicas, análisis de varianza y prueba de medias.
 ]]>
]]>
RESULTADOS
En relación al contenido nutricional se obtuvo como valores promedio de los dos años de cultivo (en g/100 g) una humedad de 72.7, cenizas 1.12, lípidos 0.23, proteína 1.25, azúcares 0.14, almidón 23.8 y un contenido energético de 103.3 Kcal/100 g (Tabla 1).
No se encontró diferencias significativas de los valores entre comunidades, tipo de parcela y año de cultivo, lo cual da cuenta de una alta estabilidad de la composición química de la papa de aire en las condiciones del trópico muy húmedo de Panamá.
En cuanto a los análisis incorporados en la segunda cosecha se obtuvieron resultados que abren nuevas perspectivas al estudio de D. bulbifera en Panamá. Como se observa en la Tabla 2 los valores de vitamina C encontrados, con una media de 7.30 mg/ 100 g de peso fresco, se ubican en un rango relativamente bajo, lo cual es típico para este tipo de producto. No obstante, al evaluarse la actividad antioxidante en los tubérculos, se obtuvo resultados que indican valores comparativamente altos para un producto farináceo. Dicha actividad parece responder al contenido de compuestos fenólicos, que también se ubica en un rango alto, con una Concentración de Inhibición media (CI50) de 189.9 mg equivalentes de ácido gálico/100 g (Tabla 2).
De la comparación de estos valores para muestra cruda y cocida, se encontró que la cocción de los tubérculos no parece afectar de manera importante este contenido, ya que si bien se aprecia una leve disminución, no produce cambios significativos y se puede considerar despreciable. ]]>

TABLA 2. Vitamina C, compuestos fenólicos y actividad antioxidante en tubérculos de papa de aire de Donoso, Panamá, Año 2013.
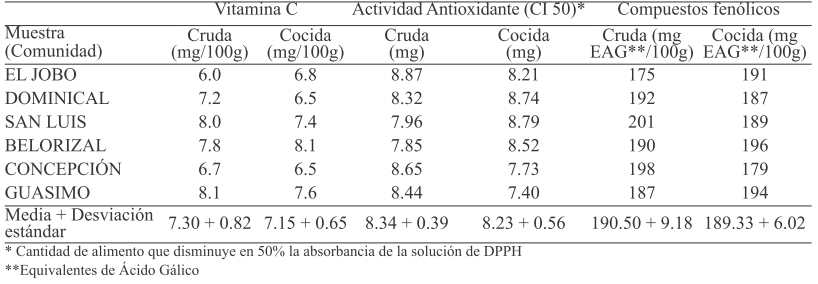
Los valores encontrados corresponden a un tubérculo típico, es decir, con alto contenido de almidón y contenido energético y bajo contenido de azúcares, lípidos y proteínas, similar a otros tubérculos del mismo género consumidos por la población campesina e indígena de Panamá, como el ñame (Dioscorea alata) y el ñampí (Dioscorea trífida), de acuerdo con la Tabla de Composición de Alimentos de Centroamérica (7). De igual forma se reportan valores similares de carbohidratos, lípidos y aporte calóricos en tubérculos del mismo género (D. alata y D.cayanensis) en Brasil (8).
Al comparar los valores nutricionales encontrados en este estudio con los reportados a nivel internacional para D. bulbifera en base húmeda, se observó que la mayor similitud se dio con los valores reportados por la FAO para una muestra de Australia (9). Sin embargo, en la mayoría de los casos los valores encontrados difieren de manera destacable. Los valores de proteína y cenizas fueron inferiores a los de Libra et al (10) en Costa de Marfil, a los encontrados en Himalaya por Chandra et al (11), a los reportados por la Tabla de composición de alimentos de áfrica Occidental (12), y Sanful et al (13) en Ghana. Lo común en todos los casos es que el contenido de agua de los tubérculos de papa de aire del presente estudio fue superior a todos en una media del 10%, lo cual señala que en las condiciones de Panamá los tubérculos tienden a acumular más agua, en detrimento de los otros componentes nutricionales y corrobora lo señalado por Badui (14) de que la composición final de un alimento vegetal depende de muchos factores, tales como la variedad de la semilla, el tipo de suelo, la temperatura ambiental, entre otros; es decir, responde a factores genéticos, climáticos y ecológicos. No obstante esta variación, la composición nutricional de la papa de aire puede considerarse adecuada para el consumo de la población.
En lo relativo al contenido de vitamina C, valores similares fueron también reportados para papa de aire por Peña y Ruiz en Tabasco, México (15) y en Brasil (8) se observó similitud de su contenido con especies del mismo género (D. alata y D.cayanensis).
El aporte singular de estos tubérculos viene dado por los altos niveles de actividad antioxidante, que se correlacionan positivamente con el contenido de compuestos fenólicos hallados, los cuales además se encuentran en un rango comparable al de hortalizas de raíz y fruto (16). Según Quintanar y Calderón (17) la actividad antioxidante incluye diversos mecanismos con los cuales los organismos aerobios enfrentan el deterioro celular, provocado principalmente por los radicales libres. Un mecanismo lo constituyen los antioxidantes exógenos, tales como la vitamina C y los polifenoles. El contenido de estos últimos parece ser la causa principal de la actividad antioxidante en el contenido de los tubérculos de D. bulbifera. Resultados similares fueron reportados por Ghosh et al (18) quienes señalan que D. bulbifera contiene cantidades significativas de fitoquímicos con propiedades antioxidantes que pueden ser explotadas como fuente potencial para reducir el estrés oxidativo inducido por enfermedades.
Estudios recientes han demostrado que muchos constituyentes polifenólicos dietéticos derivados de plantas son antioxidantes más eficaces in vitro que las vitaminas E o C, y por lo tanto pueden contribuir significativamente a los efectos protectores in vivo (19). Esto ha motivado un creciente interés en la investigación sobre el papel de los antioxidantes de origen vegetal en la alimentación y la salud humana. La influencia beneficiosa de muchos productos alimenticios y bebidas en la salud humana ha sido reconocido recientemente que proceden de su actividad antioxidante (20). Estudios recientes con D. bulbifera reportan también esta actividad antioxidante, como muestran los estudios desarrollados por Ghosh et al (21) y Mariyan (22). ]]>
Por otro lado, la correlación entre actividad antioxidante y compuestos fenólicos es ampliamente comprobable en otros productos de origen vegetal (23) y se ha encontrado no solo su relación lineal positiva y significativa, sino también que los compuestos fenólicos fueron los componentes antioxidantes dominantes (24), con independencia del método analítico utilizado (25). En un estudio con 56 plantas en China, Son et al (26) encontraron también una alta correlación positiva entre la capacidad antioxidante y el contenido de fenoles totales, lo que a su entender indica que los compuestos fenólicos son un importante contribuyente de la actividad antioxidante de estas plantas. Sus resultados señalan que Dioscorea bulbifera mostró los valores mayores en ambas variables, por lo que podría ser una potencial fuente rica en antioxidantes naturales.
Otro factor a considerar al evaluar estas variables nutricionales lo constituye el efecto de la cocción en ellas. Según Marquina et al (27) la cocción de los vegetales y frutas causa la reducción de su actividad antioxidante y su concentración de polifenoles. Trabajando con D. bulbifera y D. dometorum en Nigeria, Ogbuagu (28) también encontró una disminución de valores luego de la cocción. Sin embargo, Tarwadi (16) anota que a pesar de las pérdidas por cocción la asociación entre valores seguía siendo fuerte.
Shajeela et al (29) reportaron que entre diversas especies de Dioscorea, los tubérculos de D. bulbifera presentaron los mayores contenidos de compuestos fenólicos libres, agregando que estos son compuestos solubles en agua, y como tales, pueden ser eliminados por inmersión seguida por la cocción. Sin embargo, el resultado del presente estudio no coincide con este planteamiento, toda vez que el contenido de compuestos fenólicos no varió significativamente en la muestra cocida, lo cual indica que los componentes responsables de la actividad antioxidante en la papa de aire producidos en Donoso, son estables a las condiciones de cocción.
CONCLUSIONES
Este estudio permite un primer acercamiento al conocimiento de la composición química y calidad nutricional de los tubérculos de papa de aire en las condiciones del trópico muy húmedo de Panamá. Las muestras analizadas dan cuenta de valores correspondiente a un tubérculo típico, es decir, con alto contenido de almidón y contenido energético y bajo contenido de azucares, lípidos y proteínas, similar a otros como el de ñame, malanga o yuca, con lo cual se considera que su consumo es adecuado para la población. El contenido de compuestos fenólicos y actividad antioxidante que presentan los tubérculos de papa de aire es alto para rizomas y farináceas y lo ubica en el rango de los alimentos funcionales. Los resultados orientan en la necesidad de fortalecer la promoción del cultivo y consumo de la papa de aire y realizar nuevos estudios para profundizar en el conocimiento de sus propiedades nutracéuticas. ]]>
AGRADECIMIENTOS
A la Secretaría Nacional de Ciencia, Tecnología e Innovación de Panamá (SENACYT) por el financia- miento otorgado para la realización de esta investigación. A los agricultores y comunidades campesinas del distrito de Donoso, quienes colaboraron de manera directa y entusiasta en las actividades de campo.
REFERENCIAS
1.Rincón AM, Araujo de Vizcarrondo C, Carrillo de Padilla F, Martin E. Evaluación del posible uso tecnológico de algunos tubérculos de las dioscoreas: ñame congo (Dioscorea bulbífera) y mapuey (Dioscorea tri- fida). Arch Latinoam Nutr 2000; 50 (3): 286-290.
2. [ Links ]Jiménez-Montero M, Aguilar Martínez A.. Estudio et- nobotánico de la papa de aire (Dioscorea bulbifera L.) en Donoso (Colón, República de Panamá). Revista Luna Azul, 2016; (42): 54-67. DOI: 10.17151/luaz.2016.42.6 [ Links ]
3.Association of Official Analytical Chemists. Official methods of analysis of AOAC International. 16ª ed. Gaithersburg (MD), USA; 1997.
[ Links ]
4.Osborne D R., Voogt, P. 1978. The analysis of nutrients in foods. Academic Press, London, U.K., 240-p.
[ Links ]
5.Lamaison JL, Petitjean-Freytet C, Carnat A. Medicinal Lamiaceae with antioxidant properties a potential source of rosmarinic acid. Pharm Acta Helv 1991; 66 (7):185-188. [ Links ]
6.Singleton VL, Rossi JA. Colorimetry of total phenolics with phosphomolybdic-phosphotungstic acid reagents. Am J Enol Viticult 1965; 16 (3):144-158.
]]>
7. [ Links ]Tabla de composición de alimentos de Centroamérica. INCAP Instituto de Nutrición de Centroamérica y Panamá. Menchú, M. T. y Méndez, H. (Editores) INCAP/OPS, 2007. Segunda Edición. Tercera Reimpresión 2012. 128 pp. ISBN: 99922-880-2-7.
[ Links ]
8.Ministério da Saúde. Secretaria de Atenção à Saúde. Departamento de Atenção Básica. Alimentos regionais brasileiros. Brasília, Ministério da Saúde, 2015. 484 p. ISBN 978-85-334-2145-5.
[ Links ]
9.FAO/INFOODS Food Composition Database for Biodiversity Version 2.1 – BioFoodComp2.1. FAO, Rome. Food and Agriculture Organization of the United Nations, Rome, 2013.
10.Libra MA, Gonnety JT, Ahí AP, Dabonne S, Ahipo ED, Kouame LP. Physicochemical Changes in Bulbils of Two Cultivars of Dioscorea bulbifera During the Ripening Period. Adv J Food Sci Technol 2011; 3(5): 327-331. [ Links ]
11.Chandra S, Saklani S, Mishra PA, Bamrara A. Nutritional profile and phytochemical screening of Garhwal Himalaya medicinal plant Dioscorea bulbifera. International Research Journal of Pharmacy 2012; 3(5): 289-29. ISSN: 2230-8407. ]]>
[ Links ]
12.West African Food Composition Table. FAO 2012. En: http://www.fao.org/documents/card/en/c/238ce5e9-acd5-5cb2-8442-6498506aee1c/.
13. [ Links ]Sanful RE, Oduro I, Ellis WO. Proximate and Functional Properties of Five Local Varieties of Aerial Yam (Dioscorea bulbifera) in Ghana. Middle East J Sci Res 2013; 14 (7): 947-951.
[ Links ]
14.Badui D. S. Química de alimentos. Cuarta Edición, Pearson Educación, México, 2006, 736 p. ISBN: 970-26- 0670-5.
[ Links ]
15.Peña L. EG, Ruiz C. V. Vitaminas hidrosolubles en fitorrecursos alimenticios de comunidades étnicas de Tabasco. Revista Universidad y Ciencia 2003; 19 (38): 85-91.
]]>
16. [ Links ]Tarwadi K, Agte V. Antioxidant and micronutrient quality of fruit and root vegetables from the Indian sub- continent and their comparative performance with green leafy vegetables and fruits. J Sci Food Agric 2005; 85(9):1469–1476.
17.Quintanar E., M. A. y J. V. Calderón S. 2009. La capacidad antioxidante total. Bases y aplicaciones. Revista de Educación Bioquímica, vol. 28, núm. 3, pp. 89- 101.
[ Links ]
18.Ghosh S, Derle A, Ahire M, More P, Jagtap S, et al. Phytochemical Analysis and Free Radical Scavenging Activity of Medicinal Plants Gnidia glauca and Dioscorea bulbifera. PLoS ONE 2013; Vol 8, No. 12, e82529. 18 p. DOI: 10.1371/journal.pone.0082529. [ Links ]
19.Rice-Evans C, Miller N, Paganga G. Antioxidant properties of phenolic compounds Trends Plant Sci 1997; 2 (4); 152-159.
[ Links ]
20.Gülçin I. Antioxidant activity of food constituents: an overview. Arch Toxicol 2012; 86 (3): 345-391. ]]>
[ Links ]
21.Ghosh S, Nitnavare R, Dewle A, Tomar GB, Chippal katti R, More P, et al. Novel platinum palladium bimetallic nanoparticles synthesized by Dioscorea bulbifera: anticancer and antioxidant activities. Int J Nanomedicine 2015; 10: 7477–7490.
22.Mariyam NF. Medicinal Uses of Dioscorea bulbifera A Review. Res J Pharm Technol 2015; 8 (8): 1059- 1062.
[ Links ]
23.Velioglu YS, Mazza G, Gao L, Oomah BD. Antioxidant Activity and Total Phenolics in Selected Fruits, Vegetables, and Grain Products. J. Agric. Food Chem.1998; 46 (10): 4113–4117.
24.Caia Y, Luob Q, Sunc M, Corke H. Antioxidant activity and phenolic compounds of 112 traditional Chinese medicinal plants associated with anticancer. Life Sciences 2004; 74 (17):2157–2184.
25.Pavel Stratil , Bořivoj Klejdus , and Vlastimil Kubáň. Determination of Total Content of Phenolic Compounds and Their Antioxidant Activity in Vegetables - Evaluation of Spectrophotometric Methods. J. Agric. Food Chem. 2006; 54 (3); 607–616. ]]>
26.Song FL, Gan RY, Zhang Y, Xiao Q, Kuang L, Li HB. Total phenolic contents and antioxidant capacities of selected Chinese medicinal plants. Int. J Mol Sci 2010; 11(6): 2362-2372.
[ Links ]
27. Marquina V, Araujo L, Ruíz J, Rodríguez-Malaver A, Vit P. Composición química y capacidad antioxidante en fruta, pulpa y mermelada de guayaba (Psidium guajava L.). Arch Latinoam Nutr 2008; 58 (1): 98-102. [ Links ]
28.Ogbuagu MN. Nutritive and Anti-Nutritive Composition of the Wild (In-Edible) Species of Dioscorea bulbifera (Potato Yam) and Dioscorea dumentorum (Bitter Yam) J. Food Tech 2008; 6 (5): 224-226.
29. [ Links ]Shajeela, P.S. ; V. R. Mohan, L. Louis JL, Tresina SP. Nutritional and antinutritional evaluation of wild yam (Dioscorea spp.). Tropical and Subtropical Agroecosystems 2011; 14(2):723-730. [ Links ]
Composición nutricional, compuestos fenólicos y capacidad antioxidante de cascarilla de garbanzo (Cicer arietinum)
Guillermo Niño Medina, Dolores Muy Rangel, Aurora de Jesús Garza Juárez, Jesús Alberto Vázquez-Rodríguez, Gerardo Méndez Zamora, Vania Urías Orona
Universidad Autónoma de Nuevo León, Facultad de Agronomía, Nuevo León, México. Centro de Investigación en Alimentación y Desarrollo (CIAD), Culiacán, Sinaloa, México.
Universidad Autónoma de Nuevo León, Facultad de Salud Pública y Nutrición. Monterrey, Nuevo León, México.
RESUMEN. La composición química, minerales, azúcares neutros, compuestos fenólicos y capacidad antioxidante fueron analizados en la cascarilla de garbanzo. La cascarilla de garbanzo presentó 72% de fibra dietaria, del cual el 24.4% fue celulosa. Los compuestos fenólicos y actividad antioxidante de la cascarilla de garbanzo fueron evidentes, predominando los taninos condensados totales con 13.28 mgEC/g, donde la fracción soluble fue mayor respecto a la fracción ligada. El contenido de proteína y grasa fue de 4.5 y 0.4%. En conclusión, la cascarilla de garbanzo tiene propiedades nutricionales y funcionales que pueden ser consideradas en el diseño de nuevos productos alimenticios para mejorar la salud de los consumidores. ]]>
Palabras clave: Composición química, fibra dietaria, azúcares neutros, compuestos fenólicos, actividad antioxidante, Cicer arietinum.
SUMMARY. Nutritional composition, phenolic compounds and antioxidant capacity of chickpea (Cicer arietinum) husk. The chemical composition, minerals, neutral sugars, phenolic compounds and antioxidant capacity were analyzed in the chickpea husk. Chickpea husk presented 72% of dietary fiber of which 24.4% was cellulose. The content of phenolic compounds and antioxidant capacity of chickpea husk was evident, predominating condensed tannins with a total content of 13.28 mgECat/g, of which soluble fraction was the higher than bound fraction. The content of protein and fat was 4.5 and 0.4 %, respectively. In conclusion, chick pea husk has nutritional and functional properties that can be considered in the design of new food products to improve the health of consumers.
Key words: Chemical composition, dietary fiber, neutral sugars, phenolic compounds, antioxidant capacity, Cicer arietinum.
Recibido: 26-07-2016 Aceptado: 09-10-2016.
INTRODUCCIÓN ]]>
El consumo de leguminosas es importante, sus granos o semillas tienen más proteínas que los cereales, alto porcentaje fibra dietaria, minerales y almidón (1); además poseen efectos fisiológicos benéficos en la prevención de la diabetes, problemas de obesidad, enfermedades cardiovasculares y cáncer de colon (2). La cascarilla, pericarpio o cubierta de las leguminosas normalmente son destinadas como alimento para ganado después del procesamiento del grano. Son un material de desecho de algunas industrias alimentarias como la aceitera y harinera, representan un subproducto del 20% del total de la leguminosa procesada (3). Este tipo de industrias generan residuos con potencial antioxidante, antimicrobiano, así como compuestos bioactivos, tal es el caso de la cascarilla de garbanzo. Además de ser un sub producto de bajo costo, la cascarilla de garbanzo posee un alto contenido de fibra dietaria y polifenoles. La fibra dietaria, se constituye de celulosa, hemicelulosa, pectina, lignina, gomas y su consumo trae consigo beneficios al organismo humano como la disminución del colesterol, lipoproteínas de baja densidad (LDL), problemas del tracto digestivo e incidencia de cáncer de colon (4). Por su parte, los compuestos fenó- licos son metabolitos secundarios esenciales para el desarrollo y crecimiento de las plantas, usados como mecanismo de defensa. Los polifenoles (flavonoides, taninos, ácidos fenólicos) desde el punto vista nutricional tienen un alto impacto por su actividad antioxidante (5). Los antioxidantes reducen el estrés oxidativo y participan en la prevención de enfermedades degenerativas como el cáncer y padecimientos cardiovasculares, poseen propiedades antiinflamatorias, y su efectividad depende de la cantidad consumida y su biodisponibilidad (6). El objetivo de este estudio fue evaluar la composición química, minerales, azúcares neutros, compuestos fenólicos y capacidad antioxidante de la cascarilla de garbanzo.
MATERIALES Y MÉTODOS
Obtención de la cascarilla de garbanzo
Grano de garbanzo tipo Kabuli Variedad ʽJumboʼ de coloración crema fue donado por la Unión Nacional de Productores y Exportadores de Garbanzo (UNPEG, Culiacán, Sinaloa, México). Dos muestras de 6.25 kg con dos replicas (n=4) se utilizaron para la caracterización. El grano fue humedecido en agua a 40°C durante 2 h, posteriormente la cascarilla del grano fue separada manualmente y secada durante la noche a 45°C. Finalmente, la cascarilla fue molida y tamizada a tamaño de partícula de 420 μm (malla 40), obteniendo un rendimiento de 3.5 %.
Análisis proximal y minerales ]]>
El análisis proximal y de minerales fue realizado de acuerdo a las metodologías oficiales de la AOAC (7): humedad (método 925.09), grasa (Soxhlet, método 923.03), fibra cruda (método 920.86), proteínas (micro Kjeldahl, método 960.52) y cenizas (método 923.03); el contenido de carbohidratos fue estimado por diferencia y los carbohidratos totales fueron obtenidos por diferencia más el contenido de fibra cruda. El contenido de fibra dietaria total (FDT) fue determinado basado en el método 985.29, utilizando el kit de fibra dietaria Megazyme®. En la determinación de minerales (método 955.06), las muestras fueron sometidas a una digestión ácida (HCl) y posteriormente se determinó el contenido de minerales en un espectrómetro de absorción atómica SpectrAA-220 (Varian). Los elementos de K y Na se analizaron por emisión de flama a 589.6 y 769.9 nm, respetivamente. El contenido de Ca, Mg, Zn, Cu, Fe, Mn se determinó por absorción atómica a 422.7, 285.2, 213.9, 324.7, 248.3 y 279.5nm, respectivamente.
Azúcares neutros (AN)
La determinación de AN fueron realizados por cromatografía de gases; 3 mg de cascarilla fueron tratados con 500 μL de ácido trifluoroacético 2N durante 1 h a 120°C, utilizando 200 μg de mio-inositol como estándar interno. Enseguida la muestra fue centrifugada, el sobrenadante recuperado, tratado con 150 μL de NaBH4 (20 mg/mL en NH4OH 1N) y posteriormente fue llevada a cabo la acetilación con 200 μL de anhídrido acético y 20 μL de 1-metilimidazol como catalizador; 2 mL de agua y 3 mL de cloroformo fueron agregados al material derivatizado y la fase clorofórmica fue recuperada y evaporada, así los acetatos de alditol fueron resuspendidos en acetona para su inyección en un cromatógrafo de gases Varian CP-3800 con detector FID (250°C), con columna capilar DB-23 de 30 m x 0.25 mm (210°C) y helio como gas acarreador a flujo constante de 3 mL/min. La integración de áreas fue hecho con el software MS Workstation versión 6.5 (SP1) (Varian Inc.), y los cálculos fueron realizados a partir de curvas estándares de ramnosa, fucosa, arabinosa, xilosa, manosa, galactosa y glucosa.
Celulosa
El pellet resultante del análisis de azúcares neutros se hidrolizó durante 5 h con H2SO4 concentrado y el contenido de azúcares totales se determinó por el método de antrona propuesto por Yemm y Willis (8); 100 μL del extracto se tomaron, adicionándoles 400 µL de agua destilada y 1000 μL de antrona al 0.2% en H2SO4 concentrado, se calentó en baño húmedo a 80°C por 10 min, posteriormente se enfrió en hielo y finalmente se tomó la lectura de las muestras a 620 nm en un espec- trofotómetro Cary 60 UV-Vis (Agilent Technologies). La determinación del contenido de celulosa se basó en una curva de calibración con glucosa y los resultados se expresaron en porcentaje. ]]>
Extracción de fenólicos libres y ligados
La extracción de fenólicos libres y ligados fue realizada de acuerdo al método de Urías-Orona et al. (9) con modificaciones. En la extracción de fenólicos libres se tomaron 100 mg de cascarilla de garbanzo y fueron suspendidos en 5 mL de metanol al 80%, enseguida la muestra fue tratada con flujo de argón durante 30 s y agitada a 200 rpm por 2 h. La muestra fue centrifugada a 4650 g, el sobrenadante fue recuperado y almacenado a -20°C hasta su análisis para fenólicos y capacidad antioxidante. En la extracción de fenólicos ligados, el pellet recuperado de la obtención de fenólicos libres fue tratado con 5 mL de NaOH 2M, flujo de argón por 30 s y agitado a 200 rpm por 4 h. Enseguida, el pH fue ajustado a 2.5 con HCl concentrado y centrifugado a 4650 g. El sobrenadante fue recuperado y se agregaron 5 mL de acetato de etilo en dos ocasiones. Los extractos de acetato de etilo fueron combinados y evaporados a 40°C con flujo de argón y almacenados a -20 °C. Al momento del análisis el extracto fue resuspendido en 3 mL de metanol al 80%.
Compuestos fenólicos y capacidad antioxidante Los ensayos de compuestos fenólicos y capacidad antioxidante fueron realizados de acuerdo a López Contreras et al. (10). La determinación del contenido de fenoles totales (FN) fue llevada a cabo utilizando el reactivo Folin-Ciocalteu, usando ácido clorogénico como estándar (0 a 200 mg/L) y el resultado fue expresado como miligramos equivalentes de ácido clorogénico por gramo de muestra (mgEAC/g). El contenido de flavonoides totales (FL) fue determinado con base al ensayo del cloruro de aluminio utilizando catequina como estándar (0 a 200 mg/L), y el resultado fue expresado como miligramos equivalentes de catequina por gramo de muestra (mgECat/g). El contenido de taninos condensados (TC) fue determinado con base en la prueba vainillina-HCl utilizando catequina como estándar (0 a 200 mg/L) y el resultado fue expresado como miligramos equivalentes de catequina por gramo de muestra (mgECat/g). La capacidad antioxidante fue evaluada con base en la reducción de absorbancia de los radicales 2,2-Difenyl-1-picrylhydrazilo (DPPH) y ácido 2,2-azino-bis(3-etilbenzotiazolin)-6-sulfónico (ABTS), utilizando Trolox como estándar (0 a 800 μmol/g) y expresados como micromoles equivalentes de Trolox por gramo de muestra (μmolET/g).
Análisis de datos
Los datos fueron expresados como media ± desviación estándar (yi = µ ± εi,n=4), obtenidos de los resultados de la estadística descriptiva para cada variable ]]>
evaluada; el software Minitab14.0 (Minitab, 2004) fue usado para estas determinaciones.
RESULTADOS
Análisis proximal
El contenido de humedad, cenizas, proteínas, grasa, carbohidratos, minerales y azúcares neutros se muestra en la Tabla 1. Los carbohidratos representaron el mayor contenido en la cascarilla de garbanzo, seguidos por proteína, humedad, cenizas y grasas. El contenido de fibra dietaria total fue de 78.8% siendo el principal componente polisacáridos no celulósicos (54.4%) seguido por la celulosa (24.4%).
El contenido de minerales encontrado en el presente estudio mostró en mayor proporción fue Ca, seguido por K y Mg (Tabla 2) con niveles de 9316, 7699 y 2799 ppm, respectivamente, mientras que Fe y Zn minerales esenciales en la nutrición humana con se encontraron en concentraciones de 83 y 29 ppm, respectivamente.
]]>
La Tabla 2 muestra la composición de azúcares neutros en la cascarilla de garbanzo, siendo los mayoritarios arabinosa (26.83%), galactosa (25.48%) y glucosa
(20.38%), seguidos por ramnosa (10.56%), xilosa (9.25%) y manosa (6.85%), mientras que el azúcar de menor concentración fue fucosa (0.64%).
Compuestos fenólicos y capacidad antioxidante
En la Tabla 3, se observa el contenido de compuestos fenólicos de la cascarilla de garbanzo. En fenoles totales las fracción libre presentó 1.50 mgEAC/g, mientras que el contenido de la fracción ligada fue de 0.11 mgEAC/g. En flavonoides totales el contenido de la fracción ligada y libre fue con 0.94 y 0.42 mgECat/g, respectivamente. En el contenido de taninos condensados la fracción libre y ligada arrojaron valores de 7.38 y 5.90 mgEAC/g, por lo que predomina la presencia de este grupo fenólico en la cascarilla de garbanzo. En cuanto a la capacidad antioxidante, la cascarilla de garbanzo presentó niveles de 2.81 y 2.35 μmolET/g en la fracción libre y ligada, respectivamente en el método DPPH, mientras que por el método ABTS la capacidad antioxidante fue mayor, observando que la fracción libre fue mayor a la ligada con 12.97 y 6.52 µmolET/g, respectivamente.
TABLA 1. Composición química de cascarilla de garbanzo (g/100g).

]]>
TABLA 2. Composición de azúcares neutros y minerales de cascarilla de garbanzo.

TABLA 3. Contenido total de compuestos fenólicos y capacidad antioxidante de cascarilla de garbanzo (Fracción Libre + Fracción Ligada).

DISCUSIÓN
]]>
Bose y Shams-Ud-Din (11) reportaron para cascarilla de garbanzo Bengal gram un contenido de 5.25 de proteína, 4.79 grasa y 4.79 ceniza (g/100g), donde la ceniza mostró una diferencia de 3.49 g con respecto a la obtenida en este estudio. La fibra dietaria total es uno de los componentes más importantes en las legumino- sas y se clasifica en fracciones soluble e insoluble, incluyendo la primera gomas, mucilagos, pectinas y algunas hemicelulosas, mientras que la segunda se compone de celulosa, lignina, y el resto de las hemicelulosas son parte de la fracción insoluble. Khan et al. (12) reportaron contenidos de 22% de fibra dietaria total, 6.5% de celulosa y 2.7% de pectina para grano de garbanzo sin cascarilla, observándose una gran diferencia con el presente estudio, ya que la cascarilla del grano se constituye principalmente de estos componentes. Bose y Shams-Ud-Din (11) utilizaron cascarilla de garbanzo a diferentes concentraciones en la formulación de galletas tipo cracker biscuits y observaron un incremento del 2.58% en el contenido de fibra cruda. Los carbohidratos son una fuente nutritiva importante y son clasificados en monosacáridos, oligosacáridos y polisacáridos; Wood y Grusak (13) reportaron un contenido de carbohidratos en grano entero de garbanzo tipo Desi de 51-65%, mientras que para el tipo Kabuli el 54-71%.
Las leguminosas son una fuente importante de minerales indispensables para el organismo humano, dentro de los principales en la nutrición humana están el Ca, Fe y Zn. Sandberg (14) evaluó el contenido de minerales en grano entero de garbanzo y reportó valores de 69, 35, 1240, y 1550 ppm para Fe, Zn, Ca y Mg, respectivamente, siendo los niveles de Fe y Zn cercanos a lo encontrado en el presente estudio, sin embargo sus niveles de Ca y Zn son inferiores a nuestros resultados. La biodisponibilidad de minerales en leguminosas está relacionado con el contenido de ácido fítico ya que este tiene un efecto negativo en su absorción. En este sentido, Wang et al. (15) reportó para garbanzo tipo Kabuli un contenido de 9.6 g/kg de ácido fítico el cual fue menor al compararlo con seis variedades de frijol con 12.2 g/kg en promedio, lo que sugiere que el garbanzo tiene mayor biodisponibilidad de minerales que el frijol, siendo este último la leguminosa la de mayor consumo en México.
Así mismo, en las leguminosas están presentes azúcares digeribles e indigeribles; en el grano entero de garbanzo han sido reportados azúcares libres (mono- sacáridos) como glucosa y galactosa en niveles de 700 y 50 mg/100g, respectivamente (16). En la determinación de los monosacáridos cuantificados para la cascarilla de garbanzo, arabinosa y galactosa se encuentran como componentes mayoritarios, lo que indica la presencia de arabino galactanos y ramnogalacturonanos los cuales son componentes de las pectinas (17).
Los compuestos fenólicos ligados se encuentran interaccionando con las hemicelulosas presentes en la fibra dietaria mediante un enlace tipo éster, lo cual explica su mayor contenido en las fracciones ligadas sometidas a condiciones de alcalinidad durante su extracción, ya que bajo estas condiciones se lleva a cabo la ruptura de este enlace (18). Segev et al. (19) reportaron en cascarilla de garbanzo tipo Kabuli un con- tenido de fenoles totales entre 0.2-1.1 mgECat/g, mientras que Kanatt et al. (3) reportaron en cascarilla de garbanzo Bengal gram, fenoles y flavonoides totales un contenido de 70 y 10 mgECat/g respetivamente; la diferencia observada con estos autores se debe al método de extracción empleado, así como a las características propias del grano, principalmente el color de la cascarilla. Diversos estudios han empleado diferentes técnicas como el descascarillado del grano, germinado, remojo y molienda con la finalidad de disminuir el tiempo de cocción, mejorar el sabor, la biodisponibilidad de minerales, proteínas y otros nutrientes, sin embargo cabe resaltar que esta acción afecta considerablemente la pérdida de los compuestos fenólicos presentes en este material vegetal (20). Los taninos son un grupo de polifenoles solubles en agua, forman complejos con polisacáridos y proteínas. Éstos se clasifican en taninos hidrolizables y taninos condesados (21). Han y Baik (22) reportaron para el grano de garbanzo una actividad antioxidante por ABTS en la fracción libre y ligada de 1.5 y 0.5 μmolET/g, respectivamente, los cuales están por debajo a lo obtenido en este estudio, con una diferencia del 11.47 y 6.02 mmolET/g. Ziu-Ul-Haq et al. (23) reportaron para garbanzo tipo Desi un contenido de fenoles totales, flavonoides totales y taninos condensados de 0.92-1.12, 0.79-0.99 y 0.58-0.69 mg/g, respectivamente, que fueron más bajos a lo reportado en este estudio, aunque la actividad antioxidante por DPPH y ABTS reportada por estos autores fue de 1.05-1.24 y 37.24-45.32 mmolTE/g, donde este último fue mayor a los obtenidos en este estudio.
CONCLUSIONES
]]>
La cascarilla de garbanzo tiene contenido de proteína considerable, un alto contenido de fibra dietaria total, además presenta contenidos elevados contenidos de Ca, K y Mg, así como de los azúcares arabinosa, galactosa, glucosa. Finalmente, también presenta contenidos elevados de compuestos fenólicos y altos niveles de capacidad antioxidante. Por estas características, la cascarilla de garbanzo puede considerarse con un buen valor nutritivo y funcional apto para mejorar la salud de los consumidores. También es posible considerar la cascarilla del garbanzo como una alternativa para potencializar la funcionalidad de otros alimentos.
AGRADECIMIENTOS
Al Programa de Apoyo a la Investigación Científica y Tecnológica (PAICYT) 2015 de la Universidad Autónoma de Nuevo León por el financiamiento otorgado. A Rosabel Vélez de la Rocha y Werner Rubio Carrasco, por la asistencia técnica brindada.
REFERENCIAS
1. De Almeida Costa GE, Da Silva Queiroz Monici K, Pissini Machado Reis SM, Costa de Oliveira A. Chemical composition, dietary fiber and resistant starch contents of raw and cooked pea, common bean, chick pea and lentil legumes. Food Chem. 2006; 94 (3), 327-330.
]]>
[ Links ]2. Campos-Vega R, Loarca Piña G, Oomah BD. Minor components of pulses and their potential impact on human health. Food Res Int. 2010; 43 (2), 461-482.
[ Links ]3. Kanatt SR, Arjun K, Sharma A. Antioxidant and antimicrobial activity of legume hulls. Food Res Int. 2011; 44 (10), 3182-3187.
[ Links ]
4. Tharanathan RN, Mahadevamma S. Grain legumes a boon to human nutrition. Trends Food Sci Tech. 2003; 14 (12), 507-518.
Links ] font-family: "Arial",sans-serif; color: navy;" lang="EN-US"> 5. Scalbert A, Manach C, Morand C, Rémésy C, Jiménez L. Dietary polyphenols and the prevention of diseases. Crit Rev Food Sci Nutr. 2005; 45 (4), 287-306.
[ Links ]6. Manach C, Scalbert A, Morand C, Rémésy C, Jiménez L. Polyphenols: food sources and bioavailability. Am J Clin Nutr. 2004; 79 (5), 727-747.
[ Links ]
7. Official Methods of Analysis of Association of Official Analytical Chemist International (AOAC). 1998; 16th Edition, 4th Revision. AOAC International Maryland, USA.
[ Links ]
8. Yemm EW, Willis AJ. The estimation of carbohydrates in plants extracts by anthrone. Biochem J. 1954; 57 (3), 508-514. ]]>
[ Links ]
9. Urias-Orona V, Heredia JB, Muy Rangel D, Niño Medina G. Acidos fenólicos con actividad antioxidante en salvado de maíz y salvado de trigo. Ecosistemas y Recursos Agropecuarios. 2016; 3 (7), 43-50.
[ Links ]
10. López-Contreras JJ, Zavala García F, Urias Orona V, Martínez ávila GCG, Rojas R, Niño-Medina G. Chromatic, phenolic and antioxidant properties of Sorghum bicolor genotypes. Not Bot Horti Agrobo. 2015; 43 (2), 366-370. [ Links ]
11. Bose D, Shams-Ud-Din M. The effect of chickpea (Cicer arietinum) husk on the properties of cracker biscuits. J Bangladesh Agril Univ. 2010; 8 (1), 147-152.
[ Links ]
12. Khan AR, Alam S, Ali S, Bibi S, Khalil IA. Dietary fiber profile of food legumes. Sarhad J Agric. 2007; 23 (3), 763-766. ]]>
[ Links ]13. Wood JA, Grusak MA. Nutritional value of chickpea. In: Chickpea breeding and management. [Yadav SS, Redden R, Chen W, Sharma B editors]. Wallingford, UK: CABI International. 2007; 101-142.
[ Links ]
14. Sandberg AS. Bioavailability of minerals in legumes. Brit J Nutr. 2002; 88 (S3), S281-S285.
[ Links ]15. Wang N, Hatcher DW, Tyler RT, Toews R, Gawalko EJ. Effect of cooking on the composition of beans (Phaseolus vulgaris L.) and chickpeas (Cicer arietinum L.). Food Res Int. 2010; 43 (2), 589-594.
[ Links ] ]]>
16. Sánchez-Mata MC, Peñuela-Teruel MJ., Cámara Hurtado M., Díez Marqués C, Torija Isasa ME. Determination of Mono, and oligosaccharides in legumes by high performance liquid chromatography using an amino-bonded silica column. J Agric Food Chem. 1998; 46 (9), 3648-3652.
[ Links ]17. Willats WGT, Knox JP, Mikkelsen JD. Pectin: new insights into an old polymer are starting to gel. Trends Food Sci Tech. 2006; 17 (3), 97-104. [ Links ]
18. Kroon PA, Faulds CB, Ryden P, Robertson JA, Williamson G. Release of covalently bound ferulic acid from fiber in the human colon. J Agric Food Chem. 1997; 45 (3), 661-667. [ Links ]
19. Segev A, Badani H, Kapulnik Y, Shomer I, Oren-Shamir M, Galili S. Determination of polyphenols, flavonoids, and antioxidant capacity in colored chickpea (Cicer arietinum L.). J Food Sci. 2010; 75 (2), S115-S119.
[ Links ] ]]>
20. Oghbaei M, Prakash J. Effect of primary processing of cereals and legumes on its nutritional quality: a comprehensive review. Cogent Food & Agriculture. 2016; 2 (1), 1-14.
[ Links ]
21. Han X, Shen T, Lou H. Dietary polyphenols and their biological significance. Int J Mol Sci. 2007; 8 (9), 950-988.
[ Links ]
22. Han H, Baik BK. Antioxidant activity and phenolic content of lentils (Lens culinaris), chickpeas (Cicer arietinum L.), peas (Pisum sativum L.) and soybeans (Glycine max), and their quantitative changes during processing. Int J Food Sci Tech. 2008; 43 (11), 1971-1978. [ Links ]
23. Zia-Ul-Haq M, Iqbal S, Ahmad S, Bhanger MI, Wicz kowski W, Amarowicz R. Antioxidant potential of Desi chickpea varieties commonly consumed in Pakistan. J Food Lipids. 2008; 15 (3), 326-342. [ Links ]
Samuel Durán Agüero, Gustavo Cediel Giraldo, Jerusa Brignardello Guerra
Facultad de Ciencias de la Salud. Universidad San Sebastián. Chile. Colegio de Nutricionistas Universitarios de Chile.
SUMMARY. Objective: To establish the relationship between sleep duration, nutritional status and caffeinated beverage consumption patterns in school-age Chilean children. Method: The study was conducted in 805 school age children, between 6 and 10 years old from 6 neighbor hoods in Santiago, Chile. Parents completed a questionnaire, which assessed sleep duration, physical activity and food intake. Anthropometric measurements were completed for children. Results: 52.6% of school age children were obese and 46.4% slept the recommended amount (≥10 hours). Normal weight subjects slept significantly more hours than obese participants, 9.8 ± 0.9 vs. 9.6 ± 0.9, respectively. Sleep duration during the week was inversely associated to obesity (OR: 3.5, 95% CI 1.3-9.2). Children drank the following beverages at night: caffeinated soft drinks (52.2 %), coffee and/or tea (32.6%) and 21.2 % both soft drinks and coffee tea caffeine beverages Conclusion: Over half of this sample of school-age Chilean children slept less than the recommended (≥10 hours) amount, with obese participants sleeping less than normal weight subjects. The intake of caffeine products in particular, caffeinated soft drinks, was higher during the night in both groups.
Key words: Sleep, obesity, nutritional status, caffeine.
RESUMEN. Relación entre el estado nutricional y la cantidad de sueño en escolares chilenos. Objetivo: establecer la relación entre cantidad de sueño, estado nutricional y consumo de cafeína en escolares Métodos: El estudio fue realizado en 805 escolares, entre 6 a 10 años de 6 comunas de Santiago de Chile. Los padres completaron las encuestas de sueño, actividad física y consumo de alimentos. A los escolares se les realizó una evaluación antropométrica. Resultados: El 56,2% de los escolares era obeso, el 46,4% dormía menos de lo recomendado (≥10 horas). La cantidad de sueño fue significativamente mayor en los escolares normal peso que en los obesos 9,8 ± 0,9 vs 9,6 ± 0,9, respectivamente. La cantidad de sueño durante la semana fue inversamente asociada a obesidad (OR: 3,5; 95% CI 1,3-9,2). Los escolares bebían en la noche antes de dormir: bebidas carbonadatas con cafeína (52,2%), café y/o té (32,6%) y un 21,2% ambos tipos de bebidas. Conclusión: Más de la mitad de esta muestra de niños en edad escolar, dormia menos de la cantidad recomendada (≥ 10 horas), los escolares obesos dormían menos de sujetos de peso normal. Además se observa una ingesta en la noche de bebidas carbonatadas con cafeína elevada en ambos grupos. ]]>
Palabras clave: Sueño, obesidad, estado nutricional, cafeina.
Recibido: 10-09-2016 Aceptado: 21-11-2016.
INTRODUCTION
Childhood obesity is considered a worldwide health problem (1). It increases the risk of the other diseases such as diabetes, dyslipidemia, arterial hypertension and has cardiovascular consequences in adulthood (2). In the last 2 decades, Chile has undergone an epide- miological transition, where pediatric under-nutrition was replaced by overweight and obesity (3). The main strategy for the prevention and treatment against this epidemic has been a healthy diet and physical activity (4). Results of interventions, however, have not been completely effective or positive (1,4,5). Interventions that address other risks factors are needed to reduce obesity and improve intervention results. Some studies have shown an association between reduced sleep du- ration and childhood overweight, especially in young children (6-8).
Sleep behavior, a healthy diet and physical activity have an important role in the physiological processes of growth, development and health (9). Short sleep du- ration is related to changes in levels of leptin, ghrelin and cortisol, in addition to glucose tolerance and insulin sensitivity (10). Additional studies have confirmed also that slept deprivation has an impact on increased hunger sensation and daytime appetite (11,12).Thus, short sleep duration is related to the risk of obesity (7). Encouraging adequate sleep as part of an intervention may be novel, effective and complementary to encouraging healthy eating habits and physical activity for the prevention and treatment of obesity (13). In recent years, an increasing number of population studies on the association between sleep and obesity among children have become available. However, similar information is not available for a pediatric large Chilean population or studies that evaluate the association bet- ween caffeine beverages and the sleep duration. Therefore, the aim of this study was to establish the relationship between sleep duration, nutritional status and caffeinated beverage consumption patterns in school-age Chilean children. ]]>
MATERIALS AND METHODS
Study Population: Twelve primary schools with similar socio- economic characteristics from Santiago, Concepción and Valparaíso, Chile. Participated in the study between August 2014 and October 2015. The sample size was calculated based on a previous study (6) and was powered to detect a difference in sleep du- ration between normal and obese participants of 0.5 hour with a standard error of α=0.05 and 0.9 power.
Inclusion criteria included being between 6 and 10 years old; enrolled in the test school the day of the evaluation, and not being currently treated for sleep disturbance or depression. A total of 887 school-age children between 6 and 10 years old were approached to participate in the study and 805 completed the questionnaires (90.7%). All parents or caregivers provided signed informed consent and children provided informed assent before participation. The institutional re- view board at the Universidad San Sebastián, Chile approved this study.
Anthropometric Measurements: Trained personal measured body weight and heigh. Weight was measured without shoes or belts in light clothing, and recor- ded to the nearest 0.1 kg with a digital scale (Seca 813 digital electronic floor scale). Height was measured with a stadiometer to the nearest 1 mm without shoes. WC was measured standing with a non-elastic tape, which was applied horizontally midway between the lowest rib margin and the iliac crest. Body Mass Index (BMI) was calculated as weight (kg)/height (m2). The used BMI reference was the National Center for Health Statistics/Centers for Disease Control and Prevention 2000 Growth Charts (14), which has been endorsed by the Chilean Ministry of Health for its use. Children were classified as obese if their BMI was >95th percentile, non-obese if the BMI was >10th <85th percentile and overweight if the BMI was ≥85 th ≤ 95 th but this group was not considered in our study.
Sleep Duration: Parents were asked to complete the 22-item Pediatric Sleep Questionnaire (PSQ) about their children. The PSQ provides high validity and sensitivity greater than 0.8. ]]>
Eating and Physical Activity Habits: Parents were asked about the contents of the last meal of the day, specifically caffeine intake. They were also asked to report the daily physical activity habits of their children. Adequate sleep duration was definedas sleep ≥10 hours per night (8).
Statistics: Data was entered using Excel. Normality of continuous variables was tested using the Shapiro-Wilk goodness of fit test. For normally distributed variables we used the Student t-test and the Mann Whitney U test was used for non normally distributed variables. Logistic regression was used to test the relationship between sleep duration, caffeine intake, physical activity and the dependent variable nutritional status. The α was set as <0.05 for statistical significance. We analyzed data using SPSS version 19.0, Chicago, IL.
RESULTS
We studied 805 school-age children of which 57% were boys; 47.4% were normal weight (n=382) and 52.6% were obese (n=423). Table 1 shows differences in weight, height and BMI by nutritional status. Forty six percent of students slept the recommended amount per night (≥10 hours). On weekdays normal weight children slept significantly more than obese students: 9.8 ± 0.9 hours vs 9.6 ± 0.9. Differences did not persist for the weekend. Normal weight girls sleep more hours on weekdays and on weekends (p<0.05). This differs from boys who only had significant differences for the weekend (p<0.05). We found no sex differences in sleep duration during the week and on the weekend.
Comparing sleep duration on weekdays by nutritional status and age among girls (Figure 1) we found that as age increased, sleep duration decreased. Six and 7- year old girls sleep significantly more compared to 10 year old girls. Normal weight girls ages 8 and 9 slept significantly more than obese girls of the same ages. We saw similar trends at other ages, but these did not reach statistical significance. We found no differences in sleep duration on the weekend. ]]>

FIGURE 1. Comparison of weekday sleep duration by age and nutritional status: males only.

]]> FIGURE 2. Comparison of weekday sleep duration by age and nutritional status: females only.

TABLE 2. Association between nutritional status.

Figure 2 shows that for boys bet- ween 6 and 10 years, as age increases, sleep duration decreases (p<0.05). These differences were not observed for the weekend. We found no differences between normal weight and obese boys of the same age with respect to sleep duration.
]]> Table 2 shows that sleeping <10.5 hours per night on a weekday was associated with greater odds of obesity (OR: 3.5, 95%CI 1.3-9.2). We found no other significant associations with obesity risk: sleep duration <10 or 11 hours, consumption of caffeine before bed, exercise and others (all p>0.05).
According to parent report, 32.6% of children drank coffee and tea after 8PM, 52.2% drank soft drinks and 21.2% regularly drink coffee, tea or soft drinks before bed. With respect to physical activity, only 20.4% of students reach the recommended amounts of ≥ 3 times per week for ≥ 30 minutes, with no significant differences by nutritional status. Two percent reported never exercising.
DISCUSSION
Among other behavioral changes in industrialized countries, a decrease in total sleep duration has been noted (13). Adolescents all over the world use computers and watch television for prolonged periods, postponing sleep onset and thus decreasing total sleep duration16. In the current study we observed that obese students slept significantly less during the week than normal weight participants, but no differences were found on the weekend. Both groups responded to the sleep restriction during the week by compensating on the weekend. Observational studies conducted among children have shown sleep duration is negatively associated with BMI and obesity risk (6,8). Chen (5) ob- served that children who slept <10 hours had a 58% higher risk of overweight or obesity (combined OR=1.58; 95% CI 1.26-1.98). For every additional hour of sleep, the risk of overweight/obesity was reduced by 9% (OR=0.91; 95% CI 0.84-1). This result is similar to that in our study in which sleeping <10.5 hours during the week was associated with obesity (OR: 3.5, 95% CI 1.3-9.2). In a study conducted among Chinese adolescents, researchers showed that short sleep duration was significantly associated with greater adiposity and less lean mass in females (15). Another study demonstrated that sleeping more in the school- age period is a protective factor for obesity (OR=0.2, 95% CI 0.08-0.85) (9). The association between sleep duration and obesity and sex differences is supported by several studies (13), however we did not find these differences in our analysis. One possible explanation could be that girls are less affected by sleep duration than boys. From an evolutionary perspective, boys may be more vulnerable to environmental stress in child hood, compared to girls (16).
A national survey conducted in the U.S. (2005) showed that 45% of adolescents sleep less than the recommended amount (8 hours or more per night) and 31% are on the border. We found similar values in our study (46%). In our sample of school-age children, we also found that as age increased, sleep duration decreased. Our findings are in line with those of a representative sample of U.S. adolescents conducted by the National Sleep Foundation in 2006 that found that sleep duration was primarily decreased because subjects were going to bed later (17).
]]> A recent study has reported a positive association between physical activity and increased sleep duration in children (18). However we did not find any association between physical activity and sleep duration, albeit the higher sedentary behavior in our sample (79.6%) compared to other studies conducted in school-age children (11,19).
Caffeinated and soft drinks were consumed regularly in both groups before bed, but is not possible to determine is this consumption has a possible disruptive role in sleep duration in obese children.
Strengths of this study include having a representative sample of public school children in Santiago and highly trained personnel carry out the anthropometric measurements. Several limitations must also be mentioned. Our study is cross sectional, thus causality cannot be determined. We used self reported measures to determine sleep duration, physical activity, and eating habits. This methodology may have introduced some bias. A final limitation is that screen time (television and/or computer) was not assessed. We consider this narrow age because Tanner staging assessment was not allowed to assess by school rules, hence a puberty assessment in this group could not be done. This is a limitation of our study.
CONCLUSION
Our results show that short sleep duration during the week (<10.5 hours) is associated with obesity in 6 to 10 year old school children and that obese children sleep less during the week compared to their nor- mal weight peers. Further research is needed to understand the impact of lack of sleep on children obesity, but also public health obesity interventions should include messages associated with adequate sleep duration in children.
ACKNOWLEDGEMENTS ]]>
For their time and helpful suggestions, we thank all of the teachers that collaborated on this project.
REFERENCES
1.Sharma M. International school-based interventions for preventing obesity in children. Obes Rev 2007; 8: 155– 67.
2.Herouvi D, Karanasios E, Karayianni C, Karavanaki K. Cardiovascular disease in childhood: the role of obesity. Eur J Pediatr. 2013;172(6):721-32.
3.Atalah E, Amigo H, Bustos P. Does Chile's nutritional situation constitute a double burden?. Am J Clin Nutr. 2014;100(6):1623S-7S. ]]>
[ Links ]
4.Flodmark CF, Marcus C, Britton M. Interventions to prevent obesity in children and adolescents: a systematic literature review. Int J Obes 2006; 30: 579-89.
[ Links ]
5.van Sluijs EM, McMinn AM, Griffin SJ. Effectiveness of interventions to promote physical activity in children and adolescents: systematic review of controlled trials. BMJ 2007; 335(7622):703. [ Links ]
6.Durán Agüero S, Haro Rivera P. Association between the amount of sleep and obesity in Chilean school children. Arch Argent Pediatr. 2016;114(2):114-119. [ Links ]
7.Cespedes EM, Hu FB, Redline S, Rosner B, Gillman MW, Rifas Shiman SL, et al. Chronic insufficient sleep and diet quality: Contributors to childhood obesity. Obesity (Silver Spring). 2016;24(1):184-90. [ Links ]
8.Chen X, Beydoun MA, Wang Y. Is sleep duration associated with childhood obesity? A systematic review and meta-analysis. Obesity 2008; 16(2): 265–74. ]]>
9.Zaqout M, Vyncke K, Moreno LA, De Miguel-Etayo P, Lauria F, Molnar D, et al. Determinant factors of physical fitness in European children. Int J Public Health. 2016. [Epub ahead of print] [ Links ]
10.Buxton OM, Cain SW, O'Connor SP, Porter JH, Duffy JF, Wang W, et al. Adverse metabolic consequences in humans of prolonged sleep restriction combined with circadian disruption. Sci Transl Med 2012; 4(129):129ra43.
[ Links ]
11.Spiegel K, Tasali E, Leproult R, Scherberg N, Van Cauter E. Twenty-four-hour profiles of acylated and total ghrelin: relationship with glucose levels and impact of time of day and sleep. J Clin Endocrinol Metab 2011; 96(2):486-93. [ Links ]
12.Spiegel K, Tasali E, Penev P, Van Cauter E. Brief communication: Sleep curtailment in healthy young men is associated with decreased leptin levels, elevated ghrelin levels, and increased hunger and appetite. Ann Intern Med 2004; 141(11):846-50.
13. [ Links ]Magee CA, Iverson DC, Huang XF, Caputi P. A link between chronic sleep restriction and obesity: methodological considerations. Public Health 2008; 122:1373–81.
14.National Center for Health Statistics/Centers for Disease Control and Prevention (2000). 2000 CDC growth charts: United States. Available at: http://www.cdc.gov/growthcharts/.
[ Links ]
15.Yu Y, Lu BS, Wang B, Wang H, Yang J, Li Z, et al. Short sleep duration and adiposity in Chinese adolescents. Sleep 2007; 30(12):1688-97.
[ Links ]
16.Morselli LL, Guyon A, Spiegel K.. Sleep and metabolic function. P flugers Arch. 2012;463(1):139-60. [ Links ]
17.National Sleep Foundation. Sleep in America Poll. Available at: http://www.sleepfoundation.org/sites/default/files/2006_summary_of_findings.pdf.
]]>
18. [ Links ]Khan MK, Chu YL1, Kirk SF, Veugelers PJ. Are sleep duration and sleep quality associated with diet quality, physical activity, and body weight status? A population-based study of Canadian children. Can J Public Health. 2015;106(5):e277-82.
[ Links ]
19.Villagrán Pérez S, Rodríguez-Martín A, Novalbos Ruiz JP, Martínez Nieto JM, Lechuga Campoy JL. Hábitos y estilos de vida modificables en niños con sobrepeso y obesidad. Nutr. Hosp 2010;25(5): 823-31. [ Links ]
UNA TRAYECTORIA DE LUZ
En Junio de 1950 el Instituto Nacional de Nutrición, INN, de Venezuela, publica por primera vez el Volumen 1, Número 1 de “Archivos Venezolanos de Nutrición”, AVN, (...) “ una publicación científica dedicada exclusivamente a la Nutrición.
” En los siguientes 15 años AVN publica sin interrupción 29 Números distribuidos en 16 Volúmenes. Durante la celebración de la Tercera Conferencia sobre los Problemas de Nutrición en la América Latina, en 1953, se consideró extraoficialmente la creación de una revista latinoamericana de nutrición.
Dos años mas tarde en 1955, apareció en AVN un Editorial que bajo el título “ Hacia una Revista Latinoamericana de Nutrición ”, dejaba vislumbrar el inicio de esta realidad. En Noviembre de 1964 se celebra en Caracas las Primeras Jornadas Venezolanas de Nutrición y allí se plantea la necesidad de la creación de una revista latinoamericana con el fin de centralizar en ella los numerosos trabajos que se elaboran en el hemisferio, ya que la mayoría de ellos se encuentran dispersos en publicaciones de difícil acceso. En consonancia con este criterio, durante el Congreso de Nutrición del Hemisferio Occidental celebrado en Noviembre de 1965 en Chicago, Illinois, se funda la Sociedad Latinoamericana de Nutrición, SLAN, y uno de sus principales objetivos es la publicación de una revista que recoja las investigaciones que sobre nutrición se llevan a cabo en Latinoamérica.
En un hermoso gesto, el Gobierno de Venezuela, en comunicación firmada por el Dr. Miguel Octavio Russa, Director Ejecutivo del Instituto Nacional de Nutrición dirigida al Dr. Conrado F. Asenjo, Presidente de la recién creada SLAN, cede la revista Archivos Venezolanos de Nutrición para que esta sea transformada en el órgano oficial divulgativo de la Sociedad bajo el nombre de Archivos Latinoamericanos de Nutrición, ALAN. Cito textualmente parte de la comunicación del Dr. Russa: “ La única condición para este traspaso será la de que se mencione en el rótulo externo de la nueva publicación el hecho de que fue creada originalmente como Archivos Venezolanos de Nutrición. ” Bajo este claro lineamiento, AVN, venezolana publicación, amplía su cobertura para ingresar en el ámbito latinoamericano.
El Volumen 15, Número 2 de 1965 es el último Archivos Venezolanos de Nutrición. A continuación la Sociedad Latinoamericana de Nutrición inicia en Caracas la publicación de Archivos Latinoamericanos de Nutrición bajo la responsabilidad editorial del Dr. Werner Jaffé, con el Volumen 16, Número 1, Septiembre 1966, de portada azul marino a 1/12 y en su centro la frase requerida por el INN. Durante los próximos 11 años, ALAN es publicado en Caracas y en 1978 la edición del Volumen 78 es trasladada al INCAP en Guatemala hasta el Volumen 41, 1991, período en el cual el Dr. Ricardo Bressani desempeña el cargo de Editor General. La revista regresa a Caracas para continuar su publicación con el Volumen 42, Marzo 1992, con estreno de nueva portada a 1/8, fondo blanco, con letras azules y espigas de trigo doradas. Entre 1992 y 2016, ALAN ha publicado ininterrumpidamente 24 Volúmenes con un total de 96 Números y 14 Suplementos.
En 1994 ALAN recibe el Premio Anual “Tulio Arends” otorgado por el CONICIT, (actualmente FONACIT) Venezuela, a la mejor revista científica y tecnológica nacional y en 1995 la Mención Honorífica al mismo Premio. En Febrero 2007 el FONACIT, en una Evaluación de Mérito de 74 revistas científicas y tecnológicas venezolanas, otorga a ALAN el cuarto lugar quedando ubicado en la segunda posición dentro del área de Biomedicina.
En la Evaluación Integral de 2010, ALAN obtiene una calificación de 80 puntos, para quedar en el quinto lugar sobre un total de 22 revistas. Desde 2016 ALAN es indexado en la Base de Datos MEDES, por gentil invitación de Iniciativa MEDES-MEDicina en Español, en nombre de la Fundación Lilly. Este merecido homenaje al prestigio de ALAN pone a disposición de los profesionales sanita rios de habla hispana, una herramienta de consulta bibliográfica cuyas características mas apreciadas son la calidad y la actualización continua, así como la evaluación rigurosa de sus contenidos. En Septiembre de 1968 se realiza en Caracas el primer Congreso de la SLAN y el Editorial del Volumen 19 de ALAN recoge un emotivo discurso del Dr. José Eduardo Dutra de Oliveira, su Presidente, bajo el título de “ Saudacaos aos participantes do 1 Congresso da SLAN ” y el Volumen 20, Marzo 1970, incluye el Suplemento donde se da a conocer el informe de los Grupos Asesores sobre los temas discutidos en el Congreso. La presencia de Archivos Latinoamericanos de Nutrición como órgano divulgativo oficial de la SLAN, ha sido relevante en estos eventos científicos. A continuación un listado de los 17 Congresos de la SLAN realizados, quien lo presidió, ciudad, país y fecha. El Congreso XVIII está fijado para 2018 en México.
Congreso I . José E. Dutra de Oliveira. Caracas, Venezuela. Septiembre 1968
Congreso II . Fernando Monckeberg B. Viña del Mar, Chile. Diciembre 1970
]]> Congreso III . Antonio Bacigalupo. Guatemala, Guatemala. Septiembre 1972Congreso IV . Werner Jaffé. Caracas, Venezuela. Noviembre 1976
Congreso V . Hector Bourges. Puebla, México. Agosto 1980
Congreso VI . Juan Claudio Sanahuja. Buenos Aires, Argentina. Agosto 1982
Congreso VII . Alfredo Lam Sanchez. Brasilia, Brasil. Noviembre 1984
Congreso VIII . Sergio Valiente. Viña del Mar, Chile. Noviembre 1988
Congreso IX . Jaime Ariza Macía. San Juan, Puerto Rico. Septiembre 1991
Congreso X . Eleazar Lara Pantin. Caracas, Venezuela. Noviembre 1994
Congreso XI . Hernán Delgado. Guatemala, Guatemala. Noviembre 1997
Congreso XII . Alejandro O Donnell. Buenos Aires, Argentina. Noviembre 2000
]]> Congreso XIII . Adolfo Chávez V. Acapulco, México. Noviembre 2003Congreso XIV . Helio Vannuchi. Florianópolis, Brasil. Noviembre 2006
Congreso XV . Eduardo Atalah Samur. Santiago, Chile. Noviembre 2009
Congreso XVI . Manuel Hernández Triana. La Habana, Cuba. Noviembre 2012
Congreso XVII . María N. García-Casal. Punta Cana, R. Dominicana. Noviembre 2015
Al presente la edición de ALAN está en Caracas y su recorrido ejemplar en el Hemisferio Americano. “ ...debemos tener muy presente que su éxito como revista científica de reconocida responsabilidad y prestigio dependerá exclusivamente de los artículos originales de alta calidad y valor que aparezcan en sus páginas. Este es el reto que nosotros, los miembros de la SLAN, tenemos que aceptar si pretendemos que, con el correr del tiempo, nuestra revista llegue a ser algún día una de primer orden en su género, que es precisamente lo que nos proponemos. ” Tomado del Editorial, Volumen 16, Septiembre 1966, de Conrado F. Asenjo. Primera Directiva de la SLAN.
José Félix Chávez Pérez
Editor General 1997 - 2017
^rND^1A01^nBetty^sMéndez-Pérez^rND^1A01^nJoana^sMartín-Rojo^rND^1A01^nMaura^sVásquez^rND^1A01^nGuillermo^sRamírez^rND^1A01^nCoromoto^sMacías-Tomei^rND^1A01^nMercedes^sLópez-Blanco^rND^1A01^nBetty^sMéndez-Pérez^rND^1A01^nJoana^sMartín-Rojo^rND^1A01^nMaura^sVásquez^rND^1A01^nGuillermo^sRamírez^rND^1A01^nCoromoto^sMacías-Tomei^rND^1A01^nMercedes^sLópez-Blanco^rND^1A01^nBetty^sMéndez-Pérez^rND^1A01^nJoana^sMartín-Rojo^rND^1A01^nMaura^sVásquez^rND^1A01^nGuillermo^sRamírez^rND^1A01^nCoromoto^sMacías-Tomei^rND^1A01^nMercedes^sLópez-BlancoConcordancia entre los indices de masa corporal nacional e internacional, como predictores de la composición corporal en adolescentes premenárquicas y menárquicas
Betty Méndez-Pérez, Joana Martín-Rojo, Maura Vásquez, Guillermo Ramírez, Coromoto Macías-Tomei, Mercedes López-Blanco
Universidad Central de Venezuela. Universidad Simón Bolívar. Fundación Bengoa para la Alimentación y Nutrición. Caracas Venezuela
RESUMEN
El uso de referencias nacionales e internacionales para diagnosticar el estado nutricional es una discusión de larga data, debido a las discrepancias en los resultados. En este trabajo se contrastó la capacidad del índice de masa corporal (IMC) para predecir composición corporal, diagnosticada por área grasa (AG) y/o área muscular (AM), utilizando la referencia nacional (ENCDH) vs la internacional (OMS, 2007). Este estudio comparativo fue aplicado sobre una subpoblación de la base de datos de la Unidad de Bioantropología, Actividad Física y Salud, de 364 adolescentes femeninas, escolarizadas, entre 10 y 15 años, de distintas regiones venezolanas. Se calculó el coeficiente Kappa ponderado para medir la concordancia del IMC por ambas referencias, se determinó la precisión del IMC en cada caso, utilizando medidas de sensibilidad y especificidad. Se estimaron razones de verosimilitud diagnóstica para comparar el desempeño de ambos clasificadores de composición corporal. El índice Kappa ponderado mostró mayor concordancia en AG (0,64) que en AM (0,51). La presencia de la menarquia incrementó las concordancias: AG (0,63) y AM (0,59) con respecto a las pre-menárquicas: AG (0,46) y AM (0,35). Las razones de verosimilitud diagnóstica positivas y negativas resultaron consistentemente mayores que la unidad, tanto para la predicción de AM como AG, siendo siempre superiores en ENCDH que en OMS. Estos hallazgos muestran que en adolescentes pre-menárquicas la referencia ENCDH es más indicativa para el déficit y el exceso en área muscular, que la OMS, mientras que esta última es más indicativa del exceso en área grasa en adolescentes pre-menárquicas.
Palabras clave: Menarquia, composición corporal, concordancias, razones de verosimilitud, referencia nacional e internacional, Venezuela.
SUMMARY.
Concordance between national and international bodymass index as a predictor of body composition in premenarcheal and menarcheal adolescents. Use of national and international references for the diagnosis of nutritional status is controversial. Concordance between national and international body mass index as predictors of body composition in 364 premenarcheal and menarcheal female adolescents (ages 10-15), classified according to occurrence of menarche, that were part of the database of the bioanthropology, physical activity and health unit, were evaluated. This study compares the capacity of body mass index (BMI) to predict body composition, diagnosed by upper arm fat area (UFA) and/ or upper arm muscle area (UMA), using national reference (ENCDH) vs International (WHO, 2007). The weighted Kappa coefficient was applied to evaluate the concordance between BMI by national and international references, as well as to assess the precision of BMI by means of sensibility and specificity. Additionally, diagnostic verisimilitude ratio was estimated to measure the efficiency of both references in the classification of body composition. The weighted Kappa showed greater concordance in UFA (0.64) versus UMA (0.51). The presence of menarche increased the concordances: UFA (0.63) and UMA (0.59) with respect to premenarcheal girls: UFA (0.46) and UMA (0.35). The positive and negative diagnostic likelihood ratios were consistently greater than one, for fat and muscle area, especially when using ENCDH reference. The findings suggest that prevalence of deficit or excess in UMA was more sensitive with the BMI_ENCDH than with the BMI_WHO, in premenarcheal girls. On the other hand, WHO was more sensitive to predict UFA excess in the same group.
Key words: Menarche, body composition, weighted Kappa coefficient, diagnostic likelihood ratios, international and national growth references, Venezuela.
]]> Recibido: 29-07-2016 Aceptado: 24-11-2016INTRODUCCIÓN
La evaluación del estado nutricional y de la composición corporal, ésta última como elemento determinante del primero, es un objetivo prioritario en el campo de la epidemiología nutricional y la salud pública. Ambos indicadores son utilizados en la literatura especializada como una herramienta básica para evaluar el nivel primario de salud de la población.
Para los diagnósticos de sobrepeso, obesidad e insuficiencia ponderal en edades pediátricas, con grados de sensibilidad y especificidad muy satisfactorios utilizando exclusivamente la antropometría nutricional, se han propuesto diversos indicadores antropométricos que cuantifican la magnitud del tejido adiposo y muscular, con el objeto de identificar situaciones de riesgo o con propósitos de intervención. Entre los más utilizados, tanto en clínica como en estudios poblacionales,a pesar de su limitación en tanto que no identifica masa grasa y masa muscular de manera independiente (1), destaca el índice de masa corporal (IMC),considerado como el instrumento más común de medición en estudios epidemiológicos (2-4). El uso de este indicador en un comienzo estuvo restringido a la evaluación del adulto, pero en tiempos recientes ha sido igualmente recomendado para la valoración de niños y adolescentes (5, 6), ya que el IMC permite estimar los cambios de la adiposidad en la etapa del crecimiento, al presentar una alta tendencia a la canalización (7).
Sin embargo aún con la aceptación de su uso en edades pediátricas, varias investigaciones señalan la necesidad de que en este grupo y para efectos de diagnóstico, el IMC esté acompañado de otros indicadores de composición corporal como el área grasa (AG) y el área muscular (AM)(8,9), especialmente durante la pubertad, ya que durante este período del ciclo vital las diferencias son mayores debido al ritmo o tempo de maduración (10-12).
Aunque parece existir un consenso en la utilización de criterios internacionales para la evaluación del sobrepeso y la obesidad, tanto en niños como en adolescentes, su aplicación continúa siendo motivo de controversia, ante la variabilidad de resultados encontrados de acuerdo con la referencia utilizada (13), diferencias que no pueden ser atribuibles únicamente a la selección de los valores límite de cada referencia (P10 y P90 en la referencia nacional; P15 y P85 en la internacional), sobre todo en aquellos países que cuentan con valores de referencia nacionales que contemplan las particularidades propias de su composición corporal(14, 15).
Ante esta dicotomía, el objetivo de la presente investigación fue evaluar la capacidad del IMC para predecir composición corporal, diagnosticada por AG y por AM, utilizando la referencia nacional (16) en comparación con la referencia internacional (17),en adolescentes de sexo femenino clasificadas según presencia o no de la menarquia.
MATERIALES Y MÉTODOS
Esta investigación es de carácter comparativo y está enmarcada dentro de los objetivos contemplados en la Unidad de Investigación: Bioantropología, Actividad física y Salud (ubafs.ucv) del Instituto de Investigaciones Económicas y Sociales de la Universidad Central de Venezuela. Las participantes en este estudio constituyen una subpoblación de 364 adolescentes femeninas del banco de datos de la mencionada unidad con el siguiente criterio de inclusión: sexo femenino, aparentemente sanas, escolarizadas, con edades comprendidas entre los 10 y 15 años, residentes en zonas de Caracas y del estado Mérida (Venezuela), con registro de presencia/ausencia de la menarquia.
El banco de datos de la unidad contiene información antropométrica, socioeconómica, demográfica y cultural, de maduración somática, menarquia, actividad física y aptitud física, recabada en instituciones educativas provenientes de 5 estudios transversales realizados en varios estados de Venezuela entre los años 2011 al 2015, y con consentimiento informado, en adolescentes desde los 9 años hasta los 18 años de uno y otro sexo. Las investigaciones se llevaron a cabo de acuerdo con las normas deontológicas reconocidas por la declaración de Helsinski (18). En estos cinco estudios las variables antropométricas fueron recopiladas por antropometristas experimentados de acuerdo con los lineamientos de la Sociedad Internacional para el Avance de la Kinantropometría (19); de la siguiente manera: el peso corporal con el sujeto de pie en el centro de la balanza sin apoyo y distribuido equitativamente en ambos pies, empleándose una balanza electrónica portátil -PretitionTech- con gradación cercana a los 100 g. La talla máxima se apreció con un estadiómetro portátil marca Harpenden con escala métrica de 1mm de precisión; se consideró la distancia perpendicular entre los planos transversales entre los puntos del Vertex y el inferior de los pies. El pliegue de tríceps se apreció en la línea media de la cara posterior del brazo que se encuentra con la línea acromialeradiale media proyectada perpendicularmente al eje longitudinal del brazo, para ello se utilizó un calibrador Slim Guide con precisión de 0,5 mm y una presión de cierre constante de 10g/mm2.
]]> Las variables consideradas para este estudio fueron las siguientes: peso en kg (P), talla en metros (T), pliegue tríceps en mm (PlTr), circunferencia media del brazo en cm (CB), edad en años (E) y presencia o no de la menarquia. Con esta información se calcularon los indicadores: índice de masa corporal (IMC), área grasa (AG) y área muscular (AM), mediante las siguientes fórmulas IMC (20); AG y AM (21): Para cada uno de estos tres índices se aplicó un criterio de clasificación en tres categorías (déficit, normal y exceso) utilizando valores de referencia nacionale internacional. Para el caso nacional se usaron las tablas del ENCDH (16). En este sentido se utilizó la siguiente regla basada en los percentiles correspondientes: déficit: <P10, normal: ≥P10 y ≤P90, y exceso: >P90 (22). Para la referencia internacional se utilizaron los nuevos estándares de la OMS para niños y adolescentes entre 5-19 años de edad (17). En este caso la clasificación se sustenta en el siguiente criterio: déficit: <P15, normal: ≥P15 y ≤ P85, y exceso: >P85. La presencia o no de la menarquia derivó dos grupos de adolescentes para el análisis: premenárquicas y menárquicas (23).MÉTODOS ESTADÍSTICOS
Los procedimientos estadísticos utilizados para comparar el desempeño del IMC como predictor tanto de AG como de AM, según las dos referencias (ENCDH y OMS), consistieron en establecer mediciones de los siguientes cuatro aspectos:
a) Concordancia entre ambas referencias, evaluada en el grupo de niñas con composición corporal normal (según los indicadores AG o AM) y clasificadas de acuerdo con la presencia o ausencia de la menarquia. Para estos efectos se utilizó el coeficiente Kappa-wponderado, pro- puesto por Fleiss y Cohen (24), y definido como: Kappaw = siendo  una medida global del acuerdo entre las dos reglas, determinada como la suma ponderada de las probabilidades estimadas de que el IMC por la primera y segunda referencias clasifiquen simultáneamente a una adolescente en las categorías i y j respectivamente, y
  una medida global del acuerdo esperado entre las dos reglas, bajo el supuesto de independencia. Para efectos de interpretación se ha convenido en asumir el siguiente criterio para la concordancia: pobre (0,0-0,2), débil (0,2-0,4), moderada (0,4-0,6), buena (0,6-0,8) y muy buena (0,8 -1,0).
b)Precisión del IMC según cada una de las reglas, para clasificar una adolescente en la condición de déficit o de exceso, según su composición corporal, en forma separada para AG y AM. Las medidas de precisión utilizadas fueron la sensibilidad (fracción de verdaderos positivos: FVP) y la especificidad (fracción de verdaderos negativos: FVN), determinándose además las correspondientes fracciones de error: fracción de falsos negativos (FFN) y fracción de falsos positivos (FFP).
c)La capacidad de cada regla para predecir la composición corporal (AG y AM) por déficit o por exceso, evaluada mediante razones de verosimilitud diagnósticas, distinguiéndose además las adolescentes según presencia o no de la menarquia. Las razones de verosimilitud diagnóstica positivas (25) quedan definidas mediante el cociente: DLR+ =cuyos valores mayores que la unidad constituyen un indicativo de que una persona clasificada con déficit o exceso, es más probable que presente esta condición a que no la tenga. También se calcularon razones de verosimilitud diagnósticas negativas definidas en la forma DLR-=, cociente cuyos valores menores que la unidad indican que una persona clasificada como normal, es más probable que realmente lo sea a que presente déficit/exceso.
d) Comparación de la capacidad diagnóstica de ambas reglas. Con este fin se calcularon las razones de verosimilitud diagnósticas relativas, definidas de la siguiente manera: rDLR+ ( IMC_ENCDH, IMC_OMS) = donde sirDLR+>1, entonces una persona clasificada con défict/exceso según IMC_ENCDHes más indicativo que según IMC_OMS, lo que da mayor certeza en la clasificación obtenida por la primera regla, y: rDLR-( IMC_ENCDH, IMC_OMS) = donde sirDLR<1, entonces una persona clasificada como normal según IMC_ENCDHes más indicativo que según IMC_OMS (25).
RESULTADOS
La evaluación de la composición corporal para la gran mayoría de las participantes en el estudio, permitió clasificarlas como normales, tanto en lo que respecta a reservas calóricas medidas por AG (87%), como a las reservas proteicas medidas por AM (74,5%). Asimismo, el IMC correspondiente a un alto porcentaje de estas adolescentes estuvo en la normalidad para la referencia nacional (80%), observándose sin embargo una importante disminución para la referencia foránea (67%) (Figura1). En general, las magnitudes observadas del coeficiente Kappa ponderado en los distintos grupos bajo estudio, indicaron un nivel de moderado a bueno en la concordancia entre los clasificadores IMC_ENCDH e IMC_OMS (Figura 2). Debe destacarse sin embargo, el caso de adolescentes premenárquicas con composición corporal normal según área muscular, en las que la concordancia registrada resulto más bien débil (0,37). Adicionalmente, resalta el hecho de que este coeficiente sea moderadamente más elevado en las adolescentes con composición corporal normal según área grasa, en comparación con las normales de acuerdo al área muscular, independientemente de la ocurrencia de la menarquia.
En la Tabla 1 se muestra que la sensibilidad del IMC_ENCDH para clasificar correctamente el déficit en AG fue relativamente baja, siendo menor en las post-menárquicas (0,43) que en las premenárquicas (0,56). Por consiguiente, las fracciones de error al clasificar un déficit como normal fueron muy altas: 57% en las menárquicas y 44% en premenárquicas. Cabe resaltar además que comparativamente esta referencia tiene un mejor desempeño en la predicción del exceso que del déficit, tanto en pre como en post-menárquicas. Por su parte, la precisión del IMC_OMS para clasificar correctamente tanto el déficit (sensibilidad: 0,57 a 0,67) como el exceso (sensibilidad: 0,84 a 0,92), fue muy superior a la de la referencia nacional, independientemente de la ocurrencia de la menarquía, mostrando también un mejor desempeño para la predicción del exceso. Se encontró en general que la referencia nacional fue más específica que sensible tanto para el déficit como para el exceso, lo que hizo que las fracciones de error resultaran pequeñas en la clasificación de adolescentes normales. Un comportamiento similar se observó para la referencia foránea, solamente en el caso de déficit.
]]>
FIGURA 1. Distribución porcentual de las adolescentes según categorías de los indicadores de composición corporal y nutricional.


En la predicción del área muscular, las dos referencias diagnósticas evidenciaron un comportamiento análogo al del área grasa (Tabla 2). En todas las situaciones bajo estudio, el IMC_OMS siempre fue más sensible que IMC_ENCDH. Con respecto al mejor desempeño de las dos referencias para la predicción del exceso, en relación a la correspondiente al déficit, esto solamente se observó en las adolescentes premenárquicas. En cuanto a la especificidad, el IMC_ENCDHsiempre resultómás específico que sensible, condición que en la referencia foránea solo fue evidente para el déficit.
Las verosimilitudes diagnósticas positivas (DLR+) obtenidas para ambas referencias fueron todas mayores que la unidad (3,60 a 34,67) (Tabla 3). Estos resultados constituyen un indicativo de que un diagnóstico de composición corporal de acuerdo al AM o AG en las dos categorías de déficit o exceso basado en el IMC, resultó al menos tres veces más probable que proviniera de una adolescente con una alteración real, que de una normal. Este hallazgo se evidenció con mayor intensidad para el IMC_ENCDH como predictor del área muscular en premenárquicas, tanto para el déficit como para el exceso. Por su parte, las verosimilitudes diagnósticas negativas (DLR-) según las dos referencias, resultaron todas menores que la unidad (0,09-0,61).
]]> Esto significa que en el caso de diagnosticar una adolescente como normal es más probable que su composición corporal (AM o AG) sea normal a que no lo sea (Tabla 4). En este sentido destaca en importancia el caso de IMC_OMS como predictor del área grasa en las adolescentespremenárquicas para la categoría diagnóstica de exceso, es decir, si una persona ha sido clasificada como normal por IMC_OMS, sería poco probable que su condición diagnóstica estuviera en la categoría de exceso.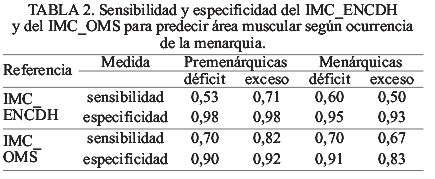


Las Figuras 3 y 4 permiten señalar que para predecir alteraciones de la composición corporal por déficit o por exceso mediante el IMC en las adolescentes menárquicas, resultó indistinto recurrir a la referencia nacional o a la foránea ya que los valores no difieren sustantivamente de la unidad. Sin embargo, en el caso de adolescentes premenárquicas, se encontró que la referencia nacional era más indicativa que la foránea, tanto en el diagnóstico del déficit según área muscular [rDLR + (ENCDH,OMS) =4,83] como del exceso [rDLR+(ENCDH,OMS)=3,09]. Mención aparte merece el caso de predicción de normalidad según área grasa, en el cual la referencia foránea tuvo un mejor desempeño que la nacional [rDLR-(ENCDH,OMS)= 2,82].


DISCUSIÓN
A nivel mundial se han llevado a cabo diversas reuniones de expertos para consensuar distintos criterios técnicos y metodológicos, en torno al uso e interpretación de los indicadores antropométricos en la investigación científica y en la definición de políticas de salud de niños y adolescentes, relacionadas con el estado nutricional de este grupo poblacional. Esta tarea es de particular importancia cuando la acción está dirigida a la identificación de grupos de riesgo o evaluar los resultados de programas de salud.
En este artículo se analizaron las diferencias y/o similitudes en el comportamiento del IMC por las referencias nacional e internacional para predecir el estado nutricional antropométrico de un grupo de adolescentes, evaluado en términos de su composición corporal con base en los componentes de área grasa y área muscular, utilizando los valores límite recomendados para cada caso. Adicionalmente, se consideró la presencia o ausencia de la menarquia como un factor importante para evaluar los resultados de la predicción.
Los primeros hallazgos revelaron diferencias en la identificación de adolescentes normales utilizando el IMC por una u otra referencia, encontrándose que la referencia internacional reportó una menor prevalencia en lo que corresponde al estado nutricional normal.
En general el nivel de concordancia observado entre las referencias diagnósticas osciló entre moderado y bueno, con una excepción en el grupo de premenárquicas con área muscular normal, en las que el comportamiento de las reglas es discordante. Este hallazgo debe llamar la atención ya que en una investigación realizada en una muestra longitudinal de Caracas, se encontró que a diferencia del área grasa, el componente muscular por su parte presentaba diferencias según el ritmo o tempo de maduración (26).Una explicación parcial de este último hecho estriba en que el IMC por la referencia nacional es más específico que sensible tanto para la predicción de área grasa como de área muscular, y en consecuencia induce un menor riesgo de error en la clasificación de niños normales. Por el contrario, en general el IMC foráneo es más sensible que específico, lo que conlleva a un menor riesgo de error en la clasificación de la malnutrición en general. Este comportamiento de las reglas queda manifiesto también en las razones de verosimilitud diagnósticas positivas, siempre mayores en ENCDH que en OMS. Estas comparaciones, que seresumen en las razones de verosimilitud relativas, llevan a concluir que en las adolescentespremenárquicas la referencia ENCDH es más indicativa de déficit/exceso en área muscular que la OMS,mientras que esta última es más indicativa del exceso en área grasa en adolescentes premenárquicas.
La comparación de las referencias diagnósticas ENCDH y OMS realizadas en este estudio, pueden permitir ser de utilidad en la toma de decisiones más eficientes en la focalización e intervención de esta problemática dirigida a la población adolescente. Esta eficiencia se traduce en la escogencia de la referencia diagnóstica apropiada, ya que una clasifica mejor a los normales y la otra mejor a la malnutrición. Además se encontró que la referencia nacional es más indicativa que la foránea para la reserva proteica en el grupo de adolescentes premenárquicas.
Aun cuando para este trabajo no se evaluaron los caracteres sexuales secundarios (glándulas mamarias y vello pubiano), algunas de las adolescentes clasificadas como premenárquicas podrían mostrar un comportamiento similar al encontrado en las menárquicas; puesto que la menarquia es un evento relativamente tardío dentro del periodo puberal.Estas diferencias son consistentes con otros estudios reportados por la OMS, en los cuales la estimación de las prevalencias de sobrepeso y obesidad están influenciadas por la selección de la población, ya que éstas tienden a pertenecer a muestras de niños y adolescentes eutróficos, es decir personas con un estado nutricional evaluado por antropometría, dentro de los parámetros considerados normales (27).
Las diferencias encontradas derivadas del evento de la menarquia en este grupo de estudio, revela la importancia de la selección en el uso del estándar nacional o internacional, el cual debe ser tomado en consideración para valorar el grado de déficit o exceso nutricional. Se ha llegado a conclusiones similares en estudios realizados en poblaciones belgas, norteamericanas y venezolanas, basados en los diferentes grados de maduración, los cuales inciden en modificaciones de la composición corporal que alteran a su vez, la valoración del estado nutricional (28-31). Por otra parte, queda demostrado que los niveles de concordancia del IMC varían de acuerdo al componente objeto del análisis, ya sea que se refiera al graso o muscular, encontrándose coincidencias más relevantes cuando se trata del primero.
]]> Estos resultados vendrían a fortalecer la propuesta de Atalah y colaboradores (32), en cuanto a la necesidad de retomar mesas de trabajo para dilucidar el tema del uso de referencias locales versus internacionales, ya que las diferencias encontradas así lo justifican.CONCLUSIONES
Los hallazgos obtenidos en esta investigación permiten concluir que en adolescentes con composición corporal normal según AG, se observaron niveles de concordancia entre ambas referencias, similares para los dos grupos. En las adolescentes con composición corporal normal según el AM, se observó mayor concordancia entre ambas referencias en las menárquicas que en laspremenárquicas. La predicción tanto del déficit como del exceso es más confiable con la referencia ENCDH que con la OMS, con resultados más relevantes en las adolescentes premenárquicas; sin embargo, es oportuno mencionar, que la referencia nacional resultó menos convincente que el de la referencia OMS como predictor de la condición de normalidad. En general, el IMC_OMS es levemente menos específico que el IMC_ENCDH.
AGRADECIMIENTOS
Los autores dejan constancia de su agradecimiento al Consejo de Desarrollo Científico y Humanístico de la Universidad Central de Venezuela, institución que mediante el financiamiento de varios proyectos de investigación, ha permitido la construcción de una base de datos en el área de la biología humana.
REFERENCIAS
1. Bergman RN, Stefanoski D, Buchanan TA, Summer AE, Reynolds JC, Sebringn, et al. A better index of body adiposity. Obesity 2011; 19(5):1083-1089. [ Links ]
2. zimmermann MB, Gübeli C, Püntener C, Molinari L. Detection of overweight and obesity in a national sample of 6–12-y-old Swiss children: accuracy and validity of reference values for body mass index from the US Centers for Disease Control and Prevention and the International Obesity Task Force 1, 2, 3. Am J Clin Nutr 2004; 79(5): 838-843. [ Links ]
]]>3. Cole TJ, Flegal KM, Nicholls D, Jackson AA. Body mass index cut offs to define thickness in children and adolescents: international survey. BMJ 2007; 335(7612): 194-201. [ Links ]
4. Pérez BM, Landaeta-Jiménez M, Amador J, Vásquez M, Marrodán MD. Sensibilidad y especificidad de indicadores antropométricos de adiposidad y distribución de grasa en niños y adolescentes venezolanos. Interciencia 2009; 34(2): 84-90. [ Links ]
5. Malina RM, Katzmarzyk PT. Validity of the Body Mass Index as an indicator of the risk and presence of overweight in adolescents. Am J Clin Nutr 1999; 70(Suppl.2): S131-S136. [ Links ]
6. Centers for Disease Control and Prevention. About Child&Teen BMI. Disponible en: http://www.cdc.gov/healthyweight/assessing/bmi/childrens_bmi/about_childrens_bmi.html [Consultado: 20 de febrero de 2015].
7. Inocuchi M, Matsudo N, Takayama H, Hasegawa T. BMI z score is the optimal measure of annual adiposity change in elementary school children. An Hum Biol 2011; 38(6): 747-751. [ Links ]
8. Marrodán MD, Pérez BM, Morales E, Santos-Beneit G, Cabañas MD. Contraste y concordancia entre ecuaciones de composición corporal en edad pediátrica: aplicación en población española y venezolana Nutr Clin Diet Hosp 2009; 29(3): 4-11. [ Links ]
9. Fariñas Rodríguez L, Vázquez Sánchez V, Martínez Fuentes AJ. índice de Masa Corporal y composición del brazo en niños cubanos.Rev Cubana Invest Biomed 2014; 33(4):374-380. [ Links ]
10. Eveleth P. Valores de referencia. En: M López-Blanco, Y Hernández-Valera , B Torún, L Fajardo (eds.). Taller sobre Evaluación Nutricional Antropométrica en América Latina. Ediciones CAVENDES. Caracas 1995; pp.13-19. [ Links ]
11. López-Blanco M, Espinoza I, Macías-Tomei C, BlancoCedres I. Maduración Temprana. Factor de riesgo de sobrepeso y obesidad durante la pubertad?. Arch Latinoam Nutr 1999,49(1):13-19 [ Links ]
12. Macías-Tomei C, López-Blanco M, Blanco-Cedres L, Vásquez- Ramírez M. Patterns of body mass and muscular components in children and adolescents of Caracas. Acta Med Auxol 2001; 33(3):139-144. [ Links ]
13. Kain J, Uauay R, Vio F, Albalá C. Trends in overweight and obesity prevalence in Chilean children: Comparison of three definitions. Eur J Clin Nutr 2002; 56(3): 200204. [ Links ]
]]>14. Júliusson PB, Roelants M, Hoppinbrowers K, Hauspie R, Bjerknes R. Growth of Belgian and Norwegian children compared to WHO growth standards: prevalence below -2 and above +2SD and the effect of breastfeeding. Arch Dis Child 2011; 96(10): 916-921. [ Links ]
15. Milani S, Buckler JMH; Keinar CJH, Benso L, Gilli G, Nicoletti I, et al. The use of local reference growth charts for clinical use or universal standard: a balanced appraisal. J. Endocrinol Invest 2012; 35(2): 224-226. [ Links ]
16. Méndez Castellano H. Estudio Nacional de Crecimiento y Desarrollo Humanos de la República de Venezuela. Proyecto Venezuela. H. Méndez Castellano (editor). Escuela Técnica Popular Don Bosco. Tomo II. Caracas 1996; 846 p. [ Links ]
17. World Health Organization. Growth Reference Data for Children from 5 to 19 Years, Geneva 2007. Disponibleen: www.who.int/growthref/en / . [Consultadofebrero 2015].
18. World Medical Association. Declaration of Helsinki – Ethical Principles for Medical Research Involving Human Subjects. 64th WMA General Assembly. Fortaleza, Brazil 2013. [Consultadofebrero 2015].
19. Protocolo Internacional para la Valoración Antropométrica.A. Stewart, M.Marfell-Jones, T. Olds, H. de Ridder (Editores). Publicado por ISAK. Biblioteca Nacional de Australia 2011; 112 p. [ Links ]
]]>20. Keys A, Fidanza F, Karvonen MJ, Kimura N, Taylor HL.Indices of relative weight and obesity.J ChronDisease1972; 25(6-7): 329-343 [ Links ]
21. Gurney JM, Jelliffe DB. Arm anthropometry in nutritional assessment: nomogram for rapid calculation of muscle circumference and cross-sectional muscle and fat areas. Am J Clin Nutr 1973; 26(9): 912-915 [ Links ]
22. Landaeta-Jiménez M, López-Blanco M, Méndez Castellano H. Arm muscle and arm fat areas: reference values for children and adolescents. Project Venezuela. Auxology 94 Humanbiol Budapest. 25: 555-561, 1994.
23. Macías de Tomei C. Evaluación de la maduración Sexual. En: M. López, I. Izaguirre, C. Macías (editoras). Crecimiento y MaduraciónFísica. Editorial MédicaPanamericana. Caracas 2013, pp. 153-161.
24. Fleiss JL, Cohen J. The equivalence of weighted kappa and the intraclass correlation coefficient as measures of reliability. EducPsycholMeas1973; 33(3): 613-619. [ Links ]
25. Pepe MS. The Statistical Evaluation of Medical Tests for Classification and Prediction. Oxford University Press. Oxford Statistical Science Series. Oxford University Press; Oxford, UK 2003. Pp. 302.
26. López de Blanco M, de Espinoza I, Macías de Tomei C, Blanco de Cedres L. Maduración temprana: factor de riesgo de sobrepeso y obesidad durante la pubertad? Arch Latinoam Nutr1999; 49(1): 13-19. [ Links ]
27. Gonzalez-Gonzalez I, Casanova I, Sarmiento OL, Gazmararian JA, Cunningham SA, Martorell R, et al. Comparing three body mass index classification systems to assess overweight and obesity in children and adolescents. Rev PanamSaludPublica2013; 33(5): 349–355. [ Links ]
28. Malina R. Body Mass Index In: Measuring Progress in Obesity Prevention. Workshop Report. Institute of Medicine. Committee on Accelerating Progress in Obesity Prevention Food and Nutrition Board. The National Academics Press. Washington, DC 2012, pp: 42-48. [ Links ]
29. Guo SS, Roche A F, Chumlea WC, Gardner JD, Siervogel RM. The predictive value of childhood body mass index values for overweight at age 35 y. Am J Clinical Nutr 1994; 59(4):810-819. [ Links ]
30. Rolland-Cachera MF, Cole TJ, Sempe M, Tichet J, Rossignol C,Charraud A. Body mass index variations: Centiles from birth to 87 years. Europ J Clin Nutr 1991; 45(1):13-21. [ Links ]
31. Macías-Tomei C, López-Blanco M, Vásquez M, Méndez-Pérez B, Ramírez G. Capacidad predictiva del índice de masa corporal por tres referencias versus diagnóstico integral en prepúberes y púberes venezolanos. Arch Venez Puer Pediatr 2012; 75(2):38-44. [ Links ]
32. Atalah E, Loaiza S, Taibo M. Estado Nutricional en escolares chilenos según la referencia NCHS y OMS. Nutr Hosp 2012; 27 (1):1-6. [ Links ]
Recibido: 29-07-2016
Aceptado: 24-11-2016
^rND^sBergman^nRN^rND^sStefanoski^nD^rND^sBuchanan^nTA^rND^sSummer^nAE^rND^sReynolds^nJC^rND^sSebringn,^net al^rND^sZimmermann^nMB^rND^sGübeli^nC^rND^sPüntener^nC^rND^sMolinari^nL^rND^sCole^nTJ^rND^sFlegal^nKM^rND^sNicholls^nD^rND^sJackson^nAA^rND^sJiménez^nM^rND^sAmador^nJ^rND^sVásquez^nM^rND^sMarrodán^nMD^rND^sMalina^nRM^rND^sKatzmarzyk^nPT^rND^sInocuchi^nM^rND^sMatsudo^nN^rND^sTakayama^nH^rND^sHasegawa^nT^rND^sMarrodán^nMD^rND^sPérez^nBM^rND^sMorales^nE^rND^sSantos-Beneit^nG^rND^sCabañas^nMD^rND^sFariñas-Rodríguez^nL^rND^sVázquez-Sánchez^nV^rND^sMartínez-Fuentes^nAJ^rND^sEveleth^nP^rND^sLópez-Blanco^nM^rND^sEspinoza^nI^rND^sMacías-Tomei^nC^rND^sBlanco-Cedres^nI^rND^sMacías-Tomei^nC^rND^sLópez-Blanco^nM^rND^sBlanco-Cedres^nL^rND^sVásquez-Ramírez^nM^rND^sKain^nJ^rND^sUauay^nR^rND^sVio^nF^rND^sAlbalá^nC^rND^sJúliusson^nPB^rND^sRoelants^nM^rND^sHoppinbrowers^nK^rND^sHauspie^nR^rND^sBjerknes^nR^rND^sMilani^nS^rND^sBuckler^nJMH; Keinar CJH^rND^sBenso^nL^rND^sGilli^nG^rND^sNicoletti^nI^rND^sMéndez-Castellano^nH^rND^sKeys^nA^rND^sFidanza^nF^rND^sKarvonen^nMJ^rND^sKimura^nN^rND^sTaylor^nHL^rND^sGurney^nJM^rND^sJelliffe^nDB^rND^sLandaeta-Jiménez^nM^rND^sLópez-Blanco^nM^rND^sMéndez^nCastellano H^rND^sMacías de Tomei^nC^rND^sFleiss^nJL^rND^sCohen^nJ^rND^sLópez^nde Blanco M^rND^sde^nEspinoza I^rND^sMacías^nde Tomei C^rND^sBlanco^nde Cedres L^rND^sGonzalez-Gonzalez^nI^rND^sCasanova^nI^rND^sSarmiento^nOL^rND^sGazmararian^nJA^rND^sCunningham^nSA^rND^sMartorell^nR^rND^set^nal^rND^sMalina^nR^rND^sGuo^nSS^rND^sRoche^nA F^rND^sChumlea^nWC^rND^sGardner^nJD^rND^sSiervogel^nRM^rND^sRolland-Cachera^nMF^rND^sCole^nTJ^rND^sSempe^nM^rND^sTichet^nJ^rND^sRossignol^nC^rND^sCharraud^nA^rND^sMacías-Tomei^nC^rND^sLópez-Blanco^nM^rND^sVásquez^nM^rND^sMéndez-Pérez^nB^rND^sRamírez^nG^rND^sAtalah^nE^rND^sLoaiza^nS^rND^sTaibo^nM^rND^1A01^nGuillermo^sDoménech Asensi^rND^1A01^nAlba Manuela^sDurango Villadiego^rND^1A01^nGaspar^sRos Berruezo^rND^1A01^nGuillermo^sDoménech Asensi^rND^1A01^nAlba Manuela^sDurango Villadiego^rND^1A01^nGaspar^sRos Berruezo^rND^1A01^nGuillermo^sDoménech Asensi^rND^1A01^nAlba Manuela^sDurango Villadiego^rND^1A01^nGaspar^sRos Berruezo
Moringa oleifera: Revisión sobre aplicaciones y usos en alimentos
Guillermo Doménech Asensi, Alba Manuela Durango Villadiego y Gaspar Ros Berruezo
Universidad de Murcia, España. Universidad de Córdoba, Colombia.
RESUMEN
La Moringa oleifera es un árbol originario de de terminadas regiones Asia y África, con capacidad de adaptación a territorios de climas calurosos y pluviometrías escasas. Las diferentes estructuras de la planta (hoja, raíz, corteza, flores, vainas...) se consumen como terapéutico para diferentes dolencias. Estas estructuras posee un elevado poder nutritivo (vitaminas, minerales o aminoácidos esenciales entre otros) que le otorgan un importante papel potencial en la prevención y lucha de la desnutrición. La literatura científica recoge numerosos efectos saludables de las diferentes partes de la moringa tales como efecto antioxidante y antiinflamatorio o bactericida entre otros. Con el objetivo de hacer llegar las pro piedades de la moringa al consumidor se están desarrollando estudios con diferentes alimentos, principalmente productos cárnicos y panes, en los que se incorpora la moringa (hoja, se milla, extractos, etc.) como ingrediente. En los productos cárnicos se utiliza como aditivo conservante y antioxidante con muy buenos resultados sin afectar las características sensoriales del producto final. En el sector de la panadería el objetivo suele ser el enriquecimiento nutricional del alimento. En estos casos las características sensoriales son más variables dependiendo de la dosis utilizada y el producto en estudio (pan, galletas, etc.). La industria alimentaria tiene un interesante reto por delante: la incorporación de la moringa como ingrediente, sustituyendo diferentes conservantes y antioxidantes químicos por otros naturales y al mismo tiempo la preparación de productos básicos, como el pan, altamente nutritivos, ideales para determinados grupos poblacionales en mayor riesgo de desnutrición.
Palabras clave: Moringa oleifera , antioxidante, alimentos, productos cárnicos, pan
SUMMARY.
Moringa oleifera : A review of food ap plications
]]> Moringa oleifera is a tree native to certain re gions Asia and Africa, adaptable to territories of hot weather and low precipitation rates. In some areas diffe rent parts of the tree (leaves, roots, bark, flowers, pods...) are consumed as a therapeutic for different illnesses. These structures have also a high nutritional value (vita mins, minerals and essential amino acids among others) giving an important potential role in the prevention of malnutrition. The scientific literature describes many sa lutary effects of the different parts of the moringa such as an antioxidant and anti-inflammatory or bactericide, among others. With the aim of bringing the properties of moringa to consumers, a few studies have been developed with different foods, mainly meat and bread, in which the moringa is incorporated as an ingredient (leaf, seed, ex tracts, etc). In meat products it is used as a preservative and antioxidant additive with very good results without affecting the sensory characteristics of the final product. In the field of bakery the objective is usually as nutritional fortification. In these cases the sensory characteristics are variable depending on the dose used and the product under study (bread, cookies, etc). The food industry has an inte resting challenge ahead: the incorporation of moringa as a natural ingredient, as a substituting different classical preservatives and antioxidant and at the same time prepa ring food commodities, such as bread, with high nutritio nal value, ideal for certain population groups in risk of malnutrition.Key words: Moringa oleifera , antioxidant, food, meat products, bread
INTRODUCCIÓN
La Moringa oleifera es un árbol caducifolio, de crecimiento rápido, con raíces tuberosas y gruesas, hoja verde claro, de floración abundante, con frutos en cápsulas alar gadas y colgantes y que contienen semillas oscuras. Se asocia a zonas tropicales y subtropicales, bastante resistente a la sequía, con una temperatura de crecimiento ideal de 25-35ºC, aunque puede tolerar hasta los 48ºC (1). Recibe diferentes nombres, tales como Drums tick tree, Horse Radish tree o Ben oil tree (2). Es originario de la India, Pakistán, Asia Menor, Arabia y África pero se ha extendido hacia otras regiones como Filipinas, todo el continente americano y Caribe (3). En muchas de estas zonas el consumo de la moringa (hojas, frutos, vaina, flores o raíz) está arraigado en la cultura popular debido a las propiedades curativas que se le atribuyen para el tratamiento de diferentes afecciones, por lo que también se la denomina “árbol milagro” y se utiliza habitualmente como remedio natural para gran diversidad de afecciones como las fiebres de la malaria o fiebres tifoideas, otitis, infecciones oculares, hiperglucemia, hipertensión, parasitosis intestinales, anemias o dermatitis entre otras. En Nigeria la forma más habitual de consumo es de hojas troceadas en sopa, en infusión, en ensalada, como especia o consumidas crudas como tentempié (4). Los motivos para esta gran variedad de funciones pueden ser debido a su alto poder nutritivo. Se describe que “onza por onza, las hojas de moringa contienen más vitamina A que las zanahorias, más calcio que la leche, más hierro que las espinacas, más vitamina C que las naranjas, y más potasio que los plátanos” (5). Por otro lado la comunidad científica describe en los últimos años el mecanismo de acción en muchas de estas propiedades curativas, en multitud de estudios con diferentes partes de la estructura de la moringa y con diferentes diseños metodológicos, tanto in vivo como in vitro (3, 6). En ellos se describe los efectos potenciales para la salud de las diferentes partes del árbol, actividad antihipertensiva, diurética, hipocolesterolemiante, antiulcerosa, hepatoprotectora, antitumoral, antibacteriana y antifúngica entre otras, así como propiedades de purificación de aguas. Stohs y Hartman (2) recopilan los trabajos realizados en torno a la seguridad alimentaria respecto al consumo de diferentes partes del árbol o sus extractos, posibles efectos tóxicos y eficacia con estudios en humanos, en animales de laboratorio y en cultivos celulares, concluyendo con la existencia de un amplio margen de seguridad. La finalidad de este trabajo es recopilar los trabajos más actuales en aquellas facetas más importantes de la moringa y su uso como ingrediente alimentario, donde se estudian las propiedades sobre el alimento y las repercusiones sobre la calidad sensorial de los alimentos diseñados.
Propiedades biológicas de la planta Moringa oleifera
En los últimos años han proliferado los estudios relativos a las distintas actividades de los compuestos presentes en diferentes partes de la Moringa oleifera. La Tabla 1 recoge los estudios más recientes que demuestran las actividades biológicas de los compuestos de la Moringa oleifera. La Tabla 1 recoge los estudios más recientes que demuestran las actividades biológicas de los compuestos de la moringa en el organismo.

Estudios in vivo de actividad antiinflamatorio y antioxidante
Los efectos antiinflamatorios se deben principlamente a la gran cantidad de flavonoides presentes en la hoja de moringa, donde se han descrito hasta doce compuestos distintos, derivados de la quercitina y kaempferol (7).
]]> Minaiyan et al (8) investigaron la actividad antiinflamatoria del extracto semillas de moringa en el tratamiento de colitis ulcerosa inducida. Los autores determinaron el grado de las lesiones mediante análisis macroscópico valorando el aspecto visual, peso del colon distal y la extensión de las úlceras. También estudiaron el daño microscópico determinando la severidad y extensión de la inflamación y el daño de las criptas. El estudio se llevó a cabo con 54 ratas Wistar macho de entre 180-260 g de peso divididas en nueve grupos. Al grupo 1 (referencia) se le suministró suero salino (1ml/kg) de tratamiento placebo y no recibió inducción de colitis. Al grupo 2 (control) se le indujo la colitis (2ml de solución de acético 4% vía intracolónica) y se le suministro solución salina de tratamiento. El grupo 3 (de referencia) recibió la inducción y tratamiento farmacológico (prednisolona). Los grupos 4, 5 y 6 recibieron inducción y tratamiento con fracción hidroalcohólica del extracto de semilla de moringa a concentraciones de 50, 100 y 200 mg/kg respectivamente. Los grupos 7, 8 y 9 recibieron la inducción y el tratamiento con la fracción cloroformo del extracto a las dosis de 50, 100 y 200 mg/kg respectivamente. El tiempo de ensayo fue de cinco días. Tras el análisis de los resultados los investigadores observaron que el extracto hidroalcohólico fue el tratamiento más eficaz mostrando diferencias estadísticamente significativas (p<0.01) en los parámetros indicadores de inflamación de los grupos tratados con el extracto a 100 y 200 mg/kg respecto al grupo control. Los autores concluyen que el extracto de semilla de moringa reduce los índices de las lesiones tanto a nivel macroscópico como microscópico, mostrándose como un antiinflamatorio eficaz en el tratamiento de la colitis ulcerosa.Das et al (9) evaluaron la actividad antioxidante del extracto etanol de hoja de moringa en el tratamiento de la esteatosis hepática no alcohólica inducida mediante dieta rica en grasa. El extracto se obtuvo a concentración de 5 mg/l y se establecieron cinco grupos de ensayo (seis ratones albino suizo macho de 20 g aprox. por grupo) combinando dieta normal y dieta grasa, con y sin suplementos del extracto y diferenciando el posible efecto terapéutico o preventivo, con una duración del ensayo de 15 días. El grupo 1 (control) recibió un dieta estándar, grupo 2 recibió dieta estándar y suplemento de 150 mg/kg del extracto vía esofágica, grupo 3 con dieta grasa, grupo 4 con dieta grasa durante 15 días y tratamiento con extracto los últimos cinco días (se evalúa el efecto terapéutico), y grupo 5 con dieta grasa y extracto simultáneamente durante 15 días (evalúa el efecto preventivo). Los indicadores para medir la alteración hepática fueron el análisis histológico y los niveles séricos de enzimas hepáticas. Los resultados mostraron una disminución de los marcadores de daño hepático y de los signos histológicos en los grupos 4 y 5 (tratamiento terapéutico y preventivo) respecto al grupo 3 (dieta grasa), en ambos casos con diferencias estadísticamente significativas (p<0.05). En base a estos resultados los autores concluyen que el extracto de hoja de moringa tiene efecto preventivo y terapéutico de la esteatosis hepática no alcohólica provocada por una dieta rica en grasas.
Tumer et al (10) estudiaron el mecanismo por el cual las hojas de moringa ejercen su función antioxidante. Se realizó un estudio in vitro con líneas celulares hepáticas Hepa 1c1c7 de ratón. El extracto de las hojas se separó en dos fases, una rica en polifenoles y otra en isotiocianatos. Para evaluar la acción antioxidante se diferenció entre una actividad indirecta (actividad de la NAD(P)H quinona oxidorreductasa1-NAQO1) y una actividad directa (capacidad de absorción de radicales de oxigeno-ORAC). Tras la adición del extracto y evaluación del mismo los autores observaron que la en fracción rica en polifenoles hubo una mayor actividad de la NAQO1 mientras que la fracción rica en isotiocianatos produjo mayor absorción de radicales de oxígeno. De esta manera los autores explican que la actividad antioxidante de la hoja de moringa y su potencial terapéutico se debe, en parte, a la doble forma de actuación descrita.
Vasanth et al (11) valoraron in vitro la actividad antiinflamatoria del extracto etanólico de la corteza del tronco de la moringa. Provocaron la inducción mediante exposición a lipopolisacáridos (LPS) de sustancias pro inflamatorias en líneas celulares humanas de monocitos THP-1. Se realizaron seis cultivos celulares: un control negativo sin exposición LPS (referencia), un control positivo con exposición a LPS (1.5 μg/ml durante 24h) y cuatro cultivos de ensayo con exposición a LPS (24h) y tratamiento con distintas concentraciones del extracto (31.25, 62.50, 125 y 250 μg/ml respectivamente durante 24h). Se determinó el grado de inflamación valorando la liberación de interleukina 1β (IL-1β) e interleukina 6 (IL-6) y de α-interferón (α-TNF). En todos los cultivos tratados con el extracto se observaron reducciones estadísticamente significativas (p<0.01) en las concentraciones de IL-1β, IL-6 y α-TNF. Estos resultados mostraron que el extracto de corteza de moringa puede ser útil en el tratamiento de las complicaciones vasculares asociadas a la inflamación.
Waterman et al (12), evidenciaron que, a nivel cromosómico, los isotiocianatos presentes en un concentrado de hojas frescas de moringa modulan la expresión génica para la liberación de sustancias pro inflamatorias. Los autores obtuvieron el extracto metanólico de las hojas de moringa, del cual separaron mediante un HPLC semipreparativa la fracción rica en isotiocianatos. Esta fracción se utilizó para valorar los cambios en la expresión de aquellos genes responsables de la síntesis de óxido nítrico sintetasa (iNOS), IL-1β, α-TNF e IL-6 en líneas celulares de macrófagos RAW. Estas líneas celulares fueron expuestas a diferentes concentraciones del concentrado de moringa (0, 5, 10, 50 y 100 μg/ml respectivamente) y 2 h después se indujo la respuesta inflamatoria mediante la exposición a LPS (1 μg/ml) durante 6 h. Se prepararon a su vez dos cultivos celulares, uno sin tratamiento ni exposición (control negativo) y otro con exposición y sin tratamiento (control positivo). Tras analizar los resultados de la expresión génica se observó, a la concentración de 100 μg/ml, una supresión casi total de los genes responsables de la síntesis de iNOS (p<0.001), IL-1β (p<0.05) e IL-6 (p<0.05) mientras que los genes responsables de la síntesis de α-TNF apenas se vieron afectados. Al mismo tiempo no se observó ningún sigo de citotoxicidad con ninguno de los ensayos realizados. De esta forma valoraron la pertinencia del concentrado de hojas de moringa como producto de uso alimentario para disminuir la inflamación vascular asociada a enfermedades crónicas.
Das et al (13), valoraron la capacidad del extracto de semilla de moringa (ESM) para neutralizar, in vivo, las especies reactivas del oxígeno (ERO), secundarias a una dieta rica en grasa, así como la posible protección (in vitro) que ejerce sobre los núcleos celulares y el ADN. Los autores realizaron el estudio con 26 ratones albino suizo macho y conformaron cuatro grupos, grupo 1 con dieta estándar (control negativo), grupo 2 con dieta grasa sin suplemento (control positivo), grupo 3 con dieta normal y ESM (150 mg/kg de peso vivo mediante sonda esofágica) y un grupo 4 con dieta grasa y ESM.
Los autores analizaron los siguientes indicadores: glutatión reducido (GSH), actividad superóxido dismutasa (SOD), actividad catalasa y actividad glutatión peroxidasa (GP). Los resultados mostraron en el grupo control positivo una disminución significativa de todos los indicadores respecto al grupo control negativo (p<0.05) lo que indicaba un agotamiento de los mecanismos antioxidantes del hígado frente a una dieta rica en grasa. Además, en el grupo con dieta grasa y suplemento de moringa, estos valores aumentaron significativamente (p<0.05) respecto al grupo control positivo, pasando los niveles de GSH de 0.38 a 1.42 μmol/mg de proteína, los de actividad de SOD de 0.78 a 2.14 U/mg de proteína, los de catalasa de 1.15 a 4.10 U/μg de proteína y los de GP de 0.74 a 1.81 U/ml de enzima/mg de proteína.
Los ensayos in vitro consistieron en el estudio del daño a los núcleos de los hepatocitos tras la generación de radicales hidroxilo. Se utilizaron tres tubos con tejido hepático a los cuales se les adicionó Fe-EDTA para H2O2 provocar la posterior reacción de Fenton con H2O2 y la consiguiente formación de radicales hidroxilo. Uno de los tubos se utilizó como control (sin adición de H2O2 ), a otro se le añadió H2O2 y al tercero se le añadió H2O2 y ESM simultáneamente. Tras analizar los hepatocitos mediante microscopio de fluorescencia los autores describen que en el primer tubo no hubo daño nuclear mientras en el tubo con H2O2 los radicales hidroxilo provocaron la ruptura de la membrana y liberación de ácidos nucleicos. En el tubo con H2O2 y ESM los núcleos se muestran sin daño o con daños visiblemente menores al caso anterior (cuantificación no realizada en el estudio), demostrando el efecto protector del ESM frente a los radicales hidroxilo. Se concluye la utilidad del ESM como protector frente a las especies reactivas del oxigeno que se origina de forma secundaria en las dietas ricas en grasa así como protector de los núcleos celulares frente a radicales hidroxilo en los hepatocitos.
Efecto en el tratamiento de la diabetes mallitus
Sulistyorini et al (14) realizaron un estudio para determinar el mecanismo de acción del extracto de hoja de Moringa oleifera en el tratamiento de la insulitis pancreática inducida mediante streptozocina y la expre sión de insulina en el páncreas. Se realizó un ensayo in vivo con tres grupos de animales (ratas Sprague Da wley macho de 2-3 semanas de edad) con hipergluce mia inducida mediante streptozocina (40 mg/kg de peso). Uno de los grupos se mantuvo sin tratamiento con moringa (control), y otros dos grupos fueron trata dos con extracto a dosis de 250 y 500 mg/kg/día res pectivamente. Tras 21 días de ensayo se realizaron análisis histopatológicos de las muestras de páncreas, valorando en grado de infiltración de células inflama torias y por otro lado la expresión de insulina pancreá tica. Los resultados obtenidos mostraron que en los dos grupos tratados con el extracto hubo una reducción significativa (p<0.05) en el grado de insulitis (medida cuantificando la infiltración de células inflamatorias mononucleares) pero sin diferencias entre ambos gru pos tratados. Respecto a la expresión de insulina, se cuantificó la presencia de células β en los islotes de Langerhans mediante la escala 0-8 de Alfred, observando un incremento significativo (p<0.05) entre el grupo control (4.80) y los grupos tratados con 250 y 500 mg/kg (7.58 y 7.85 respectivamente) pero sin diferencias según el tratamiento. En base a estos datos los autores concluyeron que el extracto de hoja de moringa aumenta la expresión de insulina y disminuye la insulitis a nivel pancreático.
]]> Pimjai et al. (15) desarrollaron otro estudio en hu manos sanos a los que se les suministró vía oral dosis de 0, 1, 2 y 4 g de hoja de moringa en polvo encapsu lado en cuatro ensayos separados por dos semanas y tras 12 horas de ayuno en cada uno. Tras la realización de los análisis los niveles de glucosa en sangre se man tuvieron sin diferencias significativas entre las distintas dosis (77, 78, 79 y 79 mg/dl, respectivamente) pero los niveles de insulina en sangre aumentaron en función de la dosis suministrada (2.3, 2.7, 3.3 y 4.1 μU/ml respec tivamente), siendo la diferencia entre las dosis de 4 g y el resto resultaron estadísticamente significativas (p=0.03). Los autores concluyeron que dosis altas de polvo de hoja de moringa encapsulado (4 g) incrementa significativamente la secreción de insulina, resultando un tratamiento potencial de la diabetes mellitus tipo 2.Protector de tejidos en intoxicaciones por arsénico
Se ha evaluado también la capacidad de la hoja de moringa para atenuar el daño a nivel cardiocirculatorio y hepático en ratones suizos albinos macho de cuatro semanas de edad frente a ingestas elevadas de arsénico (16). Se utilizaron 24 animales conformado cuatro gru pos con seis animales cada uno: grupo 1 con dieta es tándar (control negativo), grupo 2 con dieta suplementada en polvo de hoja de moringa en (50 mg/kg/día), grupo 3 con dieta con arsenito de sodio en el agua de bebida (control positivo) (10 mg/kg/día) y grupo 4 con dieta con arsenito de sodio y hoja de mo ringa (combinación de los dos anteriores). Tras las 16 semanas de duración del experimento se evidencia en el grupo control positivo frente al control negativo el aumento de triglicéridos (125.47 vs. 80.30 mg/dl) y glu cosa (160.00 vs. 121.54 mg/dl) y la disminución de li poproteínas HDL (40.81 vs. 54.16 mg/dl) al mismo tiempo que aumenta las enzimas ALP (120.16 vs. 137.10 UI/l) y AST (118.28 vs. 86.22 UI/l), todos ellos con diferencias estadísticamente significativas (p < 0.05). Además, en el grupo 4 (arsenito y moringa) se observaron unos valores significativamente diferentes respecto al grupo 3 (arsenito) con niveles los niveles de triglicéridos en 85 mg/dl, HDL en 57.00 mg/dl, glucosa en 120.86 mg/dl, ALP en 123.98 UI/l y AST en 89.19 UI/l; todos muy similares a los del grupo control nega tivo. Este estudio demuestra la efectividad de la hoja de moringa en la reversión de los daños causados por la intoxicación por arsénico.
Disminución de la fatiga muscular
Lamou et al . (17) realizaron un estudio en el que suministraron un extracto acuoso de hoja de moringa a ratas Wistar macho de entre 130-132 g de peso para va lorar posteriormente la fatiga muscular frente a un ejer cicio continuado. Se realizaron cuatro grupos de estudio; el grupo 1 o grupo control, y los grupos de tra tamiento 2, 3 y 4 a los que se les suministraron vía oral 100, 200 y 400 mg/kg, respectivamente, del extracto acuoso de hoja de moringa en una dosis única diaria durante 28 días. Los animales se sometieron a pruebas de resistencia de flotación con peso añadido y otras a resistencia sin peso. Los investigadores midieron el tiempo máximo de resistencia así como parámetros bio químicos de sangre, músculo e hígado. Tras analizar los resultados los autores describen un tiempo mayor de re sistencia al ejercicio forzado (p<0.05) en las ratas de los grupos tratados (135.75, 140.12 y 131.25 segundos respectivamente) con el extracto de moringa respecto a los del grupo control (89.75 segundos). Los análisis bioquímicos evidenciaron que, en los tres grupos trata dos con extracto de hoja de moringa, se produjo, de ma nera significativa (p<0.05), una mayor acumulación de glucógeno en el tejido muscular siendo de 2.06, 2.76 y 2.68 mg/g frente a 1.19 mg/g del grupo control. En el tejido hepático ocurrió lo mismo siendo de 21.57, 22.69 y 22.64 mg/g frente a 17.68 mg/g del grupo control.
Tras el ejercicio también hubo diferencias significativas entre los grupos tratados y el grupo control en los nive les sanguíneos de lactato (24.14, 19.37 y 18.87 mmol/l vs. 31.27 mmol/l), glucosa (145.01, 147.4 y 163.9 mg/dl vs. 119.9 mg/dl), urea (26.78, 26.41 y 28.21 mg/dl vs. 45.03 mg/dl) y triglicéridos (75.05, 125.28 y 58.42 mg/dl vs. 176.77 mg/dl). De esta manera los au tores concluyen que el extracto acuoso de hoja de mo ringa tiene propiedades anti fatiga frente al ejercicio físico facilitando la movilización de los depósitos de grasa del organismo, retardando el agotamiento de las reservas de glucógeno y disminuyendo la acumulación de lactato y urea en sangre.
Propiedades antimicrobianas y purificadoras de agua
Diversos estudios in vitro demuestran la actividad antimicrobiana de los biocomponentes de la cubierta de la semilla y de la vaina de la moringa inhibiendo el cre cimiento de bacterias multirresistentes gram+ y gram (18, 19). Estos mismos investigadores observaron efec tos similares de la cubierta de la semilla inhibiendo la formación de biofilms de Staphylococcus aureus , Pseu domona aeruginosa y Candida albicans entre un 76 86%, similar al efecto obtenido con la aplicación del antibióticos (gentamicina para S. aureus y P. aerugi nosa y anfotericina para C. albicans ) (20). También se ha comparado la eficacia antibiótica de extractos de di ferentes especies vegetales (hojas de Xanthosoma ma faffa y Moringa oleifera y los frutos de Passiflora edulis) demostrado que el extracto de hoja de moringa presenta un actividad antibiótica de mayor espectro in hibiendo el crecimiento de diversas cepas bacterianas gram-multirresistentes ( Escherichia coli, Enterobactera aerogenes , Klebsiella pneumoniae , Pseudomona aeru ginosa y Providencia stuartii ) siendo E. coli la más sen sible de todas con una concentración mínima inhibitoria de 128 μg/ml (21).
Nogueira Brilhante et al . (22) evaluaron la capaci dad extractos de hojas, semilla, tallo, vaina y flores de la moringa en la inhibición del crecimiento de especies del género Vibrio ( V. cholera, V. vultificus, V. mimicus ) y E. coli en el agua de cría de camarón ( Macrobra chium amazonicum ) contaminada. El tratamiento con mayor espectro de inhibición fue el realizado con el ex tracto de la vaina, efectivo frente a V. cholera, V. vulti ficus, V. mimicus y E. coli , a concentraciones mínimas inhibitorias de 0.3125, 5, 1.25 y 2.5 mg/ml respectiva mente. El extracto de semillas resultó ser el menos efec tivo, inhibiendo solamente el crecimiento de V. cholera y a concentración de 2.5 mg/ml. Así, los autores con cluyes que estos derivados de la moringa pueden ser útiles para disminuir la contaminación de determinadas especies de Vibrio spp . y E.coli en los criaderos de ca marón, reduciendo así los posibles casos de diarrea por la ingestión de estos crustáceos.
Dasgupta et al. (23) desarrollaron un estudio para valorar la capacidad del extracto de semilla de moringa de disminuir la concentración bacteriana en agua de be bida contaminada con E. coli y Bacillus subtilis . Elaboraron extractos de la semilla a concentraciones crecientes de 1-5% de las cuales añadieron volúmenes crecientes de 2 a 10 ml en agua a purificar (100ml). La reducción máxima de E. coli y B. subtilis se encontró al añadir 10ml del el extracto al 5%, siendo del 93.2% y 96.2% respectivamente.
]]> Su poder desinfectante también se ha demostrado en un estudio realizado por Torondel et al . (24) valorando la efectividad de la hoja triturada en el lavado de manos, comparado con el jabón. Se contrastaron un triturado fresco y otro desecado frente al jabón en manos de 15 voluntarios previamente contaminadas con E. coli . Se comparó el efecto inhibitorio de E. coli con 2, 3 y 4 g de moringa y desecada frente a 5 ml de jabón no medicado. En el ensayo con 2 g la reducción logarítmica media fue de 2.44 con el triturado fresco y 2.70 con el seco, mientras que con el jabón fue de 3.00. Con 3 g la reducción fue de 2.58, 2.84 y 2.99 res pectivamente y para 4 g de 2.70, 2.91 y 2.97, respec tivamente. En ningún caso se observaron diferencias estadísticamente significativas (p>0.05) entre la efica cia de la moringa ni el jabón. De esta forma, la hoja de moringa puede emplearse como higienizante de manos en zonas rurales donde no sea fácil la obtención de jabón.Uso alimentario de la moringa
El uso de moringa en alimentos queda reducido casi exclusivamente a panes, galletas y productos cárnicos (Tabla 2). En los primeros se utiliza con un fin nutritivo, mientras que en los segundos con un fin tecnológico, como antioxidante y conservante principalmente.

Conocimiento y consumo de moringa
Rakotosamimanana et al (25) compararon el cono cimiento local acerca de la moringa y su consumo, comparándola con el de la mandioca. Se realizó una en cuesta a 1000 familias de diferentes zonas geográficas y nivel socio-económico acerca de si conocían o no el producto, por qué motivos lo utilizaban, forma de con sumo y motivo de no consumirlo, entre otras cuestio nes. La mandioca resultó ser mucho más conocida y consumida, a pesar de que los encuestados decían co nocer sus propiedades poco nutritivas, e incluso tóxicas si se consumía en grandes cantidades. Por el contrario las hojas de moringa eran menos conocidas y consumi das, aun conociendo sus propiedades nutritivas. Los au tores determinaron que esta diferencia se consumo se debía a factores culturales, de disponibilidad y de pre cio, y también por el mayor efecto saciante de la man dioca. Ante estos resultados los investigadores desarrollaron cuatro tipos de snack: (A) 100% man dioca, (B) 99.4% mandioca y 0.6% de hoja de moringa, (C) 89.4% mandioca, 0.6% moringa y 10% azúcar y (D) con 89.4% mandioca, 1.2% moringa y 10% azúcar. Tras el ensayo, los niños prefirieron los snack del grupo (C) y (D). Los autores concluyen que es recomendable potenciar campañas de información y el cultivo de plantaciones de moringa para hacerlas llegar a los con sumidores, ya que una vez consumida en determinadas preparaciones puede ser aceptada, especialmente en los niños por su elevado contenido en aminoácidos esen ciales, ácido α-linoleico y minerales.
Utilización en panes y galletas
En este caso la adición de los diferentes derivados de la moringa persigue el objetivo de incrementar el valor nutritivo de estos alimentos. Se ha desarrollado pan suplementado con hoja de moringa (26). El estudio se llevó a cabo con 5 mezclas a distinta concentración de hoja de moringa en polvo con harina de trigo (1%, 2%, 3%, 4% y 5%) y la harina control (100% trigo). En todos los casos se produjo un incremento de proteínas, grasas, fibra y cenizas y los niveles de Fe, Cu, Mg, Ca y β-caroteno aumentaron significativamente (p<0.05).
En cuanto a las propiedades físicas del pan elabo rado, el incremento de volumen de las piezas se vio dis minuido conforme incrementaba la concentración de hoja de moringa, desde un volumen final de 796 cm3 en el pan con 100% de trigo hasta 496 cm3 en el pan con 5% moringa. Según los autores este cambio se debió a la menor capacidad de fermentación y la menor cantidad de gluten presente conforme se aumentaba la cantidad de hoja de moringa en la mezcla de harina. Por otro lado, a adición de hoja de moringa en polvo con dujo a unas propiedades sensoriales disminuidas pena lizadas por el cambio en el color, sabor y textura. Por este motivo los autores recomendaban la utilización de la hoja de moringa pero con adición de sustancias aro matizantes para enmascarar el sabor de la misma.
]]> Respecto al cambio de coloración del pan tras la adi ción de moringa la hoja de moringa, existe otra publi cación de pan enriquecido con espinacas y acelgas (27). En este caso los autores utilizaron concentraciones de 20g y 40g espinacas y acelgas troceadas (no molidas) por 100g de harina sin que se produjera, en general, re chazo en las propiedades sensoriales por parte de los consumidores. Es posible que para evitar un rechazo por el color verdoso sea conveniente informar al con sumidor previamente de los cambios y propiedades del pan para evitar el impacto visual o trocear las hojas del producto vegetal a introducir en vez de utilizar un tri turado en polvo para evitar en la medida de lo posible la difusión de color a toda la masa de pan.En otro estudio se incorporó harina de semilla de moringa en pan y galletas (28). En este caso los autores utilizaron harina de semillas de moringa que, previa mente, fueron hervidas y desecadas para eliminar las sustancias responsables del sabor amargo característico de las semillas crudas. Para la elaboración del pan rea lizaron mezclas de de 95/5, 90/10 y 85/15 mientras que para la elaboración de galletas las mezclas fueron de 90/10, 80/20 y 70/30. En ambos casos se utilizaron pro ductos control a base de harina de trigo (100/0).
Las propiedades nutritivas de panes y galletas ela boradas a partir de las harinas enriquecidas mejoraron notablemente. En cuanto a las propiedades reológicas del pan, las mezclas del 0 al 15% de harina de semilla de moringa resultaron reducir significativamente el volumen de la pieza de pan y la textura de la miga. Las propiedades sensoriales se vieron perjudicadas, tanto en la corteza como en la miga, debido principalmente a la menor cantidad de gluten en la harina resultante.
Par corregir estas deficiencias, se realizó otra prueba con harina 90/10 con un 10% adicional de una mezcla de aditivos químicos (gluten deshidratado, ácido ascór bico y estearoil-lactilato de sodio), muy utilizado en pa nadería como emulsionante y conservante (29) en la que se observó una mejoría en el volumen, la textura y las características de la corteza y la miga del pan.
En el caso de las galletas se observó que concentra ciones superiores al 20% de harina de moringa afectaba negativamente al crujido y al color de la superficie. Se describe un sabor semejante al de las nueces, atípico de las galletas. Pero las galletas al 20% ofrecen unas ca racterísticas físicas y sensoriales muy aceptables, te niendo en cuenta el gran incremento en el poder nutritivo de las mismas.
Los autores de este estudio concluyeron que es fac tible realizar panes con un 10% de harina de semilla de moringa, y galletas con un 20%, tratando previamente las semilla para eliminar sustancias amargantes.
Nwakalor et al . (30) desarrollaron también galletas, pero en este caso mezclando la harina de trigo con hoja de moringa en polvo en concentraciones de 100/0 (con trol), 90/10, 80/20, 70/30 y 50/50. Los nuevos produc tos se evaluaron sensorialmente y los resultados fueron positivos en las galletas con 10% de hoja de moringa ya que no mostraron diferencias significativas respecto al grupo control. Las galletas con 20% de hoja de mo ringa fueron penalizadas en el color y el aroma pero no en la aceptación global, mientras que las galletas al 30 y 50% presentaron una disminución significativa en todos los parámetros evaluados, crujido, gusto, color, aroma y aceptación global. De esta forma los autores recomiendan la concentración del 10% de hoja triturada de moringa en harina de trigo para la elaboración de galletas.
Utilización en productos cárnicos
Se han desarrollado diversos estudios en productos cárnicos. Diferentes partes del árbol de la moringa pre sentan gran cantidad de antioxidantes y sustancias an timicrobianas (21). En estos casos se buscó evaluar la eficacia como potencial antimicrobiano y antioxidante, pudiendo ser utilizado como conservante natural. Hazra et al . (31) estudiaron la adición de extracto acuoso de hoja de moringa en hamburguesas de carne de búfalo, evaluando los efectos en las propiedades fí sico-químicas, sensoriales y de estabilidad durante el cocinado. El extracto se añadió en concentraciones de 1, 1.5 y 2% a la mezcla de preparación de las hambur guesas, manteniendo unas preparaciones control sin ex tracto añadido. Se realizaron pruebas de pH, retención de agua, pérdida de peso tras el cocinado, capacidad an tioxidante (determinando los mg de manolaldehído/kg de muestra), crecimiento microbiano y determinaciones sensoriales. Las tres preparaciones con el extracto de hoja resultaron tener valores de pH significativamente mayores (pH 6.0) que la muestra control (pH 5.5). La capacidad de retención de agua también se incrementó de forma significativa al incrementar la dosis de ex tracto hasta la concentración del 1.5% (15.1%) frente al control (12.2%). Esto provocó una menor pérdida de peso tras el cocinado en la misma relación siendo la menor en las hamburguesas enriquecidas al 1.5 y 2% (34.8%) y la máxima en la hamburguesas control (36.7%). En todos los casos las diferencias fueron es tadísticamente significativas (p<0.05).
La capacidad antioxidante medida mediante las sus tancias reactivas al ácido tiobarbitúrico (TBARS) fue mayor en la muestra enriquecida al 1% (0.27 mg de ma nolaldehido/kg) frente al control (0.42 mg/kg). Res pecto al crecimiento microbiano, todas las hamburgue sas mostraron valores muy bajos siendo menores en las preparaciones enriquecidas (2.95, 2.72 y 2.65 CFU/g respectivamente) frente a las muestras control (2.96 CFU/g), demostrando la capacidad antimicrobiana de estos extractos.
]]> Finalmente, el análisis sensorial tras el cocinado (160°C durante 10 min) demostró una mejoría en el color de las hamburguesas enriquecidas, debido a la menor oxidación de la mioglobina; una mayor jugosi dad y terneza, relacionada con la mayor retención de agua en estas preparaciones; un sabor mejor valorado relacionado con la menor presencia de peróxidos de bido al poder antioxidante; en definitiva, una mejor va loración sensorial en las hamburguesas enriquecidas respecto a las control.Con base a estos resultados, los autores concluyeron que la adición de extracto acuoso de hoja de moringa deshidratado al 1%, 1.5% o 2% en hamburguesas de búfalo disminuyó la oxidación de las mismas y el cre cimiento microbiano, al mismo tiempo que mejora sus cualidades sensoriales, debiendo ser promocionado como ingrediente a tener en cuenta en éste y otros pro ducto cárnicos.
Otro estudio donde se utiliza el extracto de hoja de moringa como antioxidante es el realizado por Das et al . (32) en hamburguesas de carne de cabra. En este caso los autores emplean el extracto acuoso de hojas de moringa (concentrado al 8% del volumen inicial) para comparar su efecto antioxidante frente al butil hidroxil tolueno (BHT), antioxidante habitual en productos cár nicos, pero con reconocida actividad tóxica (33). Para realizar esta comparación se elaboraron dos tipos de hamburguesas, unas con un 0.1% de BHT y otras con 0.1% de EHM, con un tiempo de almacenamiento de 15 días. Se utilizó una preparación de hamburguesas sin ningún aditivo como control. Tras la elaboración de las hamburguesas se determinaron los niveles de com puestos fenólicos que resultaron ser significativamente mayores en las elaboradas con el extracto de hoja de moringa, lo que justificaría su uso como ingrediente para aumentar el poder antioxidante de las hamburgue sas. Las hamburguesas con extracto de hoja y BHT mostraron menor oxidación (TBARS), a los 15 días de almacenamiento siendo de 0.53 y 0.6 mg de manolal dehido/kg respectivamente, significativamente infereio res (p<0.05) que las que no tenían ningún antioxidante añadido (1.2 mg de manolaldehido/kg). A nivel senso rial (apariencia, sabor, textura, jugosidad y palatabilidad general) los autores describen que con la adición del extracto no hubo pérdida de calidad, siendo aceptadas tras los 15 días de almacenamiento. De esta forma se demuestra la validez del extracto de hoja de Moringa oleifera como antioxidante en las hamburguesas de cabra sin alterar las características sensoriales de las mismas.
Al-Juhaimi et al. (34) investigaron los efectos de la adición de harina de semillas de Moringa oleifera en hamburguesas de ternera como agente aglomerante, aprovechando al mismo tiempo sus cualidades antioxi dantes y conservantes. En este caso se realizaron ham burguesas con 0%, 2%, 4% y 6% de harina de semilla, reduciendo en los mismos porcentajes la cantidad de carne magra presente en la fórmula.
Las hamburguesas se cocinaron en horno a 180°C durante 20 min hasta temperatura interna de 75°C. Pos teriormente se evaluaron las diferentes muestras y se observaron diferencias estadísticamente significativas (p<0.05) en varios parámetros. Las hamburguesas en riquecidas presentaron mayor rendimiento en el coci nado (valorado como la relación entre el peso después y antes del cocinado) respecto a las hamburguesas con trol. Este rendimiento fue proporcional a la cantidad de harina de semilla añadida, siendo del 60.04, 68.52, 72.90 y 81.81% en las muestras al 0, 2, 4 y 6% respec tivamente. Estas diferencias se debieron principalmente a la mayor retención de agua (48.54, 57.13, 64.16 y 72.19%, respectivamente) y grasa (56.17, 65.11, 69.40 y 78.29% respectivamente).
Otras variables como la oxidación, pH y creci miento microbiano se analizaron durante el almacena miento a los días 0, 7, 14 y 21. En cuanto a la oxidación, los autores revelan que fue significativamente menor en las hamburguesas con harina de moringa frente a las hamburguesas control al igual que los valores de pH fueron mayores cuanto mayor era la concentración de harina de semilla (5.68, 6.01, 6.11 y 6.16 respectiva mente medidos a los 21 días). El estudio microbioló gico para determinar crecimiento de microorganismos aerobios mesófilos a 4°C reveló diferencias significa tivas en el recuento de colonias siendo menor en todas la muestras enriquecidas a los días 7, 14 y 21, mientras que las hamburguesas sin modificar presentaron los mayores recuentos microbianos
Finalmente se realizó un análisis sensorial con pa nelistas entrenados con muestras cocinadas a los días 0, 7, 14 y 21, para determinar la variación de atributos sensoriales durante el almacenamiento. Las hambur guesas normales mostraron signos de deterioro al día 14 y las enriquecidas al 2% mostraron deterioro a los 21 días por lo que no pudieron ser analizadas sensorial mente mientras que las muestras enriquecidas al 4 y 6% no mostraron deterioro durante los 21 días de almace namiento a 4ºC. Por lo tanto, sólo se realizaron catas de las hamburguesas al 0% de harina de semilla a los días 0 y 7, al 2% a los días 0, 7 y 14 y de las hambur guesas al 4 y 6% a los días 0, 7, 14 y 21. En esos casos no se observaron diferencias significativas en paráme tros como apariencia, sabor, aroma, terneza y aceptabi lidad general.
Por lo tanto, los autores concluyeron que la harina de semilla de moringa mejoró las propiedades de las hamburguesas de ternera a nivel fisicoquímico, de coc ción, vida útil y preferencia del consumidor tras el al macenamiento en refrigeración mostrando una buena capacidad como aglomerante en la formulación de hamburguesas de ternera.
En un estudio realizado con salchichas de pollo (35), se sustituyeron los tradicionales antioxidantes químicos (BHT) por triturado de hoja de moringa. Los autores adicionaron hoja de moringa desecada a la mezcla de salchicha en concentraciones de 0.25, 0.50, 0.75 y 1%, además de una muestra control positivo (con BHT) y otra control negativo (sin antioxidante) y valoraron las muestras a la semanas 1, 2, 3, 4 y 5 de almacenamiento. El trabajo describe a las cinco sema nas una actividad antioxidante significativamente mayor de la muestra con 0,25% de hoja de moringa respecto a la muestra sin antioxidantes, e incluso de las muestras con 0.50, 0,75 y 1% respecto a la muestra con BHT. El crecimiento microbiano de aerobios me sófilos a la semana cinco de almacenamiento fue sig nificativamente menor en las salchichas con 0.25% de moringa respecto a los controles siendo las pruebas con 0.50, 0.75 y 1% las que menor crecimiento micro biano presentaron. En cuanto a las propiedades senso riales las salchichas del grupo control positivo (con BHT) y las de hoja de moringa al 0.25 y 0.50% fueron las mejor valoradas sin diferencias entre ellas, mien tras que las concentraciones de 0.75 y 1% afectaron notablemente a la apariencia, color, sabor, aroma y a la aceptabilidad global. Por lo tanto los autores con cluyeron que un 0.5% de hoja de Moringa oleifera en las salchichas de pollo reduce significativamente la oxidación lipídica y el crecimiento microbiano sin al terar las características sensoriales.
La presencia de sustancias antioxidantes en la hoja de Moringa oleifera está ampliamente descrita (36), pero estas mismas sustancias pueden verse afectadas tras los tratamientos de desecación ya que son relati vamente inestables al calor (7). Un estudio desarro llado por Saini et al. (37) determinó el efecto de cinco métodos de desecado (liofilización, cabina de secado de aire forzado, microondas, horno y secado al sol) para valorar posteriormente las propiedades antioxi dantes. Para ello se cuantificaron carotenoides, cloro fila, α-tocoferol, ácido ascórbico y compuestos fenólicos totales antes y después de la desecación. Los resultados mostraron que la cabina de aire forzado mantuvo los mayores niveles de carotenoides totales mientras que la liofilización fue el método que menor pérdida de ácido ascórbico mostró. La desecación me diante exposición solar fue la que mayores pérdidas causó. Los autores concluyen que a nivel industrial es recomendable la desecación en cámaras de secado con ventilación, y a nivel doméstico la desecación en mi croondas.
]]> CONCLUSIONESLa Moringa oleifera ha sido utilizada de forma an cestral como curativo o paliativo de enfermedades de muy diversa índole. En los últimos años se han desarro llado gran variedad de investigaciones demostrando al gunas de sus funciones en el organismo fundamentalmente como antioxidante, antiinflamatorio o antihiperglucemiante, entre otras, así como funciones bacteriostáticas y bactericidas. Esto le otorga una capa cidad potencial para el tratamiento de diabetes, protec tor hepático o protector de los endotelios en determinadas enfermedades crónicas.
Sin embargo son todavía escasos los estudios acerca de los beneficios de la moringa utilizada como ingrediente alimentario. Los estudios en alimentos se centran valorar el incremento de las propiedades nu tritivas y la aceptación por parte del consumidor. En otros casos se valora el efecto tecnológico, principal mente como antioxidante natural, comparado con adi tivos químicos como el BHT, con marcado carácter tóxico.
Una vez descritas las propiedades potencialmente beneficiosas para la salud, el amplio margen de seguri dad en humanos (2) y también la validez como antio xidante y conservante alimentario, es necesario incrementar las investigaciones relativas al efecto sobre el organismo derivado del consumo de estos alimentos enriquecidos, teniendo en cuenta diversas variables como las posibles pérdidas de actividad durante el tra tamiento o la interacción con otros compuestos de los mismos, entre otras.
REFERENCIAS
1. Egea Fernández JM, Egea Sánchez JM, Egea Sánchez I, Rivera Núñez D. Cultivos promisorios para enfriar el clima y alimentar al mundo. Murcia 2015. 207 p.
2. Stohs SJ, Hartman MJ. Review of the Safety and Effi cacy of Moringa oleifera . Phytother Res. 2015;29 (6):796-804. [ Links ]
3. Anwar F, Latif S, Ashraf M, Gilani AH. Moringa olei fera : A food plant with multiple medicinal uses. Phyto ther Res. 2007;21(1):17-25. [ Links ]
]]>4. Stevens CO, Ugese FD, Baiyeri KP. Utilization poten tials of Moringa oleifera in Nigeria: a preliminary as sessment. ILNS. 2015;40:30-7. [ Links ]
5. Fahey JW. Moringa oleifera : A Review of the Medical Evidence for Its Nutritional, Therapeutic, and Prophy lactic Properties. Part 1. TFLJ. 2005;1(5):1-15.
6. Razis AFA, Ibrahim MD, Kntayya SB. Health Benefits of Moringa oleifera . Asian Pac J Cancer Prev. 2014;15(20):8571-6. [ Links ]
7. Coppin JP, Xu Y, Chen H, Pan M-H, Ho C-T, Juliani R, et al. Determination of flavonoids by LC/MS and anti inflammatory activity in Moringa oleifera . J Funct Foods. 2013;5(4):1892-9. [ Links ]
8. Minaiyan M, Asghari G, Taheri D, Saeidi M, Nasr-Es fahani S. Anti-inflammatory effect of Moringa oleifera Lam. seeds on acetic acid-induced acute colitis in rats. Avicenna J Phytomed. 2014;4(2):127-36. [ Links ]
9. Das N, Sikder K, Ghosh S, Fromenty B, Dey S. Mo ringa oleifera Lam. leaf extract prevents early liver in jury and restores antioxidant status in mice fed with high-fat diet. Indian J Exp Biol. 2012;50(6):404-12. [ Links ]
10. Tumer TB, Rojas-Silva P, Poulev A, Raskin I, Water man C. Direct and Indirect Antioxidant Activity of Polyphenol- and Isothiocyanate-Enriched Fractions from Moringa oleifera Moringa oleifera . J Agric Food Chem. 2015;63(5):1505-13. [ Links ]
11. Vasanth K, Minakshi GC, Ilango K, Kumar RM, Agra wal A, Dubey GP. Moringa oleifera attenuates the re lease of pro-inflammatory cytokines in lipopolysaccharide stimulated human monocytic cell line. Ind Crops Prod. 2015;77:44-50. [ Links ]
12. Waterman C, Cheng DM, Rojas-Silva P, Poulev A, Dreifus J, Lila MA, et al. Stable, water extractable iso thiocyanates from Moringa oleifera leaves attenuate in flammation in vitro. Phytochemistry. 2014;103:114-22. [ Links ]
13. Das N, Ganguli D, Dey S. Moringa oleifera Lam. seed extract prevents fat diet induced oxidative stress in mice and protects liver cell-nuclei from hydroxyl radical me diated damage. Indian J Exp Biol. 2015;53(12):794 802. [ Links ]
14. Sulistyorini R, Sarjadi, Johan A, Djamiatun K. Effect of Ethanol Extract of Moringa oleifera Leaves on In sulin Expression and Insulitis in Diabetes Mellitus Rats. Majalah Kedokteran Bandung. 2015;47(2):69-76. [ Links ]
15. Anthanont P, Lumlerdkij N, Akarasereenont P, Vanna saeng S, Sriwijitkamol A. Moringa oleifera Leaf Incre ases Insulin Secretion after Single Dose Administration: A Preliminary Study in Healthy Subjects. J Med Assoc Thai. 2016;99(3):308-13. [ Links ]
16. Sheikh A, Yeasmin F, Agarwal S, Rahman M, Islam K, Hossain E, et al. Protective effects of Moringa oleifera Lam. leaves against arsenic-induced toxicity in mice. Asian Pac J Trop Biomed. 2014;4(Suppl 1):S353-8. [ Links ]
17. Lamou B, Taiwe GS, Hamadou A, Abene, Houlray J, Atour MM, et al. Antioxidant and Antifatigue Proper ties of the Aqueous Extract of Moringa oleifera in Rats Subjected to Forced Swimming Endurance Test. Oxid Med Cell Longev. 2016;2016:3517824-. [ Links ]
18. Arora DS, Onsare JG. Antimicrobial Potential of Mo ringa oleifera Seed Coat and Its Bioactive Phytocons tituents. Korean J Microbiol Biotech. 2014;42(2): 152-61. [ Links ]
19. Arora DS, Onsare JG. In vitro antimicrobial evaluation and phytoconstituents of Moringa oleifera pod husks. Ind Crops Prod. 2014;52:125-35. [ Links ]
20. Onsare JG, Arora DS. Antibiofilm potential of flavo noids extracted from Moringa oleifera seed coat against Staphylococcus aureus, Pseudomonas aeruginosa and Candida albicans. J Appl Microbiol. 2015;118(2):313 25. [ Links ]
21. Dzotam JK, Touani FK, Kuete V. Antibacterial and an tibiotic-modifying activities of three food plants ( Xan thosoma mafaffa Lam ., Moringa oleifera (L.) Schott and Passiflora edulis Sims ) against multidrug-resistant (MDR) Gram-negative bacteria. BMC Complement Al tern Med. 2016;16.
22. Nogueira Brilhante RS, Sales JA, de Souza Sampaio CM, Barbosa FG, Neto Paiva MdA, de Melo Guedes GM, et al. Vibrio spp. from Macrobrachium amazoni cum prawn farming are inhibited by Moringa oleifera extracts. Asian Pac J Trop Med. 2015;8(11):899-902. [ Links ]
23. Dasgupta S, Gunda NSK, Mitra SK. Evaluation of the antimicrobial activity of Moringa oleifera seed extract as a sustainable solution for potable water. RSC Adv. 2016;6(31):25918-26. [ Links ]
24. Torondel B, Opare D, Brandberg B, Cobb E, Cairncross S. Efficacy of Moringa oleifera leaf powder as a hand washing product: a crossover controlled study among healthy volunteers. BMC Complement Altern Med. 2014;14.
25. Rakotosamimanana VR, Valentin D, Arvisenet G. How to use local resources to fight malnutrition in Madagas car? A study combining a survey and a consumer test. Appetite. 2015;95:533-43. [ Links ]
DOMéNECH ASENSIet al. 26. Sengev AI, Abu JO, Gernah DI. Effect of Moringa olei fera Leaf Powder Supplementation on Some Quality Characteristics of Wheat Bread. Food and nutrition sciences. 2013;4:270-9. [ Links ]
27. Lopez-Nicolas R, Frontela-Saseta C, Gonzalez-Abellan R, Barado-Piqueras A, Perez-Conesa D, Ros-Berruezo G. Folate fortification of white and whole-grain bread by adding Swiss chard and spinach. Acceptability by consumers. LWT-Food Sci Technol. 2014;59(1):263-9. [ Links ]
28. Ogunsina BS, Radha C, Indrani D. Quality characteris tics of bread and cookies enriched with debittered Mo ringa oleifera seed flour. Int J Food Sci Nutr. 2011;62 (2):185-94. [ Links ]
29. Gomes-Ruffi CR, da Cunha RH, Almeida EL, Chang YK, Steel CJ. Effect of the emulsifier sodium stearoyl lactylate and of the enzyme maltogenic amylase on the quality of pan bread during storage. LWT-Food Sci Technol. 2012;49(1):96-101. [ Links ]
30. Nwakalor CN. Sensory Evaluation of Cookies Produ ced from Different Blends of Wheat and Moringa olei fera Leaf Flour. IJNFS. 2014.
]]>31. Hazra S, Biswas S, Bhattacharyya D, Das SK, Khan A. Quality of cooked ground buffalo meat treated with the crude extracts of Moringa oleifera (Lam.) leaves. J Food Sci Tech Mys. 2012;49(2):240-5. [ Links ]
32. Das AK, Rajkumar V, Verma AK, Swarup D. Moringa oleifera leaves extract: a natural antioxidant for retar ding lipid peroxidation in cooked goat meat patties. Int J Food Sci Tech. 2012;47(3):585-91. [ Links ]
33. Kim Y-J, Ryu J-C. Evaluation of the genetic toxicity of synthetic chemical (XVIII)-in vitro mouse lymphoma assay and in vivo supravital micronucleus assay with butylated hydroxytoluene (BHT). Molecular & Cellular Toxicology. 2007;3(3):172-6. [ Links ]
34. Al-Juhaimi F, Ghafoor K, Hawashin MD, Alsawmahi ON, Babiker EE. Effects of different levels of Moringa ( Moringa oleifera ) seed flour on quality attributes of beef burgers. CyTA-J Food. 2016;14(1):1-9. [ Links ]
35. Jayawardana BC, Liyanage R, Lalantha N, Iddamal goda S, Weththasinghe P. Antioxidant and antimicrobial activity of drumstick ( Moringa oleifera ) leaves in her bal chicken sausages. LWT-Food Sci Technol. 2015;64(2):1204-8. [ Links ]
]]>36. Bholah K, Ramful-Baboolall D, Neergheen-Bhujun VS. Antioxidant activity of polyphenolic rich Moringa oleifera Lam. Extracts in food systems. J Food Bio chem. 2015;39(6):733-41. [ Links ]
37. Saini RK, Shetty NP, Prakash M, Giridhar P. Effect of dehydration methods on retention of carotenoids, toco pherols, ascorbic acid and antioxidant activity in Mo ringa oleifera leaves and preparation of a RTE product. J Food Sci Tech Mys. 2014;51(9):2176-82. [ Links ]
Recibido: 14-08-2016 Aceptado: 21-12-2016
^rND^sStohs^nSJ^rND^sHartman^nMJ^rND^sAnwar^nF^rND^sLatif^nS^rND^sAshraf^nM^rND^sGilani^nAH^rND^sStevens^nCO^rND^sUgese^nFD^rND^sBaiyeri^nKP^rND^sRazis^nAFA^rND^sIbrahim^nMD^rND^sKntayya^nSB^rND^sCoppin^nJP^rND^sXu^nY^rND^sChen^nH^rND^sPan^nM-H^rND^sHo^nC-T^rND^sJuliani^nR^rND^set^nal^rND^sMinaiyan^nM^rND^sAsghari^nG^rND^sTaheri^nD^rND^sSaeidi^nM^rND^sNasr-Esfahani^nS^rND^sDas^nN^rND^sSikder^nK^rND^sGhosh^nS^rND^sFromenty^nB^rND^sDey^nS^rND^sTumer^nTB^rND^sRojas-Silva^nP^rND^sPoulev^nA^rND^sRaskin^nI^rND^sWater^nman C^rND^sVasanth^nK^rND^sMinakshi^nGC^rND^sIlango^nK^rND^sKumar^nRM^rND^sAgra^nwal A^rND^sDubey^nGP^rND^sWaterman^nC^rND^sCheng^nDM^rND^sRojas-Silva^nP^rND^sPoulev^nA^rND^sDreifus^nJ^rND^sLila^nMA^rND^set^nal^rND^sDas^nN^rND^sGanguli^nD^rND^sDey^nS^rND^sSulistyorini^nR^rND^sSarjadi,^nJohan A^rND^sDjamiatun^nK^rND^sAnthanont^nP^rND^sLumlerdkij^nN^rND^sAkarasereenont^nP^rND^sVanna^nsaeng S^rND^sSriwijitkamol^nA^rND^sSheikh^nA^rND^sYeasmin^nF^rND^sAgarwal^nS^rND^sRahman^nM^rND^sIslam^nK^rND^sHossain^nE^rND^set^nal^rND^sLamou^nB^rND^sTaiwe^nGS^rND^sHamadou^nA^rND^sAbene,^nHoulray J^rND^sAtour^nMM^rND^set^nal^rND^sArora^nDS^rND^sOnsare^nJG^rND^sArora^nDS^rND^sOnsare^nJG^rND^sOnsare^nJG^rND^sArora^nDS^rND^sNogueira^nBrilhante RS^rND^sSales^nJA^rND^sde^nSouza Sampaio CM^rND^sBarbosa^nFG^rND^sNeto^nPaiva MdA^rND^sde^nMelo Guedes GM^rND^set^nal^rND^sDasgupta^nS^rND^sGunda^nNSK^rND^sMitra^nSK^rND^sRakotosamimanana^nVR^rND^sValentin^nD^rND^sArvisenet^nG^rND^sSengev^nAI^rND^sAbu^nJO^rND^sGernah^nDI^rND^sLopez-Nicolas^nR^rND^sFrontela-Saseta^nC^rND^sGonzalez-Abellan^nR^rND^sBarado-Piqueras^nA^rND^sPerez-Conesa^nD^rND^sRos-Berruezo^nG^rND^sOgunsina^nBS^rND^sRadha^nC^rND^sIndrani^nD^rND^sGomes-Ruffi^nCR^rND^sda^nCunha RH^rND^sAlmeida^nEL^rND^sChang^nYK^rND^sSteel^nCJ^rND^sHazra^nS^rND^sBiswas^nS^rND^sBhattacharyya^nD^rND^sDas^nSK^rND^sKhan^nA^rND^sDas^nAK^rND^sRajkumar^nV^rND^sVerma^nAK^rND^sSwarup^nD^rND^sKim^nY-J^rND^sRyu^nJ-C^rND^sAl-Juhaimi^nF^rND^sGhafoor^nK^rND^sHawashin^nMD^rND^sAlsawmahi^nON^rND^sBabiker^nEE^rND^sJayawardana^nBC^rND^sLiyanage^nR^rND^sLalantha^nN^rND^sIddamal^ngoda S^rND^sWeththasinghe^nP^rND^sBholah^nK^rND^sRamful-Baboolall^nD^rND^sNeergheen-Bhujun^nVS^rND^sSaini^nRK^rND^sShetty^nNP^rND^sPrakash^nM^rND^sGiridhar^nP^rND^1A01^nEmily^sCaplan^rND^1A03^nRebecca^sKanter^rND^1A01^nRichelle^sBearup^rND^1A01^nNoel W.^sSolomons^rND^1A03^nOdilia I^sBermudez^rND^1A01^nEmily^sCaplan^rND^1A03^nRebecca^sKanter^rND^1A01^nRichelle^sBearup^rND^1A01^nNoel W.^sSolomons^rND^1A03^nOdilia I^sBermudez^rND^1A01^nEmily^sCaplan^rND^1A03^nRebecca^sKanter^rND^1A01^nRichelle^sBearup^rND^1A01^nNoel W^sSolomons^rND^1A03^nOdilia I^sBermudez
Comparative Performance of NEMS S Surveys in Latino Food Stores in the Greater Boston Area
Emily Caplan, Rebecca Kanter, Richelle Bearup, Noel W. Solomons, Odilia I. Bermudez
Tufts University, Department of International Relations, School of Medicine, Boston, MA, EEUU.
London School of Hygiene & Tropical Medicine, London, United Kingdom .
Center for Studies of Sensory Impairment, Aging, and Metabolism (CeSSIAM), Guatemala City, Guatemala
SUMMARY
The dietary practices of diverse population groups, associated with the nutritional transition and the rapid demographic changes occurring globally require more attention to the food preferences of migrant groups such as Latinos living in the United States United States of America (US). This work aimed at the performance of an instrument utilized to measure availability of healthy food options in Latino stores located in the town of Somerville, state of Massachusetts. The methodology included the application of two versions: Guatemalan and US of the Nutrition Environment Measures Survey for Stores (NEMS S), for the assessment of the availability of healthy food options in three Latino stores. Data were analyzed using descriptive statistics. The results indicated that foods sold in Latino stores were identified more success fully with the Guatemalan NEMS S than with the US NEMS S. There was a general lack of healthy food options found when using the US survey, as well as a relatively narrow selection of fruits and vegetables. As conclusion, it was found that the US NEMS S tended to identify a lower number of healthy food options, as compared to a larger number of similar options when a culturally appropriate survey was used. These findings illustrate a manner in which a culture specific instrument perform more appropriately than similar instruments adapted for other population groups, especially when the results are to be applied to support development of healthy food policies.
Key words: NEMS S, food environment, Latinos, food policy.
Rendimiento comparativo de Encuestas NEMS S realizadas en tiendas latinas en el área metropolitana de Boston
RESUMEN.
]]> Las prácticas alimentarias de diversos grupos de población, asociadas a la transición nutricional, y a los rápidos cambios demográficos que se producen a nivel mundial, exigen más atención a las preferencias alimentarias de grupos migrantes, como por ejemplo Latinos en los Estados Unidos de Norteamérica (EU). Este trabajo documenta los resultados de aplicar un instrumento para medir disponibilidad de alimentos saludables en tres tiendas latinas ubicadas en la ciudad de Somerville, estado de Massachusetts. La metodología utilizada incluyó la aplicación de dos versiones: guatemalteca y EU de la Encuesta para Medir Ambiente Nutricional en Tiendas (NEMS S, siglas en inglés), para evaluar la disponibilidad de alimentos saludables. Los datos se analizaron con estadísticas descriptivas. Los resultados indicaron que los alimentos vendidos en las tiendas latinas fueron identificados con más acierto con el NEMS S guatemalteco que con el NEMS S de EU. Con este último instrumento, se obtuvo un número menor de opciones saludables y una selección limitada de frutas y de vegetales. Como conclusión, se encontró que el NEMS S de EU identificaba un menor número de opciones de alimentos saludables, en comparación con el instrumento culturalmente apropiado. Estos hallazgos ilustran la importancia de utilizar instrumentos específicos para determinar disponibilidad de alimentos saludables, especialmente cuando los resultados se utilicen para apoyar el desarrollo de políticas alimentarias.Palabras clave: NEMS S, ambiente alimentario, Latinos, políticas alimentarias
Recibido: 16 09 2016 Aceptado: 11 03 201
INTRODUCTION
Food patterns and consumption practices are intrinsic components of population groups across the world. Those dietary practices are influenced by the physical environment, particularly those products identified as edibles, but also by the cultural practices that define people. Extensive research indicates that food patterns play substantial roles in the causation and prevention of chronic, non communicable diseases (1) and that the food environment, including access to food outlets and the presence of healthy choices, is associated with eating behaviors (2, 3). It has been shown that shopping preferences are linked to obesity and that the lack of healthy food options in grocery stores leads to weight gain (4). Successful policies should also be part of a larger plan to change social norms (5). In response to this challenge, the Nutrition Environment Measures Survey for Stores (NEMS S) was developed in the first decade of the millennium as a well defined measurement tool to examine the availability of healthy food options in grocery and convenience stores in the United States (6). We refer to this original instrument as US NEMS S Cultural factors play a significant role in determining shopping preferences, as food related behavior is modified by culture (7, 8). Ethnic identity is positively correlated with consumption of culturally significant foods and negatively correlated with the consumption of ‘convenience’ or prepackaged foods (9). Stores targeted to specific ethnic groups, including Latinos, serve as important sites for the preservation of their homeland culture (10), including their food preferences.
Despite the significance of culture in shaping food preferences, current research lacks a culturally specific analysis of what drives food preferences, specifically for the growing Latino population, particularly recent arrivals of Central Americans (Guatemalans, Hondurans and Salvadorians) in the northeast region of the United States . The present study aimed to contribute with information to help to fill this gap in knowledge by assessing the applicability of the NEMS S survey modified for use in Guatemala (11) as compared to the original US NEMS S, which wa, both in its original version designed for the US population, and as modified for use in Guatemala (11). The site identified for this study was Somerville, a small city located north of Boston, state of Massachusetts.
The Guatemala NEMS S (GUA NEMS S) survey contained items more familiar in a Latino diet, including selected fruits and vegetables, canned beans and boxed fluid milk. Researchers believed that the conduct of the GUA NEMS S would result in a more thorough analysis of the availability of healthy and unhealthy foods in stores in Latino communities in the US be cause the items on the survey would match those being sold in these culturally specific stores.
The primary objective of this study was to test the GUA NEMS S to examine the food environment in a convenient, small sample of Latino stores, located in East Somerville, in which there is a rapidly growing Latino population, primarily of Central American origin. Secondarily, researchers also utilized the NEMS S surveys to assess the availability of healthy food options in the three Latino stores. The corresponding hypotheses were: 1) The foods found in the three Latino stores will apply more closely to the GUA NEMS S than the original survey created for US stores (US NEMS S); and 2) There will be a general lack of healthy food options in these small stores indicated by the results of the NEMS S surveys.
MATERIAL AND METHODS
1. ENUMERATION
]]> Through enumeration of the study area (Eastern Massachusetts), researchers selected the city of East Somerville, for its urban location and large Latino population, particularly recent migrants of Central American origins. A list of food outlets was compiled from a previous study conducted in the area (12) and from the 2010 Somerville census data. This study focused only on grocery stores. Larger chain grocery stores were also eliminated because the Latino or “international” aisles were too small to compare to local stores directly targeted to the Latino population.After the creation of an initial list, where 8 stores were identified, researchers visited the study area to narrow the store selection and to obtain permission from storeowners. A map of the East Somerville community was created using Geographic Information Systems (GIS). Food outlets were categorized using the system described in the NEMS online training (13). After enumerating and physically locating them, only 4 stores were identified as “Latino Stores”, from which three store managers agreed to participate in the study. The local Institutional Review Board approved this study, and owners or managers of the Latino stores gave in formed consent.
Finally, researchers created store layouts of the items sold in the three Latino stores and diagramed the floor plans.
2. UTILIzATION OF NEMS S
NEMS S was the tool used to quantify the availability of healthy food options in the three Latino grocery stores of study. Researchers completed the US NEMS S online training to become certified NEMS raters. Then they participated in the creation of the GUA NEMS S. This new survey was pilot tested in stores in Quetzaltenango, Guatemala, and proved ac curate as a modification for items included in the Guatemalan diet (14).
The US NEMS S measures the availability of foods each item. The categories include: milk, fruit, vegetables each item. The categories include: milk, fruit, vegetables, ground beef, hot dogs, frozen dinners, baked goods, beverages (soda/juice), bread, potato chips, and cereal. The GUA NEMS S included 13 categories, those from the original US NEMS, plus boxed milk and canned beans. Within the categories, the individual items added to the Guatemala survey were papaya, pineapple, and plums for fruit, and green beans, zucchini, chayote, guicoysquash, radishes and avocados for vegetables. These items were chosen to reflect the Guatemalan diet.
In the US NEMS S survey, there were 10 fruit, 10 vegetables, and 9 non produce healthy food items. Fruit and vegetable items were all considered healthy food options, and each additional category had regular and healthy options (e.g. whole milk vs. skim milk). Eleven healthy food options were added to the GUANEMS S, so the total number of healthy food items on the US NEMS S and GUA NEMS S surveys was 29 and 40 respectively. Table 1 lists items on each NEMS S version.

3. INTER RATER CONCORDANCE
]]> Two researchers completed each of the NEMS S (US and Guatemala) in the three stores on one occasion per store. The inter rater correspondence of the items common to the US NEMS S and GUA NEMS S sur veys was calculated.4. ANALYSIS OF FOOD ITEM AVAILABILITY
Pearson Chi Square tests were used to undertake four inquiries: 1. Inter survey comparison of the 29 common items: areas of interest were availability of healthier options, fruit, and vegetable items in the three Latino stores; 2. Inter store comparison of healthier op tions of combined surveys; the percentage of available non produce healthy food items (n=9) was calculated for each store and analysis was done to determine the differences in non produce healthy availability across stores; 3. Inter store comparison of fruits and vegeta bles of combined surveys: the percentage of available fruits (n=10) and vegetables (n=10) was calculated for each store and analysis was done to determine the dif ferences in fruit and vegetable availability in stores; and 4. Relative availability of additional items: For each instrument (US and GUA NEMS S), researchers compared the cumulative percent availability of he althy items.
RESULTS
1. STORE LAYOUT
The stores were small, with only one or two cash registers. All three stores had sections for many of the same items found in larger stores and supermarkets. Many of the sections, however, were limited or lacking certain items. There were some unique properties to the stores. Store 1 had a liquor sales outlet in an adjacent location, and Store 3 had a Money Gram® station, which allows immigrants to send remittances to their home countries. A lack of price labeling on the majority of food items was common to all three stores.
2. INTER RATER CONCORDANCE ON THE ITEMS OF THE US NEMS S VERSION
The inter rater concordance was 100% for the items of the US version common to both instruments when comparing the rater conducting store evaluation by the US NEMS S with the rater using the GUA NEMS S. Thus, the presence or absence of each of these items on the store shelves was identically reported by both raters for all three stores.
3. INTER STORE COMPARISON OF COMMON ITEMS BETWEEN SURVEYS
]]>
As there was 100% inter rater concordance between raters for the 29 common items, there was a redundant certainty of the status of these items across store sites. This allowed the analysis of all of the items (none were in dispute) for inter store analysis. Table 2 (non produce items) and Table 3 (produce items) present the pooled results found in each store regarding the availability of items included in both, the US NEMS S and the GUA NEMS S.


Focusing on the non produce items (Table 2), all three stores had the following regular versions of index items: milk, baked goods, soda, juice, chips, and bread. All three also had the healthier beverage options - diet soda and 100% juice - in stock. Two out of three stores had skim milk, low sugar cereal, and whole wheat bread, on the healthier side, and regularly sweetened breakfast cereal. Only one store had frozen dinners and low fat baked goods available. Raters never found healthier versions of chips (baked) or frozen dinners (low fat), nor were ground beef or hotdogs found in either regular or healthier format.
4. INTER STORE COMPARISON OF HEALTHY OPTIONS OF THE US NEMS S ACROSS THE COMBINED SURVEYS
Focusing on the specific avai lability of the healthier options, a first examination of the core items was done (Table 2). For external comparability, a comparison of the core list of the 9 non produce items (with soda and juice now constituting a single category of beverages) was done across sites. The cumulative availability in Store 1 was 11.1%, in Store 2 was 44.4%, and in Store 3 was 55.6% (Table 2). By Chi square analysis, the differential availability of non produce items was not statistically significant (p=0.127). Store 1 had availability of 20% of the total 20 produce items, Store 2 had 65% and Store 3 had 70% (Table 3). By Chi square analysis, the differential availability, considering all 29 elements of the U.S. NEMS S, was highly statistically significant (p=0.002).
5. RELATIVE AVAILABILITY OF THE ADDITIONAL GUATEMALAN ITEMS AMONG THE THREE FOOD STORES
Four items in two contrast pairings (i.e. regular versus healthy comparison) were added to the GUA NEMS S to complement the US offering: boxed (UHT) whole milk, boxed skim milk, canned refried black beans and whole black beans. All stores had both the healthier and re gular option for black beans. Conversely, neither skim nor whole milk in the boxed presentation was found in any store visited.
]]> Nine items were added to the GUA NEMS S, including three fruits: papaya, pineapple and plums, and six vegetables: green beans, zucchini, chayote, guicoy, radish and avocado (Table 3). Store 1 had none of the additional fruits. Store 2 had two of the three additional fruits and Store 3 had all three additional fruits (Table 3). With regard to the additional vegetable items, Store 1 had two of the six items; Stores 2 and 3 both had four of the six items (Table 3).Despite the uneven contribution to fruits from the original list (n=10) and with the additions from Guatemala (n=3), a comparison across the total of three stores was done. Data was normalized by expressing them as the cumulative percentage availability from each separate origin. Because of the limited number (n=2) of the Guatemalan items in the regular items category, no comparisons were done with them.
Overall, the percentage availability of fruits in the three stores was 33.3% for the original list (n=10) and 55.7% for the modified (Guatemalan) list (n=13) (p = 0.660). The percentage availability across stores was also calculated for vegetables of the original list (n=10) versus the modified list (n=16). Overall, the percentage availability of vegetables from the original list was 70% and the availability of vegetable additions was 55.6% (p = 0.423) (Table 3). In summary, two of the three stores had at least one of the three added fruits available; two of the three stores had at least two of the six added vegetables available. All stores had canned black beans available.
DISCUSSION
1. INTER RATER CONCORDANCE Many studies have utilized the US NEMS S as a tool (13). Yet, there are few studies that have documented the performance of the US NEMS S within the United States, particularly in the Northeastern region. Of the three published studies that reported the instrument performance of the NEMS S, the inter reliability determined by kappa had range of 0.00 to 1.00 in one study to 0.75 to 0.95 to the narrowest range reported by Glanz et al from 0.83 to 1.00 (15, 16). Four studies report inter rater reliability by percent agreement that range from about 77% to 100% for two studies; and two studies have near perfect agreement (15, 16, 17). Com pared to these previous studies, the performance of the GUA NEMS S was consistent or exceeded that of the previous studies who have reported statistics on instrument performance.
The high inter rater concordance between NEMS S raters could be in part due to a couple of favorable conditions. In contrast from the assessment of the GUA NEMS S survey conducted in Guatemala (14), raters in this study had full cooperation and approval of store management. This allowed raters to thoroughly conduct the surveys instead of furtively scurrying to collect the data. Although desirable, these conditions are not characteristic of grocery stores, so future NEMS S raters should precede with caution. Rimkus et al aptly note that in study where raters are in the same supermarket simultaneously collecting data low inter rater reliability is unlikely given that both raters are exposed to the same supermarket environment at the same time (15).
2. HEALTHY FOOD AVAILABILITY ACROSS STORES
Results indicate a range of availability of healthy food items between the three stores. Although located in the same area, and providing their services to the same population, it was noticed that Store 1 was poorly stocked for healthy items, whereas Stores 2 and 3 were better stocked with Store 3 having a slight advantage. To date, there are few studies that report the availability of each US NEMS S item in detail rather than a composite healthy food score (16, 21). When com pared to these studies, there was substantially lower availability of baked chips, low fat baked goods, low fat beef, low fat hot dogs and any type of fruit. The availability of the other US NEMS S items found in this study was consistent with that previously reported.
3. PERFORMANCE OF THE GUATEMALAN ADAPTATION OF THE NEMS S
It becomes evident in appreciating the degree of homology (29 of 40 items in common) across the instruments and the imbalance in number of items added to the GUA NEMS S, that no strict comparison of performance of the two versions of the instruments can be made. This would require further development of comparably sized listings in which the availability of foods culturally preferred over the US options are substituted for some of those of the dominant culture in the US NEMS S. This new survey still needs to be developed. However, the relative performance of the GUA NEMS S can be examined by looking at the sale of certain milk, beans, fruits and vegetables with a certain Latino affinity, in addition to those that are reflective of the US culture. The relative performance of the GUA NEMS S can be made by comparing the overall number of healthy items identified by the US NEMS S. Across stores, the number of healthy items identified as available increased in the three stores: in Store 1 (9 vs. 12 items), in Store 2 (19 vs. 26 items) and Store 3 (21 vs. 29 items), respectively.
]]> 4. COMPARISON WITH NEMS S APPLICATIONS OUTSIDE OF THE DOMINANT U.S. CULTUREThe application of the NEMS S outside the US is limited (22, 24). In their 2014 review of the food environment literature, Anderson Steeves and coworkers identified as a main gap the paucity of studies in di verse settings, especially within developing countries (24). One study in Paraguay modified the NEMS S to study the Paraguayan food environment and found that healthy bread and dairy options were limited (22). Mar tins et al also modified the NEMS S to study food environments in Brazil by expanding upon the degree of food processing and its association with obesity (23). Therefore, the NEMS S designed by Martins et al does not include a “healthy comparison” for each regular item; and includes foods divided into three categories by degree of food processing (e.g. nuts in group one; oils in group two; and instant noodles in group three). The comparisons between the work reported here and these studies are limited, but highlight the importance of designing and adopting survey methods to study food environments.
5. STRENGTHS AND LIMITATIONS OF THE STUDY
The major strength of this study is the theme of availability of healthy food options in the context of acculturation occurring in migrant communities with established elements of the US society. In addition, both field investigators were certified by the NEMS S online training program, and had been deeply exposed to NEMS research in Guatemala. While neither of them, however, was a native speaker of Spanish nonpart of the Latino community, the storeowners and store personnel, however, were sufficiently bilingual to exclude linguistic communication barriers as a problem in the study. The orthodox NEMS S protocol calls for making the observations, when possible, without alerting the store personnel to the inspection. Under the study circumstances, however, it was considered necessary and appropriate to establish full transparency and obtain au theorization from the store owners. The achieved high inter rater scores may derive, in part, from the relaxed conditions in the inspection, without the distraction of the furtive nature of an unannounced survey. There was an imbalance in the evaluation, as only the 29 items in common with the US NEMS S instrument were assessed by both raters; how reproducible across observers is the recognition of the 11 additional food and beverage items important in Guatemalan cui sine couldn’t be reported. Moreover, the small overall number of items in the lists and their numerical as symmetry, with 29 items of established interest to the general US population and 40 of presumed relevance for the Latinos resident in the US, presented a problem in choice of a statistical approach for a strict parallel comparison across the instruments.
CONCLUSIONS
The results of this study highlight the importance of attending to the cultural characteristics of the diverse population groups that are more inclined to do their food shopping in small, ethnic stores such as those frequented by Latinos. In the middle of the current epidemic of obesity and non communicable diseases associated with eating pat terns, it is needed to encourage and support owners of Latino stores to offer more ethnic specific healthy options of the traditional Latino food products. Additionally, in the future, a second generation of culturally sensitive NESM S, that substitutes foods of a more tropical and Central American origin in the listing, rather than simply adding them on, will need to be developed and tested in a similar context and paradigm as the one that gave the cultural framework to this study.
REFERENCES
1 Drewnowski A. Obesity and the food environment: dietary energy density and diet costs. Am J Prev Med 2004;27(3):154 162. [ Links ]
2. Babey SH, Diamant AL, Hastert TA, Harvey S. Desig ned for disease: the link between local food environ ments and obesity and diabetes. UCLA Center for Health Policy Research, 2008.
]]>3. Drewnowski A, Rolls BJ. How to modify the food en vironment. J Nutr 2005;135(4):898 899. [ Links ]
4. Story M, Kaphingst KM, Robinson O'Brien R, Glanz K. Creating healthy food and eating environments: policy and environmental approaches. Annu Rev Public Health 2008;29:253 272. [ Links ]
5. Graff SK, Kappagoda M, Wooten HM, McGowan AK, Ashe M. Policies for healthier communities: historical, legal, and practical elements of the obesity prevention movement. Annu Rev Public Health 2012;33:307 324. [ Links ]
6. Glanz K, Sallis JF, Saelens BE, Frank LD. Healthy nutrition environments: concepts and measures. Am J Health Promot 2005;19(5):330 333. [ Links ]
7. Asp EH. Factors affecting food decisions made by in dividual consumers. Food Policy 1999;24(2):287 294. [ Links ]
]]>8. Kumanyika SK. Environmental influences on child hood obesity: ethnic and cultural influences in context. Physiol Behav 2008;94(1):61 70. [ Links ]
9. Laroche M, Kim C, Tomiuk MA. Italian ethnic identity and its relative impact on the consumption of conve nience and traditional foods. J Consum Mark 1998;15(2):125 151. [ Links ]
10. Mankekar P. 'India Shopping': Indian grocery stores and transnational configurations of belonging. Ethnos 2002;67(1):75 97. [ Links ]
11. Kanter R, Alvey J, Fuentes D. A novel mobile phone application to assess nutrition environment measures in low and middle income countries. Food Nutr Bull 2014;35(3):296 300. [ Links ]
12. Chasan E, Pistran D, Santos E, Salazar B. The Latino Business Community in Somerville, Mass. Urban Bor derlands. https://sites.tufts.edu/urbanborderlands/ about urban borderlands/. 2003.
13. Nutrition Environment Measures Survey. www.med.upenn.edu/nems. Updated 20132015.
]]> 14. Kanter R, Alvey J, Fuentes D, et al. The Nutrition En vironment Measurement Survey Stores in Guatemala: measurement performance between the standard (USA) and a modified version (1019.7). FASEB J 2014;28(1 Supplement):1019.7.15. Rimkus L, Powell LM, zenk SN, et al. Development and reliability testing of a food store observation form. J Nutr Educ Behav 2013;45(6):540 548. [ Links ]
16. Glanz K, Sallis JF, Saelens BE, Frank LD. Nutrition Environment Measures Survey in stores (NEMS S): development and evaluation. Am J Prev Med 2007;32(4):282 289. [ Links ]
17. Krukowski RA, West DS, Harvey Berino J, Prewitt TE. Neighborhood impact on healthy food availability and pricing in food stores. J Community Health 2010;35(3):315 320. [ Links ]
18. Satia Abouta J, Patterson RE, Neuhouser ML, Elder J. Dietary acculturation: applications to nutrition rese arch and dietetics. J Am Diet Assoc 2002;102(8):1105 1118. [ Links ]
19. Ayala GX, Baquero B, Klinger S. A systematic review of the relationship between acculturation and diet among Latinos in the United States: implications for future research. J Am Diet Assoc 2008;108(8):1330 1344. [ Links ]
20. Powell LM, Slater S, Mirtcheva D, Bao Y, Chaloupka FJ. Food store availability and neighborhood charac teristics in the United States. Prev Med 2007;44(3):189 195. [ Links ]
21. Andreyeva T, Blumenthal DM, Schwartz MB, Long MW, Brownell KD. Availability and prices of foods across stores and neighborhoods: the case of New Haven, Connecticut. Health Aff (Millwood) 2008;27(5):1381 1388. [ Links ]
22. Gartin M. Food deserts and nutritional risk in Para guay. Am J Hum Biol 2012;24(3):296 301. [ Links ]
23. Martins PA, Cremm EC, Leite FH, Maron LR, Sca gliusi FB, Oliveira MA. Validation of an adapted ver sion of the nutrition environment measurement tool for stores (NEMS S) in an urban area of Brazil. J Nutr Educ Behav 2013;45(6):785 792. [ Links ]
24. Anderson Steeves, E, Martins PA, Gittelsohn J. Chan ging the Food Environment for Obesity Prevention: Key Gaps and Future Directions. J. Curr Obes Rep 2014;3(4):451 458. [ Links ]
^rND^sDrewnowski^nA^rND^sDrewnowski^nA^rND^sRolls^nBJ^rND^sStory^nM^rND^sKaphingst^nKM^rND^sRobinson-O'Brien^nR^rND^sGlanz^nK^rND^sGraff^nSK^rND^sKappagoda^nM^rND^sWooten^nHM^rND^sMcGowan^nAK^rND^sAshe^nM^rND^sGlanz^nK^rND^sSallis^nJF^rND^sSaelens^nBE^rND^sFrank^nLD^rND^sAsp^nEH^rND^sKumanyika^nSK^rND^sLaroche^nM^rND^sKim^nC^rND^sTomiuk^nMA^rND^sMankekar^nP^rND^sKanter^nR^rND^sAlvey^nJ^rND^sFuentes^nD^rND^sRimkus^nL^rND^sPowell^nLM^rND^szenk^nSN^rND^set^nal^rND^sGlanz^nK^rND^sSallis^nJF^rND^sSaelens^nBE^rND^sFrank^nLD^rND^sKrukowski^nRA^rND^sWest^nDS^rND^sHarvey^nBerino J^rND^sPrewitt^nTE^rND^sSatia-Abouta^nJ^rND^sPatterson^nRE^rND^sNeuhouser^nML^rND^sElder^nJ^rND^sAyala^nGX^rND^sBaquero^nB^rND^sKlinger^nS^rND^sPowell^nLM^rND^sSlater^nS^rND^sMirtcheva^nD^rND^sBao^nY^rND^sChaloupka^nFJ^rND^sAndreyeva^nT^rND^sBlumenthal^nDM^rND^sSchwartz^nMB^rND^sLong^nMW^rND^sBrownell^nKD^rND^sGartin^nM^rND^sMartins^nPA^rND^sCremm^nEC^rND^sLeite^nFH^rND^sMaron^nLR^rND^sScagliusi^nFB^rND^sOliveira^nMA^rND^sAnderson^nSteeves^rND^sE,^nMartins PA^rND^sGittelsohn^nJ^rND^nAnice^sMilbratz de Camargo^rND^sHenriquebonde^nDébora Delwing Dal Magro^rND^nDaniela^sDelwing de Lima^rND^nLuciane^sCoutinho de Azevedo Campanella^rND^nAnice^sMilbratz de Camargo^rND^sHenriquebonde^nDébora Delwing Dal Magro^rND^nDaniela^sDelwing de Lima^rND^nLuciane^sCoutinho de Azevedo Campanella^rND^nAnice^sMilbratz de Camargo^rND^sHenriquebonde^nDébora Delwing Dal Magro^rND^nDaniela^sDelwing de Lima^rND^nLuciane^sCoutinho de Azevedo CampanellaCOCOA AND CLASSICAL MUSIC: EFFECT ON ANXIETY AND ANTIOXIDANT ACTIVITY IN WISTAR RATS
Cacao y música clásica: efecto sobre ansiedad y actividad antioxidante en ratas Wistar
Anice Milbratz de Camargo, Henriquebonde, Débora Delwing Dal Magro, Daniela Delwing de Lima, Luciane Coutinho de Azevedo Campanella
Federal University of Santa Catarina (UFSC), Florianopolis, SC, Brazil. Regional University of Blumenau
(FURB), Blumenau, SC, Brazil. University of Joinville Region (UNIVILLE), Joinville, SC, Brazil.
SUMMARY
The effect of cocoa powder and subchronic exposure to classical music in Wistar rats behavior on an xiety evaluation tests and their antioxidant activity was evaluated. The animals were divided into four groups: control group (CG), cocoa powder group (CPG), music group (MG) and cocoa powder with music group (CPMG). During 15 days, CPG and CPMG received commercial non alkalized cocoa powder daily (66 mg total polyphenols / g of product, by oral gavage), while MG and CPMG were exposed to the music of Mozart (Serenade N.10 in B flat major for woodwinds and bass, "Gran partita" K.361 / 370a, Largo movement, 8:35 mi nutes long). At the end of the experiment, the animals were submitted to elevated plus maze (EPM) and open field (OF) tests, and serum analysis of thiobarbituric acid reactive substances index (TBA RS) and the activity of antioxidant enzymes catalase (CAT), superoxide dismu tase (SOD) and glutathione peroxidase (GSH Px). Ani mals from MG and CPMG groups showed the highest total horizontal locomotion and more time spent at the central area and reduced immobility time at the OF. The TBA RS average of the treated groups were lower than the GC. The average activity of CAT was higher in CPMG than the others, and the average activity of SOD and GSH Px were higher only in CPG and CPMG. We concluded that the treatment with this classical music sho wed mild anxiolytic activity. Both treatments (cocoa and music) improved serum antioxidant status, but the peri pheral activity of different serum enzymes was mainly improved by the cocoa powder.
Key words: Cocoa powder, classical music, anxiety, elevated plus maze, open field, oxidative stress.
RESUMEN.
]]> Se evaluó el efecto de cacao en polvo y la exposición subcrónica a la música clásica sobre el comportamiento de ratas Wistar en pruebas de evaluación de la ansiedad y su actividad antioxidante. Los animales fueron divididos en cuatro grupos: control (GC), cacao en polvo (GCP), música (GM) y cacao en polvo con música (GCPM). Durante 15 días, GCP y GCPM recibieron cacao en polvo comercial no alcalinizado diariamente (66 mg de polifenoles totales / g de producto, mediante una sonda nasogástrica), mientras que GM y GCPM fueron expuestos a la música de Mozart (Serenata N.10 em Si bemol mayor, "Gran Partita" K.361 / 370a, movimiento Largo, 8:35 minutos de du ración). Al final del experimento, los animales fueron some tidos a las pruebas de laberinto en cruz elevado (LCE) y de campo abierto (CA), y el análisis sérica del índice de sustancias reactivas al ácido tiobarbitúrico (TBA RS) y la actividad de las enzimas antioxidantes catalasa (CAT), superóxido dis mutasa (SOD) y glutatión peroxidasa (GSH Px). Los animales GM y GCPM mostraron la mayor locomoción horizontal, más tiempo en la zona central y un tiempo reducido de inmovilidad en el CA. El TBA RS promedio de los grupos tratados fue más bajo que el control. La actividad media de CAT fue mayor para GCPM que los otros, y la actividad media de la SOD y GSH Px fueron mayores sólo en GCP y GCPM. Concluimos que el tratamiento con esta música clásica mostró modesta ac tividad ansiolítica. Ambos tratamientos (cacao y música) mejoraron el estado antioxidante en suero, pero la actividad periférica de diferentes enzimas fue mejorada principalmente por acción del cacao.Palabras clave: Cacao en polvo, música clásica, ansiedad, laberinto en cruz elevado, campo abierto, estrés oxidativo.
Recibido: 07 11 2016 Aceptado: 17 01 2017
INTRODUCTION
Anxiety is an unpleasant emotional state, asso ciated to ill being, discomfort, worry or fear of any defined or undefined future threat. Although it is a na tural reaction to stress, when it is excessive or out of pro portion to the stimulus, it is considered pathological (1). The occurrence of mental disorders, among them an xiety, have increased globally along the years. When analyzed as a group, mental and neurological disorders and also those recurring from substance abuse, these accounts for 13% of worldwide illnesses in the year of 2004 and are, today, the fastest growing health related issues. An amount of 16,3 trillion dollars is estimated to be spent on health problems associated to mental di sorders between the years of 2011 and 2030 (2). Additionally, aggravating this situation are the side effects of the drugs used to treat anxiety, such as: headache, nausea, blurred vision, tachycardia, dizziness, fainting, hypotension, hypertension, diarrhea, drowsiness, in somnia andv
omiting (3).
Faced with these challenges it is both, understanda ble and necessary, to broaden the range of treatment options or complement them, in areas such as phyto therapy, nutrition and diversified complementary the rapies (4). Some foods are of target interest and show good perspectives, but in order for them to be indicated for use, scientific comprobation is necessary.
Cocoa powder, a sub product of the Theobroma cacao L. fruit, shows high levels of bioactive com pounds, taking into consideration that it has a larger proportion of cocoa solids. When it is not alkalized du ring processing it shows significant amounts of polyphenols like flavonoids, epicatechins, catechins, proanthocyanidins and quercetin derivatives, and methylxanthines like theobromine and caffeine (5). Due to its composition, it offers many applications, such as: antioxidant, antiinflammatory, antithromboge nic, fibrinolytic, immunomodulatory and antitumoral (6,7). Although still poorly explored, recent evidence has been found of the antidepressant and anxiolytic ef fects of cocoa. These were found in pre clinical studies through behavioral testing on animals (8 10) and more modestly on humans trials (11). These effects were as sociated to cocoa's complex composition, but mostly due polyphenols.
Music is a complementary therapy that has been used by humanity for thousands of years and scientific studies which indicate music as a therapeutic method for many conditions have emerged (4). Many studies describe that music causes metabolic alterations to the regulation of the hypothalamic pituitary adrenal axis (HPA), the sympathetic nervous system and the im mune system, besides reducing anxiety (12,13). Clas sical music, particularly by Mozart, has demonstrated effects on cortisol levels (14,15), modulation of the HPA axis as well as the immune system (16) in hu mans. Experimental studies with the exposure to music from this particular composer showed reduction of hypertension (17) and anxiety isolatedly in rodents (18) and also when combined with medication (19).
Both, human and animal organisms, respond to physical and psychological stress through behavioral and physiological defenses (13). Growing evidences indicate that oxidative stress plays causal role in the development of anxious behavior on rats (20 23) and due to the fact that cocoa has conferred antioxidant ef fects and as well as classical music it may work as a potential anxiolytic, this study sought toverify the ef fects of an adjoint intervention of these two factors on Wistar rats behavior when submitted to the elevated plus maze (EPM) and also to the open field (OF) tests, anxiety evaluation models, associating it to the peripheral antioxidant defense.
]]> METHODSAnimals
A total of 24 male genetically heterogeneous albino Wistar rats (Rattus norvegicus), 3 to 5 months and weighing 225 g on average (SD = 9 g), were obtained from the animal house of the Regional University of Blumenau. After arrival in thevivarium of the labora tory, these animals were housed individually in opaque plastic cage (0.5 x 0.3 x 0.15 m) with wood shaving bedding and wire mesh tops. They were housed under a standard (12 h/12 h light/dark; cycle lights on at 7:00 AM), in a temperature controlled environment (23 ± 1ºC), with a 50 dB background sound level, and 55±10% relative humidity. During the entire experi mental period, the animals received standard commer cial chow for rodents (Nuvital®) and filtered tap water ad libitum. The room was visited on an average of once every 2 or 3 days for cleaning cages, and to provide food and water. The animals were acclimated to the animal housing facilities for 1 week before the experi ments began. This study was approved by the univer sity Ethics Committee for Animal Research (CEUA) by the protocol No. 125/14. The experiments were per formed in compliance with the recommendations of thebrazilian Society of Neuroscience and Behavior (SBNeC), which arebased on the United States Natio nal Institutes of Health Guide for Care and Use of La boratory Animals.
Treatment
The animals were divided into four groups: control group (CG), cocoa powder group (CPG), music group (MG) and cocoa powder with music group (CPMG); each comprising six animals. During the intervention period, which lasted 15 days, the animals of CPG and CPMG groups received once a day, between 12:00 and 1:00 PM daily, non alkalized cocoa powder solubili zed in water (by oral gavage). The commercial non alkalized cocoa powder (natural) (66 mg total polyphenols / g of product) was purchased from Brazilcoa® and has its origins in thebrazilian states of Bahia, Espírito Santo and Rondônia. Each animal re ceived 2.5 mL of solution containing 134 mg of cocoa powder / kg of animal weight, diluted in water at a ratio of 0.03 g: 2.47 mL (cocoa powder : water). The solution was daily prepared immediately prior to ad ministration and with the aid of a magnetic stirrer at 625 rpm (Quimis® model Q261 2) and a precision ba lance (Marte Científica® model AS1000). The solution contains about 8.86 mg total polyphenols / kg body weight, the minimal dose at which changes were observed in behavioral tests (8). The CG and MG ani mal groups received 2.5 mL of placebo (by oral gavage) containing corn starch in replacement of the cocoa powder. The chemical composition of both so lutions is presented in Table 1. Corn starch was used as placebo to ensure that the infusion time (gavage) was the same for control and treatment groups, giving density to the solution. This was an important consi deration as the gavage procedure can generate cause stress to the animals.

The rats of MG and CPMG groups were exposed to classical music for 5 hours / day between 1:00 and 6:00 PM, during the 15 days of trial. Mozart's music (Serenade N.10 in B flat major for woodwinds and bass, "Gran partita" K.361 / 370a, Largo movement, 8:35 minutes long) was continuous and repeated in a CD player (compact disc) (19). The speaker had a fre quency range of 100 16000 Hz and the music room had a sound level of 65 75 dB. The silent room where the animals of CG and CPG groups stayed had no music and its sound level was 50 dB (ambient noise).
Body weight and food intake
The animals body weight was measured on the first and last day of the intervention and food consumption was measured three times a week on alternate days and then, the weekly average was calculated. In both pro cedures, a precision scale was used (Marte Científica® model AS1000).
]]> Behavioral testsOn the last day of intervention all animals were in dividually subjected to the EPM and OF tests in a sound isolated room, during the light phase of the cycle (between 1:00 and 4:00 PM). To minimize possible cir cadian influences, the experimental and control observations were alternated. The observer stayed in the same room approximately one meter away from each apparatus and recorded the tests with a video camera (Panasonic® PV GS150 model) for later behavioral analysis (24,25). The tests were con ducted under dim red light (44 lux).
Elevated plus maze test
The apparatus consisted of two open arms (0.5 x 0.1 m) and two closed arms (0.5 x 0.1 x 0.4 m) arranged such that the two arms of each type were op posite to each other, with a central plat form (0.1 x 0.1 m). The height of the maze was 0.5 m. The animals were ex posed for 5 min to the red light in their own home cages before the testing pro cedure. They were then individually placed on the central platform of the elevated plus maze facing an open arm. During a 5 min test period the animal behavior was recorded and the follo wing parameters were registered: time spent in open arms and the percentage of time spent in the open arms relative to the total time in the arms; number of entries into the open arms; percentage of open arm entries compared to total entries; time spent in the closed arms; number of entries into the closed arms and risk assessment (25). Risk assessment is a measure that accounts for the time spent head dipping (i.e., exploratory movements of the head/and shoulders over the side of the maze) and in a stretched attend pos ture (i.e., exploratory posture in which thebody is stret ched forward and then retracted to the original position without any forward locomotion). The measures that reflect anxiety likebehavior in this test are the entries into the open arms vs. closed arms and time spent on the open arms vs. closed arms. The anxiety behavior in this test is triggered by the high of the maze which evoke a greater strength of fear. The fear induces an avoidancebehavior, which in turn makes the animals prefer the closed arms (25). We also included etholo gically derived measures related to the defensive pat tern of risk assessment behavior, which has been shown to bevery sensitive to changes in anxiety (19, 26).
Open field test
The OF consisted of a black uncovered circular box (0.6 m diameter, 0.50 m height). Each rat was placed in the central area and allowed to freely explore the ap paratus for 5 min, being filmed during this time. Sub sequently we recorded the total ambulation time (i.e., movement from one location to another); total horizon tal locomotion, estimated by the number of squares crossed (every timeboth hind paws entered one square, a crossing was recorded); peripheral area ambulation time; peripheral area crossings; central area ambulation time; percentage of time spent in central area compa red to total ambulation time; crossings made to the cen ter of the field and percentage of crossings made to the center of the field in relation to total horizontal loco motion. Time spent immobile (i.e., completely immo bile), time spent rearing (the rat stood on its hind paws with its body at greater than a 45° angle to the floor) and time spent grooming (i.e., repetitive movements of the front paws or mouth on the fur) were also recorded. The measures that reflect anxiety likebehavior in this test are shorter horizontal locomotion (number of cros sings); greater time spent in the peripheral area; redu ced ambulation time; reduced central area ambulation time; and greater immobility time. The anxiety behavior in this test is triggered by the fact that it is an in dividual testing (the animal is apart from its group) and the area is very large in relation to the animal’s bree ding or natural environment, which is why they prefer the peripheral area, close to the wall. Anxiolytic treat ments decrease the stress induced inhibition of explo ratory behavior (24).
Antioxidant activity analysis
At the end of the experiments the animals were sacrificed by decapitation with guillotine (Insight® model EB271). Erythrocytes and plasma were prepared from wholeblood samples obtained from the rats. Wholeblood was collected and transferred to heparinized tubes for erythrocyte separation. Blood samples were centrifuged at 1,000×g (Luguimac® model LC 10), and plasma was removed by aspiration and frozen at – 80 °C until determination of thiobarbituric acid re active substances (TBA RS). Erythrocytes were was hed three times with cold saline solution (0.153 mol/L sodium chloride). Lysates were prepared by the addi tion of 1 mL of distilled water to 100 μL of washed erythrocytes and frozen at – 80 °C until determination of the antioxidant enzyme activities. For antioxidant enzyme activity determination, erythrocytes were fro zen and thawed three times and centrifuged at 13,500×g for 10 minutes. The supernatant was diluted in order to contain approximately 0.5 mg / mL of pro tein. TBA RS was measured following Ohkawa et al. method (27) and was determined by the absorbance in spectrophotometer (Metrolab® model 325 DB) at 535 nm. The results were expressed as nanomole of malon dialdehyde formed per milligram of protein. Catalase activity assay (CAT) was determined according Aebi method (28). Hydrogen peroxide (H2O2) disappea rance was continuously monitored with a spectropho tometer at 240 nm for 90 seconds. One unit of the enzyme is defined as 1 μmol of H2O2 consumed per minute, and the specific activity is reported as units (U) per mg of protein. Glutathione peroxidase activity assay (GSH Px) was determined by the method of Wendel (29), with some modifications. Tert butylhy droperoxide was used as substrate. Nicotinamide ade nine dinucleotide phosphate (NADPH) disappearance was continuously monitored with a spectrophotometer at 340 nm for 4 minutes. One GSH Px unit is defined as 1 μmol of NADPH consumed per minute, and spe cific activity is reported as units per mg of protein. Su peroxide dismutase assay (SOD) was determined by the pyrogallol auto oxidation method, as described by Marklund (30). The self oxidation of pyrogallol was continuously monitored with a spectrophotometer at 420 nm. The specific activity was expressed as unit per mg of protein. Protein determination was performed by the method of Lowry et al. (31), using bovine serum albumin as the standard.
Statistical analysis
The variables were expressed as means and stan dard deviations. The determination of the differences between the experimental groups was performed using analysis ofv ]]> ariance (ANOVA), two tailed (food intake and body weight) and one tailed (other variables), with Tukey Kramer post test (for parametric data) or Krus kal Wallis test (for non parametric data). The Normality of variable distribution was assessed by Kolmogorov Smirnov test. All tests were performed with the software Statistic (StatSoft Inc®, version 6.0). Differences with p <0.05 were considered significant.
RESULTS
Effects of treatment on body weight and food intake
No significant alterations were observed in body weight, percentage of gained weight and weekly food intake. The food intake of the first and second weeks of trial did not differ from each other (data not shown).
Effects of treatment on behavior in the EPM and OF
No statistical differences were observed between groups in the parameters analyzed in the EPM test. The ANOVA revealed significant differences for some of the OF test variables (table 2). A larger number of peripheral crossings was verified for the CPMG and MG groups when compared to CG (p=0,035), even though the ambulation time in the peripheral area did not differ among the groups (p=0,161). Likewise, ani mals of CPMG and MG groups spent more time am bulating in the central area of the field than CPG and CG (p=0,003). The animals exposed to music and also those with the combination of music and cocoa showed higher percentage of time ambulating in the central area regarding the total ambulation time in relation to CPG and CG (p=0,007). Nevertheless, the number of crossings made to the central area did not differ bet ween the animals (p=0,061). The total horizontal loco motion (total number of crossings) performed by the CPMG and MG groups was greater than CG (p=0,025), and the average of this locomotion measure traveled by CPG was statistically the same as CG. The CPMG showed a total ambulation time higher than the GC group while the CPG and MG groups showed ave rage values equal to control (p=0,028). Considering the ethological measures analyzed, a significant decrease of immobility time was found in CPMG and MG groups when compared to the CG (F = 4,35; p=0,016) (Figure 1).


Serum concentrations of antioxidant markers and oxidative damage analysis at the end of the experiment (Figure 2) revealed that averages of TBA RS were inferior for the animals of CPMG, CPG and MG groups (F = 50,45; p<0,001) (Figure 2A). As to enzymatic activity, the average ac tivity of CAT was statistically superior for the CPMG group when compared to all the other groups (F= 6,73; p=0,002) (Figure 2B). The averages of GSH Px (F= 11,95; p<0,001) (Figure 2C) and SOD (F= 19,82; p<0,001) (Figure 2D) were superior for the CPMG and CPG groups when compared to the control.

DISCUSSION
In this study, the cocoa treatment as sociated or not to classical music did not cause alterations in body weight gain or animal food intake. Likewise, other authors did not verify changes to these variables when the same dose of polyphenols used in this study were administered (8,86 mg/kg) through cocoa polyphenolic extract (8). The cocoa mass treatment (250 mg/kg weight/day) also did not show al terations in body weight (10).
Regarding the EPM test, this study differs from one of our previous works using Mozart music in combina tion with medication (simvastatin), in which we observed an adjuvant effect of the interventions in reducing anxiety (19). A recent study published in pertinent lite rature may explain such differences in these results. Ac cording to Attoui et al. (18), when the animals were exposed to auditory stress (105 dB) and/or to predator odor for 10 minutes/day, during 7 days, associated to Mozart’s music 10 minutes before the EPM test, there was a reversion in the anxiety behavior and also a re duction in the levels of the adrenocorticotropic hor mone (ACTH) of the stressed rats, independent to the kind of stress to which they were submitted. It is believed that as the animals in this present study were not exposed to stress stimuli, there was no hormonal dere gulation to be reverted by the treatment with music, if we consider this the mechanism of action. However, it is relevant to emphasize that there were significant dif ferences in the OF test variables; an anxiety behavior model with different peculiarities regarding action me chanisms. Therefore, the necessity of applying not only one paradigm to evaluate stress or emotional anxiety to behavior studies is reinforced. During OF testing a new environment is used to determine general anxiolytic be havior and mobility levels in this paradigm serve as fi gures for a similar state of anxiety in rats, possessing sensitivity to serotonergic and benzodiazepine routes of action (acting on the inhibitory neurotransmitter GABA Gamma Aminobutyric acid) (24).
Either as a separate treatment or associated with cocoa powder, the classical music treatment promoted an increase in the total horizontal locomotion in the OF and also the horizontal peripheral locomotion, but did not affect the time spent in this region. It is also impor tant to highlight that both treatments significantly in creased the time spent in the central area of the field, and also the percentage of time spent in this area when compared to total ambulation time, which represents a rupture in the natural tendency of the rodents of moving to the peripheral area (24). In agreement to these results, it was found that the CPMG and MG groups had significant reduction in immobility time, when compared to CG.
Taking into account the results seen in the OF test and that we saw no differences in the animals behavior at the EPM, it is possible to indicate a mild anxiolytic effect associated with an exploratory activity stimula tion, because as said before, anxiolytic treatments de crease the stress induced inhibition of exploratory behavior at the OF (24). It is believed that this effect may be attributed mainly to classical music exposition, considering the results from CPMG and MG groups were similar, with exception to the total ambulation time (higher than the control group only in the associa ted treatment of cocoa powder and classical music). Si milar results were found in a study in which classical music in combination with simvastatin increased the ambulation time and total horizontal locomotion, also reducing the animal’s immobility time (19).
There isn't a consensus regarding the appreciation of music by animals, however this determination is not necessary, taking into account that many mechanisms used to test its effect on anxiety and stress have already been reported in the literature. Mozart's music increases dopamine (excitatory neurotransmitter) synthesis in thebrain. This is due to its high frequency accentuated sounds (4000 a 16000 Hz) compared to other classical music composers, endowing rats with greater neu rophysiologic effects, confirmed through alterations in autonomic responses such as blood pressure (17). Fur thermore, music also significantly activates various subcortical regions in humans, including the nucleus accumbens (NAc, cerebral area that plays a significant role in processing of motivation, pleasure, reward and reinforcement), the ventral tegmental area (VTA, processes reward when it receives dopamine) and the hypothalamus (region of thebrain that modulates autonomous responses such as cardiac frequency and bre athing, which alter when exposed to pleasant musical sounds). The elevated dopamine release in the vTA and NAc may be the neurochemical mechanism which can explain the reward feelings brought by music (16, 32). The stimulus of structures such as the amygdala, cor tex, hippocampus and hypothalamus by music and the way thebrain's attention channels are affected by soo thing auditory stimuli in a significant and distractive manner are also mentioned explanations (13). In addition to the previous consideration, a musical approach has shown regulatory effects on the HPA axis, by reducing the levels of ACTH in stressed rats (18), reducing salivary cortisol levels in humans under pre competition stress (15), as well as in the absence of stress (14). Stress shows consequences such as high blood pressure and endocrinal responses which lead to specific hormone release and also the activation of the sympathetic nervous system for the "fight or flight" res ponse, besides an immune response, showing alteration in markers such as Immunoglobulin A, interleukins (IL) 1,6 and 10 (13). The "fight or flight" response may be triggered by mental activity such as anxiety, stress, depression and feelings of despair. As previously dis cussed, music reduces stressful and anxious behavior (13) and it eases some of these systemic markings (not only the ACTH and cortisol), with the reduction of epi nephrine and IL 6 and also the elevation of the growth hormone (GH) in humans. It appears that this effect of music concerns neuroendocrine immune routes of ac tion (12,16).
]]> In this study, besides the fact that the cocoa powder treatment did not provoke a statistically significant mo dification in animal behavior, it is important to note that, even not significantly different of control, it in creased the average of peripheral crossings as well as the total ambulation time reducing the animal's time of immobility. It is noteworthy that only the group which received cocoa powder in association with music de monstrated a greater total ambulation time compared to the control group. It is possible that there may havebeen an adjuvant effect between the treatments, which did not manifest statistically when they wereboth con ducted in an isolated manner. Pertaining the usage of the cocoa powder, aspects such as thebioavailability of the polyphenolic compounds, compromised by the food matrix, interaction with diet constituents, genetic factors, microbiota metabolism and the enzymatic ac tivity of the colon (7) should be taken into account, since the intake of the same dosage of total cocoa poly phenols caused behavioral alterations to rats in a previous study (8).The use of cocoa in anxiety reduction is supported by the literature invarious courses of action. Because its bioactive compounds are elevated, it is believed that there may be a synergetic action between the compo nents in the production of the anxiolytic effect (10). Cocoa polyphenols havebeen associated to elevation in the monoaminergic neurotransmitters, similarly to antidepressant drugs. As evidenced in the work of Ya mada et al. (10) when chronically administered (14 days), the cocoa mass (100 mg/ kg weight) led to a ten dency, not significant, of increase in the total distance traveled in the OF (similar to the results in this study), a behavior which was associated to greater concentra tion of serotonin in the cortex, hippocampus and amyg dala. Messaoudi et al. (8) verified a smaller time of immobility of the animals submitted to forced swimming test when using cocoa polyphenol extract (24 mg/kg weight) for 14 days, however, no changes in the OF test. Such behavioral effect has been suggested to the quercetin (flavonoid), for acting in a similar manner to selective serotonin reuptake inhibitors drugs such as tricyclic antidepressant.
Considering the existence of a direct correlation between oxidative stress and anxiety, thebrain's high susceptibility to oxidative stress and the already proven antioxidant efficiency of cocoa, it is possible that this may also be a way of reducing anxiety. When Sabogal Guaquetá et al. (9) administered quercetin (flavonoid present in cocoa) to rats (25 mg / kg), they were able to reverse the main histopathological markers of cog nitive and emotional dysfunction, besides demonstra ting anxious behavior reduction in the EPM test. Evidences that oxidative stress plays a causal role in the development of anxious behavior in rats has in creased, as well as the evidences that an antioxidant in tervention may revert such effects (23). The gene expression of antioxidant enzymes is different for an xious and non anxious rats in specific cerebral regions (20), just as oxidative stress provokes an imbalance to antioxidant enzyme activity in the hippocampus asso ciated to the anxious behavior in rats during the OF test (21). The same imbalance to the antioxidant defense was verified beyond the CNS, in many psychiatric di sorders (among which, anxiety) (22). In spite of the fact that cocoa has an already established role in antioxidant defense improvement, the same does not apply to clas sical music, once no work in the literature has directly evaluated peripheral antioxidant activity with this tre atment, within our knowledge.
In this study, all interventions, either associated or isolated, provoked a reduction to TBA RS levels in serum when compared to the control group (Figure 2A). The malondialdehyde, a secondary product of lipid peroxidation, reacts to the TBA and is measured colorimetrically through the TBA RS test (27). It was found that the cocoa powder, Mozart’s music and its as sociation reduced plasmatic lipid damage. Cocoa pow der itself contribute to a reduction in LDL cholesterol and the suppression of oxidized LDL in humans (6). The efficiency with which the polyphenols are incor porated to LDL surface, thus increasing the resistance of this particle to both oxygen radicals and chelating transitional metal ions, is an exogenous antioxidant me chanism suggested for such compounds (6). Furthermore, endogenous antioxidant activity was also altered by treatments with cocoa powder and clas sical music, verified through the increase of enzymatic activity in serum. The average activity of the CAT enzyme was statistically superior only for the group treated with cocoa powder and concurrently exposed to music (Figure 2B). The average activity of the GSH Px (Figure 2C) and the SOD (Figure 2D) enzymes were superior for the groups CPMG and CPG when compared to the others, which demonstrates an inhe rent effect of the cocoa powder. A cocoa powder enri ched diet elevated SOD and CAT activity in young rats in a work of Ramiro Puig et al. (33). Considering that the increase in CAT activity in our study was exclusive to the CPMG group, the existence of a common or synergetic mechanism between the interventions (cocoa and classical music) is probablebut still unex plored by science. In addition to this, the treatment with music reduced lipid peroxidation of the animals, pro bably through indirect mechanisms. A possible path way is the modulation of the HPA axis activity induced by Mozart’s music, because this has multiple systemic effects on stress markers (13) and thebalancebetween oxidation and antioxidation is affected by signs of the neuroendocrine stress response system (34).
CONCLUSIONS
In this study, we concluded that the cocoa powder, in the adopted dosage and used isolated, did not cause significant changes to animal behavior. Nevertheless, it did infer a tendency to a mild anxiolysis effect when combined to Mozart’s classical music. The treatment with classical music by itself did demonstrate a mild anxiolytic effect. Both treatments (cocoa powder and classical music) improved the serum antioxidant status. In view of the above, it is believed that the constituents of cocoa powder (specially the polyphenols) and Mo zart’s classical music may have acted together on the improvement of the antioxidant response and, possibly through this, on the anxious behavior of rats. This field of work needs further investigation in order to investi gate the correlation between oxidative stress and an xiety. A larger dose of cocoa is recommended in order to consider thebioavailability of the polyphenolic com pounds in the food matrix. Morebehavioral tests and also verification of antioxidant activity in structures of the central nervous system are recommended.
REFERENCES
1. Castillo ARGL, Recondo R, Asbahr FR, Manfro GG. Transtornos de ansiedade. Rev Bras Psiquiatr. 2000; 22 Suppl 2: 20 3. [ Links ] Portuguese.
2. World Health Organization [internet]. Mental health ac tion plan 2013 2020. 2013. http://apps.who.int/iris/bitstream/10665/89966/1/9789241506021_eng.pdf . Accessed 17 May 2015.
]]>3. Lopes LMB, Grigoleto ARL. Uso consciente de psico trópicos: responsabilidade dos profissionais da saúde. Bras J Health. 2011; 2(1): 1 14. [ Links ] Portuguese.
4. Kessler RC, Soukup J, Davis RB, Foster DF, Wilkey SA, Rompay MIV et al. The Use of Complementary and Alternative Therapies to Treat Anxiety and Depres sion in the United States. Am J Psychiatry. 2001; 58(2): 289 94. [ Links ]
5. Li Y, Fenga Y, zhua S, Luob C, Maa J, zhonga F et al. The effect of alkalization on thebioactive and flavor related components in commercial cocoa powder. J Food Compost Anal. 2012; 25(1): 17 23. [ Links ]
6. Baba S, Natsume M, Yasuda A, Nakamura Y, Tamura T, Osakabe N et al. Plasma LDL and HDL Cholesterol and Oxidized LDL Concentrations Are Altered in Normo and Hypercholesterolemic Humans after In take of Different Levels of Cocoa Powder. The J Nutr. 2007; 137(6): 1436 41. [ Links ]
7. Lamuela Raventós RM, Romero Pérez AI, Andrés La cueva C, Tornero A. Review: Health Effects of Cocoa Flavonoids. Food Sci Technol Int. 2005; 11(3): 159 76. [ Links ]
]]>8. Messaoudi M, Bisson JF, Nejdi A, Rozan P, Javelot H. Antidepressant like effects of a cocoa polyphenolic ex tract in Wistar Unilever rats. Nutr Neurosci. 2008; 11(6): 269 76. [ Links ]
9. Sabogal Guáqueta AM, Muños Manco JI, Cortes Ren dón N, Ramirez Pineda JR, Lamprea Rodriguez M, Osorio Durango E et al. Flavonoides como estrategia terapéutica en neurodegeneración: hallazgos y retos.v
itae. 2014; 21(1): Suppl S:26 27. Spanish.
10. Yamada T, Yamada Y, Okano Y, Terashima T, Yoko goshi H. Anxiolytic effects of short and long term ad ministration of cacao mass on rat elevated T maze test. J Nutr Biochem. 2009; 20(12): 948 55. [ Links ]
11. Pase MP, Scholey AB, Pipingas A, Kras M, Nolidin K, Gibbs A et al. Cocoa polyphenols enhance positive mood states but not cognitive performance: a randomi zed, placebo controlled trial. J Psychopharmacol. 2013; 27(5): 451 8. [ Links ]
12. Yamasaki A, Booker A, Kapurv
, Tilt A, Niess H, Li llemoe KD et al. The impact of music on metabolism. Nutrition. 2012; 28(11 12): 1075 80.
13. Yehuda N. Music and Stress. J Adult Dev. 2011; 18: 85 94. [ Links ]
14. Bartlett D, Kaufman D, Smeltekop R. The Effects of Music Listening and Perceived Sensory Experiences on the Immune System as Measured by Interleukin 1 and Cortisol1. J Music Ther. 1993; 30(4): 194 209. [ Links ]
15. John S,v
erma SK, Khanna GL. The Effect of Music Therapy on Salivary Cortisol as a Reliable Marker of Pre Competition Stress in Shooting Performance. JESP. 2010; 6(2): 70 7.
16. Conrad C, Niess H, Jauch KW, Bruns CJ, Hartl W, Wel ker L. Overture for growth hormone: requiem for in terleukin 6?. Crit Care Med. 2007; 35(12): 2709 13. [ Links ]
17. Akiyama K, Sutoo D. Effect of different frequencies of music on blood pressure regulation in spontaneously hypertensive rats. Neurosci Lett. 2011; 487(1): 58–60. [ Links ]
]]> 18. Attoui N, Bouhali IE, Tayaa H, Habbachi W, Bairi A, Tahraoui A et al. Music Therapy Modulates Combined Predator and Noise Stress Induced Anxiety Likebehavior in Male Wistar Rat. Middle East Journal of Scien tific Research. 2015; 23(3): 374 377.
19. Camargo AM, Lima DD, Dal Magro DD, Seubert JK, Cruz JN, Cruz JGP. Adjuvant effects of classical music on simvastatin induced reduction of anxiety but not ob ject recognition memory in rats. Psychol Neurosci. 2013; 6(3): 403 10. [ Links ]
20. Hovatta I, Tennant RS, Helton R, Marr RA, Singer O, Redwine JM et al. Glyoxalase 1 and glutathione reduc tase 1 regulate anxiety in mice. Nature 2005; 438: 662 6. [ Links ]
21. De Oliveira MR, Silvestrin RB, Mello EST, Moreira JC. Oxidative stress in the hippocampus, anxiety likebehavior and decreased locomotory and exploratory ac tivity of adult rats: effects of sub acutev
itamin A sup plementation at therapeutic doses. Neurotoxicology. 2007; 28(6): 1191 9.
22. Ng F, Berk M, Dean O, Bush AI. Oxidative stress in psychiatric disorders: evidencebase and therapeutic implications. Int J Neuropsychopharmacol 2008; 11(6): 851 76. [ Links ]
]]> 23. Salim S, Sarraj N, Taneja M, Saha K, Tejada Simon MV, Chugh G et al. Moderate treadmill exercise prevents oxidative stress induced anxiety likebehavior in rats. Behav Brain Res. 2010; 208(2): 545 52.
24. Prut I, Belzung C. The open field as a paradigm to me asure the effects of drugs on anxiety likebehaviors: a review. Eur J Pharmacol. 2003; 463(1 3): 03 33. [ Links ]
25. Pellow S, Chopin P, File DE, Briley M.v
alidation of open:closed arm entries in an elevated plus maze as a measure of anxiety in the rat. J Neurosci Methods. 1985; 14(3): 149 67.
26. Carobrez AP, Bertoglio LJ. Ethological and temporal analyses of anxiety likebehavior: the elevated plus maze model 20 years on. Neurosci Biobehav Rev. 2005; 29(8): 1193 205. [ Links ]
27. Ohkawa H, Ohishi N, Yagi K. Assay for lipid peroxides in animal tissues by thiobarbituric acid reaction. Anal Biochem. 1979; 95(2): 351 8. [ Links ]
]]> 28. Aebi H. Catalase invitro. Methods in enzymology. 1984; 105: 121 6.
29. Wendel A. Glutathione peroxidase. Methods Enzymol.1981; 77: 325 33. [ Links ]
30. Marklund SL. Direct assay of superoxide dismutase with potassium superoxide. In: Greenwald RA. Hand book of methods for oxygen radical research. Boca Raton: CRC Press; 1985. p.249−55. [ Links ]
31. Lowry OH, Rosebrough NJ, Farr AL, Randall RJ. Pro tein measurement with the folin phenol reagent. J Biol Chem. 1951; 193: 265 7. [ Links ]
32. Menonv
, Levitin DJ. The rewards of music listening: response and physiological connectivity of the meso limbic system. Neuroimage. 2005; 28(1): 175 84.
33. Ramiro Puig E, Urpí Sardà M, Pérez Cano FJ, Franch A, Castellote C, Andrés Lacueva C et al. Cocoa enriched diet enhances antioxidant enzyme activity and modulates lymphocyte composition in thymus from young rats. J Agric Food Chem. 2007; 55(16): 6431 8. [ Links ]
34. Spiers JG, Chen HC, Sernia C, Lavidis NA. Activation of the hypothalamic pituitary adrenal stress axis indu ces cellular oxidative stress. Front Neurosci. 2014; 8(456): 1 6. [ Links ]
35. Unicamp. Tabela Brasileira de Composição de Alimen tos. Universidade Estadual de Campinas: Núcleo de Estudos e Pesquisas em Alimentação (BR); 2004. http://www.unicamp.br/nepa/taco/contar/taco_4_edicao_ampliada_e_revisada.pdf?arquivo=taco_4_ver sao_ampliada_e_revisada.pdf . Acessed 07 June 2015.
Recibido: 07 11 2016 Aceptado: 17 01 2017
^rND^sCastillo^nARGL^rND^sRecondo^nR^rND^sAsbahr^nFR^rND^sManfro^nGG^rND^sLopes^nLMB^rND^sGrigoleto^nARL^rND^sKessler^nRC^rND^sSoukup^nJ^rND^sDavis^nRB^rND^sFoster^nDF^rND^sWilkey^nSA^rND^sRompay^nMIV et al^rND^sLi^nY^rND^sFenga^nY^rND^szhua^nS^rND^sLuob^nC^rND^sMaa^nJ^rND^szhonga^nF et al^rND^sBaba^nS^rND^sNatsume^nM^rND^sYasuda^nA^rND^sNakamura^nY^rND^sTamura^nT^rND^sOsakabe^nN et al^rND^sLamuela^nRaventós RM^rND^sRomero^nPérez AI^rND^sAndrés^nLa cueva C^rND^sTornero^nA^rND^sMessaoudi^nM^rND^sBisson^nJF^rND^sNejdi^nA^rND^sRozan^nP^rND^sJavelot^nH^rND^sYamada^nT^rND^sYamada^nY^rND^sOkano^nY^rND^sTerashima^nT^rND^sYoko^ngoshi H^rND^sPase^nMP^rND^sScholey^nAB^rND^sPipingas^nA^rND^sKras^nM^rND^sNolidin^nK^rND^sGibbs^nA et al^rND^sYamasaki^nA^rND^sBooker^nA^rND^sKapurv,^nTilt A^rND^sNiess^nH^rND^sLi^nllemoe KD et al^rND^sYehuda^nN^rND^sBartlett^nD^rND^sKaufman^nD^rND^sSmeltekop^nR^rND^sJohn^nS^rND^sVerma^nSK^rND^sKhanna^nGL^rND^sConrad^nC^rND^sNiess^nH^rND^sJauch^nKW^rND^sBruns^nCJ^rND^sHartl^nW^rND^sWel^nker L^rND^sAkiyama^nK^rND^sSutoo^nD^rND^sAttoui^nN^rND^sBouhali^nIE^rND^sTayaa^nH^rND^sHabbachi^nW^rND^sBairi^nA^rND^sTahraoui^nA^rND^sCamargo^nAM^rND^sLima^nDD^rND^sDal^nMagro DD^rND^sSeubert^nJK^rND^sCruz^nJN^rND^sCruz^nJGP^rND^sHovatta^nI^rND^sTennant^nRS^rND^sHelton^nR^rND^sMarr^nRA^rND^sSinger^nO^rND^sRedwine^nJM^rND^sDe^nOliveira MR^rND^sSilvestrin^nRB^rND^sMello^nEST^rND^sMoreira^nJC^rND^sNg^nF^rND^sBerk^nM^rND^sDean^nO^rND^sBush^nAI^rND^sSalim^nS^rND^sSarraj^nN^rND^sTaneja^nM^rND^sSaha^nK^rND^sTejada^nSimon MV^rND^sChugh^nG et al^rND^sPrut^nI^rND^sBelzung^nC^rND^sCarobrez^nAP^rND^sBertoglio^nLJ^rND^sOhkawa^nH^rND^sOhishi^nN^rND^sYagi^nK^rND^sAebi^nH^rND^sWendel^nA^rND^sMarklund^nSL^rND^sLowry^nOH^rND^sRosebrough^nNJ^rND^sFarr^nAL^rND^sRandall^nRJ^rND^sMenonv^n, Levitin DJ^rND^sRamiro^nPuig E^rND^sUrpí^nSardà M^rND^sPérez^nCano FJ^rND^sFranch^nA^rND^sCastellote^nC^rND^nAndrés^sLacueva C^rND^sSpiers^nJG^rND^sChen^nHC^rND^sSernia^nC^rND^sLavidis^nNA^rND^nJane Laner^sCardoso^rND^nAdriana^sNishimoto Kinoshita^rND^nThiele de Cássia^sLibardoni^rND^nViviane Gabriela^sNascimento^rND^nClaudio^sLeone^rND^nJane Laner^sCardoso^rND^nAdriana^sNishimoto Kinoshita^rND^nThiele de Cássia^sLibardoni^rND^nViviane Gabriela^sNascimento^rND^nClaudio^sLeone^rND^nJane Laner^sCardoso^rND^nAdriana^sNishimoto Kinoshita^rND^nThiele de Cássia^sLibardoni^rND^nViviane Gabriela^sNascimento^rND^nClaudio^sLeoneCrescimento alcançado e estado nutricional de escolares
Jane Laner Cardoso, Adriana Nishimoto Kinoshita, Thiele de Cássia Libardoni, Viviane Gabriela Nascimento, Claudio Leone.
Universidade Federal de Santa Catarina. Universidade Paulista. Universidade de São Paulo. Brazil
RESUMO.
O aumento da prevalência do excesso de peso é observado em todas as idades, inclusive nos países em desenvolvimento. O objetivo foi avaliar o crescimento al cançado e o estado nutricional de crianças de duas gerações de escolares: uma no início da idade escolar e outra na tran sição para a adolescência. A análise de amostra, com 1082 crianças, divididas em dois grupos de idade, um grupo de 6 e 7 anos (G1) e o outro de 9 e 10 anos (G2), do Ensino Fundamental da Rede Pública de Florianópolis. Para clas sificação do estado nutricional dos escolares utilizou-se o parâmetro escore z de IMC (zIMC), para crianças com cinco anos e mais (OMS 2007). Foram realizadas análises de tendência central, dispersão e proporções. Os resultados foram: idade média de G1 e G2 foi respectivamente de 6,5 anos, desvio padrão (dp) de 0,31, e de 9,6 anos (dp= 0,26); média de estatura (E) da amostra (escore z de E: 0,25, dp= 1,09) foi superior à do referencial; prevalência de excesso de peso (sobrepeso, obesidade e obesidade grave, juntos) foi de 42,5%. A distribuição dos escolares segundo escore z de IMC, mostrou desvio para a direita, com uma média de zIMC de 0,78 e dp=1,32 (IC95% 0,69 a 0,85), sem di ferença estatística entre G1 e G2. Em conclusão, os esco lares apresentavam em 2012, crescimento adequado de estatura concomitantemente à ausência de desnutrição e a uma prevalência bastante elevada de excesso de peso, o que pode ser atribuído a uma etapa avançada de Transição Nu tricional.
Palavras chaves: Estado nutricional, crescimento, crian ças, escolares, obesidade, transição nutricional.
Attained growth and nutritional status of schoolchildren
SUMMARY.
. The increasing prevalence of obesity is oc curring in all ages, including in developing countries. The objective was to evaluate the achieved growth and nutritio nal status of two groups of schoolchildren from public scho ols: one at the beginning of school age and another in the transition to adolescence. The analysis of sample with 1082 children, divided into two groups according to the age, a group of 6 and 7 years (G1) and the other with 9 and 10 years (G2), from the public elementary schools of Floriano polis. For nutritional status classification of schoolchildren used the parameter z score of BMI (zBMI,) for children with five years and older (WHO 2007). Measures of central ten dency, dispersion and proportions based data analysis. The results were: the average age of G1 and G2 was respectively of 6.5 years (SD= 0.31), and 9.6 years (SD= 0.26); average of attainted growth (z score of height to age - H/A) of the sample (H/A: 0.25, SD= 1.09) was above the benchmark; the prevalence of overweight (overweight, obesity and se vere obesity together) was 42.5%. The z score of BMI dis tribution showed a deviation to the right, with an average of 0.78 and positive z score a SD = 1.32 (95% CI 0.69 to 0.85), without statistical difference between G1 and G2. In con clusion, the schoolchildren showed in 2012 appropriate height growth concomitantly to the absence of malnutrition and a very high prevalence of excess weight, which can re present a late stage of Nutritional Transition.
]]> Key words: Nutritional status, growth, children, students, obesity, nutritional transition.INTRODUÇÃO
A obesidade foi considerada a epidemia do século XXI pela Organização Mundial da Saúde (OMS). O aumento de sua prevalência está sendo observado em todas as faixas etárias, especialmente, nos países em desenvolvimento, caracterizando um importante pro blema de saúde pública, inclusive em crianças (1,2).
O excesso de peso na infância vem aumentando, tanto em países desenvolvidos quanto em desenvolvi mento, nos diferentes níveis socioeconômicos. Estima se que, no mundo, mais de 22 milhões de crianças menores de cinco anos sejam obesas, e que uma em cada dez crianças tenha excesso de peso (3).
Dentre as causas de obesidade estão o fácil acesso aos alimentos de alta densidade energética, a exposição quantidades de gordura, sal e açúcar, embalados ou vendidos em grandes porções. A esses problemas de alimentação se associa o aumento do sedentarismo, de corrente de um maior acesso aos meios de transporte e do aumento de atividades de lazer passivas, como a TV e jogos de computador. Todos esses fatores são citados como motivos para a importante elevação da prevalên cia da obesidade que vem sendo descrita desde o século passado (4,5).
Além disso, tem sido evidenciado que um cresci mento inadequado, intrauterino e/ou na primeira infân cia, poderia predispor ao excesso de peso, sendo que a promoção de um crescimento adequado contribuiria para reduções substanciais na incidência de alterações cardiovasculares relacionadas à obesidade (6). Entre outros fatores relacionados à obesidade está, por exemplo, a predisposição genética. Entretanto as proporções epidêmicas que essa condição vem apre sentando sugere que o ambiente desempenha um papel primordial no aumento da prevalência do excesso de peso como um todo (5).
As transformações sucessivas nos determinantes so ciais ocorridas no Brasil nas três últimas décadas, com o crescimento da renda, a industrialização e mecaniza ção da produção, a urbanização, o maior acesso a ali mentos em geral, incluindo os processados, e a globalização de hábitos, estes nem sempre muito sau dáveis, produziram uma transição nutricional rápida, expondo cada vez mais a população ao risco de doen ças crônicas (7).
A obesidade infantil é um importante fator de risco para a obesidade na idade adulta, e as crianças obesas tendem a ser mais altas do que seus pares com peso normal. Alguns estudos mostram que esse crescimento alcançado elevado não impede que as crianças se tor nem adultos obesos. Alertam que os médicos devem reconhecer o risco de excesso de peso corporal em todas as crianças que têm um IMC elevado, e dar es pecial atenção para aquelas que são altas, porque a sua altura na infância não irá protegê-los do ganho de peso posterior e IMC elevado na idade adulta (8,9). Como Florianópolis, é considerada a capital com mais alta qualidade de vida e a terceira melhor cidade do País para se viver (IDH de 0,847) e que possue pro gramas especiais para manter o cuidado de saúde de suas crianças e, que praticamente 100% delas se en contram na escola, particularmente nas escolas públi cas, optou-se por verificar o perfil epidemiológico do crescimento alcançado e do estado nutricional dos es colares dessa cidade, considerando que estudo possa se aplicar a outras cidades brasileiras que também tenham melhores condições de vida (10).
MATERIAIS E MÉTODOS
Foram coletados dados de 1082 crianças, divididas em dois grupos de acordo com a faixa etária, um grupo de crianças de 6 e 7 anos (Grupo1 - G1) e o outro grupo com crianças de 9 e 10 anos (Grupo2 - G2), do Ensino Fundamental I, de todas as Escolas Municipais e Esta duais, da Rede Pública de Ensino de Florianópolis, identificados a partir das listagens de frequência das classes das escolas. A coleta de dados ocorreu no pri meiro semestre do ano letivo de 2012 e foi realizada nas próprias escolas.
]]> Buscando discriminar uma diferença entre os dois grupos de idade de pelo menos 1/4 de desvio padrão na mediana de escore z do índice de Massa Corporal (zIMC), para um poder de teste de 80% e um α de 5% estimou-se ser necessário um número mínimo de 250 crianças em cada grupo de idade e para cada sexo. A amostragem foi realizada por conglomerados, de maneira probabilística e aleatória, a partir da listagem das classes dos escolares. As classes (unidade amostral) foram sorteadas de maneira sequencial até que o lote amostral estimado de 250 crianças para cada idade e sexo estivesse completo.Para avaliação do peso utilizou-se balança digital da marca CADENCE® Modelo Bal150 (Cachoeira do Sul, RS - Brasil), devidamente calibrada, com capaci dade para 150 kg e subdivisões de 100 gramas, e o re gistro dos valores foi feito até uma casa decimal. Os escolares foram pesados com mínimo de roupa possí vel (somente com calça e camiseta) e descalços, sendo posicionados em pé sobre a plataforma da balança com o peso do corpo igualmente distribuído entre os pés, os braços caídos ao longo do corpo e olhando para frente (11).
Para aferição da estatura utilizou-se um estadiôme tro da marca WISO® fixado à parede, graduado em centímetros , com precisão de uma casa decimal (mm). Os escolares foram medidos eretos, descalços, em po sição ortotática, com o plano de Frankfurt da cabeça horizontalizado, joelhos esticados, pés juntos, braços estendidos ao longo do corpo e com calcanhares, panturrilha, glúteos, omoplatas e dorso da cabeça, manti dos em contato com a superfície plana da parede. Após posicionar o escolar firmemente, deslocou-se a haste móvel do estadiômetro até a parte superior da cabeça e, a medida foi registrada em milímetro (11).
Os valores mensurados de peso e estatura foram transformados em escore z, com base nos valores do referencial da OMS de 200723. Para classificação do estado nutricional dos escolares utilizou-se o parâme tro escore z de IMC (zIMC), segundo o mesmo refe rencial, utilizando as curvas para crianças com cinco anos e mais (12).
A classificação do estado nutricional dos escolares foi feita de acordo com os pontos de corte propostos pelo Ministério da Saúde e OMS para o zIMC (13). Para análise estatística utilizou-se os Softwares SPSS (Statistical Package for the Social Sciences) versão 15.0, MedCalc versão 12.1.4.0 e GraphPad Prism 5, versão 5.04. Foram calculadas fre quências, proporções, médias, desvios padrão e curvas de distribuição. As comparações foram realizadas a partir dos parâmetros de tendência central, dispersão e proporções, pelos testes: t de Student (Mann-Whitney para distribuições não normais), análise de variância (teste de Kruskal-Wallis para distri buições não normais), Qui-quadrado ( 2).
Foram excluídas do estudo as crianças cujos pais e ou responsáveis se negaram a par ticipar do estudo e apresentaram problemas mórbidos que sabidamente têm influência no crescimento, não relacionados diretamente à sua condição nutricional. Foram excluídas 4 crianças: 2 postadoras de síndrome genético, uma com hipotireiodismo e uma nefropata.
A realização deste estudo obedeceu aos princípios éticos para pesquisas com seres hu manos, conforme resolução CNS 196/96, e foi aprovado pelo Comitê de ética em Pesquisa da Faculdade de Saúde Pública da Universi dade de São Paulo e, não apresenta conflito de interesses.
RESULTADOS
A idade média do G1 foi de 6,5 anos, des vio padrão (dp) de 0,31, e do G2 de 9,6 anos com dp de 0,26. Dos escolares da amostra, 50,5% eram do sexo masculino. (Tabela 1)
]]>

No conjunto, a média do escore z de estatura foi 0,25 (dp = 1,09), com diferença estatisticamente signi ficante quando comparada com a média do referencial da OMS (p<0,0001)
Os escores z de estatura dos grupos G1 e G2 foram iguais, respectivamente de zE/I= 0,25 (dp1,08) e zE/I= 0,25 (dp=1,11), p=0,9898 (estatisticamente não signi ficante).
A média de escore z de peso foi maior entre os me ninos (0,79, dp=1,26) em comparação com as meninas (0,64, dp= 1,19), estatisticamente significante (p = 0,047).
A curva de distribuição dos escolares segundo es core z de IMC, mostra desvio para a direita, com uma média de escore z positiva de 0,78 (dp=1,32) e IC95% 0,69 a 0,85. (Figura 2)
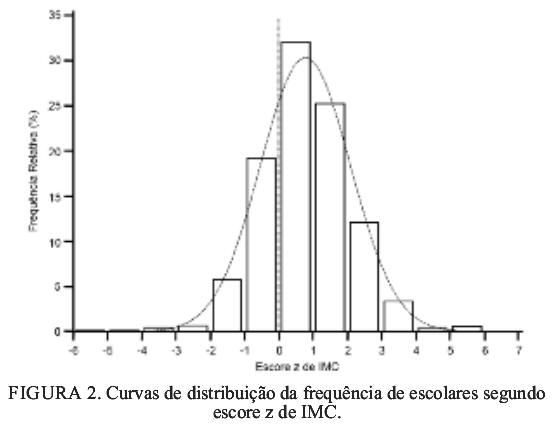

Entretanto esses valores médios de zIMC dos dois grupos de idade (G1 e G2) apresentam diferenças es taticamente significantes diferentes (p<0,0001), com valores médios de seus referenciais por idade. A comparação da distribuição em escore z de IMC dos grupos G1, com zIMC= 0,76 (dp 1,31), e G2, com zIMC= 0,80 (dp 1,33), não mostrou diferença estatis ticamente significante (p=0,6209). A prevalência de excesso de peso dos escolares es tudados (sobrepeso, obesidade e obesidade grave junto) foi de 42,5% (460/1082). Somente a análise da preva lência de obesidade grave por sexo mostrou diferença estatisticamente significante (p<0,05), sendo mais ele vada entre os meninos (Tabela 2).
DISCUSSÃO
Quanto ao crescimento estatural alcançado, os es colares aos 6 anos de idade, apresen tam uma estatura adequada, inclusive em média tendendo a ser superior à proposta pelo referencial da OMS. Esta tendência de crescimento ade quado é a mesma inclusive entre os escolares mais velhos, próximos da idade de início da puberdade (12).
No que diz respeito ao estado nu tricional, verificou-se que a prevalên cia de excesso de peso (sobrepeso, obesidade e obesidade grave) foi 42,5%, muito elevada. A análise em função da idade não mostrou dife rença nos escores z de IMC, com au mento semelhante nas frequências de valores mais elevados de z de IMC em ambos os grupos de idade.
A análise por sexo revelou dife rença apenas na prevalência de obe sidade grave, que foi 2,1 vezes maior entre os meninos.
A prevalência de magreza e a ma greza acentuada somada foram meno res que 2,0%. Essa proporção é inferior à esperada na distribuição de referência para as populações supos tamente normais, o que pode signifi car que entre os escolares, se houver desnutrição, esta condição, por sua frequência, não é mais um importante problema de saúde pública.
O conjunto desses valores revela um crescimento adequado em estatura, uma diminuição acentuada da desnutrição aliados a um aumento importante da pre valência de excesso de peso, o que caracteriza a pre sença de uma fase adiantada de transição nutricional. Com resultados diferentes, Salomons et al. (14), ao investigar o estado nutricional de 1647 escolares com idade entre 6 e 10 anos da rede municipal de ensino de Arapoti, estado do Paraná, mostraram uma prevalência relativamente alta de desnutrição e de excesso de peso, indicando a coexistência de ambos os problemas, mos trando um quadro de transição epidemiológica inicial, onde problemas antigos, como a desnutrição, e proble mas mais recentes, como a obesidade ainda coexistem.
Estudo realizado na região Sul do Brasil, com es colares de 8 a 11 anos de idade de escolas urbanas de Pelotas (15), observou prevalências de sobrepeso e de obesidade de 29,8% e 9,1%, respectivamente, compro vando um incremento do excesso de peso nesta região de magnitude que se assemelha à observada em Floria nópolis.
Na região Nordeste do país, em escolas públicas da cidade de Natal, estudo com crianças de 6 a 11 anos de idade encontrou uma prevalência de excesso de peso de 15,6%, valor muito menor do que os observados na região sul do país (16).
]]> Estudo realizado no município de Juiz de Fora, re gião Sudeste, com alunos menores de 10 anos de idade da rede pública, mostrou uma prevalência de desnutri ção, de 5,3% e 6,5% respectivamente para meninas e meninos, segundo os mesmos critérios da OMS, en quanto a prevalência de obesidade neste grupo era de 18% (17).Alguns estudos (18,19), como esta pesquisa, mos tram uma associação entre o crescimento alcançado e a obesidade. Um destes, inclusive sugere que o impacto da estatura quando associado às elevações de IMC na infância, é preditivo de sobrepeso na idade adulta, e re velam que há impacto do crescimento elevado no ex cesso de peso.
Assim, é possível considerar que a transição epide miologica e nutricional está presente praticamente em todas as regiões do Brasil, como mostra a diminuição da prevalência de desnutrição aliada ao incremento da prevalência de excesso de peso, independentemente da fase do processo de transição em que cada região se encontra.
CONCLUSÃO
Como conclusão pode-se deduzir que nas escolas públicas analisadas, as crianças em idade escolar apre sentam um padrão adequado de crescimento em esta tura e, a baixa estatura é inferior ao referencial utilizado. Quanto ao estado nutricional, nessa faixa etá ria as crianças apresentavam prevalência elevada de ex cesso de peso (sobrepeso e obesidade) com ausência de magreza ou magreza acentuada. A obesidade grave aparece com uma prevalência muito elevada quando comparada ao esperado pelo referencial.
Tudo isso indica a necessidade de realizar progra mas de intervenção para prevenção do excesso de peso e suas complicações, presentes e/ou futuras, para a saúde.
Nesse sentido o espaço escolar pode ser um am biente propício para intervenções preventivas, pois concentra grande percentual de crianças, o que pode viabilizar estratégias voltadas para a promoção de há bitos saudáveis. A atuação preventiva nessa faixa de idade pode promover inclusive a diminuição das doen ças crônicas não transmissíveis que afetam a população adulta.
é importante ainda lembrar, que medidas de pre venção e controle de peso nos escolares não podem se restringir exclusivamente ao ambiente da escola, mas também devem se estender aos pais ou responsáveis pelas crianças, uma vez que o ambiente familiar possui uma notável influência nos hábitos de vida e no estado nutricional durante a infância.
REFERÊNCIAS
1. Strauss RS, Pollack HA. Epidemic increase in child hood overweight, 1986 -1998. JAMA. 2001; 286(22): 2845-8. [ Links ]
2. Kelly T, Yang W, Chen CS, Reynolds K, He J. Global burden of obesity in 2005 and projections to 2030. Int J Obes (Lond). 2008, 32(9):1431-7. [ Links ]
3. Dehghan M, Akhtar-Danesh N, Merchant AT. Child hood obesity, prevalence and prevention. Nutr J. 2005; 4:24. [ Links ]
4. Önnerfält J, Erlandsson LK, Orban K, Broberg M, Hel gason C, Thorngren-Jerneck K. A family-based inter vention targeting parents of preschool children with overweight and obesity:conceptual framework and study design of LOOPS- Lund overweight and obesity preschool study. BMC Public Health. 2012, 12:879. [ Links ]
5. Quaioti TCB e Almeida SS. Determinantes psicobio lógicos do comportamento alimentar: uma ênfase em fatores ambientais que contribuem para a obesidade. Psicol USP. 2006; 17(4):193-211. [ Links ]
6. Eriksson J, Forsen T, Tuomilechto J, Osmand C, Barker D. Size at birth, childhood growth and obesity in adult life. Int J Obes Relat Metab Disord. 2001; 25(5):735 40. [ Links ]
7. Matijasevich A, Santos IS, Menezes AMB, Barros AJD, Gigante DP, Horta BL, Barros FC, Victora CG. Trends in socioeconomic inequalities in anthropometric status in a population undergoing the nutritional tran sition: data from 1982, 1993 and 2004 Pelotas Birth Cohort studies. BMC Public Health. 2012;12:511. [ Links ]
8. Stovitz SD, et al. The Interaction of Childhood Height and Childhood BMI in the Prediction of Young Adult BMI. Articles epidemiology. Volume 16 Number 10, 2008.
9. Stovitz SD, et al. Child Height and the Risk of Young Adult Obesity. Am J Prev Med;38(1):74 –77) , 2010 .
10. Portal Brasil. índice de Desenvolvimento Humano. Disponível em http://www.brasil.gov.br . Acesso em: 10 Janeiro, 2016. [ Links ]
11. World Health Organization. Physical status: the use and interpretation of anthropometry. Geneva: WHO; 1995. [ Links ]
12. World Health Organization. Growth reference data for 5-19 years. Disponivel em: http://www.who.int/growthref/en . Acesso em Janeiro, 2016. [ Links ]
13. Brasil. Ministério da Saúde. Departamento de Atenção Básica. Sistema de vigilância alimentar e nutricional. 2009. Disponível em: < http://nutricao.saude.gov.br\\sisvan.php?conteudo=curvas_cresc_oms [2010 Jan 20]>. Acesso em: 10 jul 2011.
14. Salomons E, Rech CR, Loch MR. Estado nutricional de escolares de seis a dez anos de idade da rede muni cipal de ensino de Arapoti, Parana. Rev. Bras.Cinean tropom. Desempenho Hum. 2007;9(3):243-249. [ Links ]
15. Vieira MFA, Araujo CLP, Hallal PC et al. Estado nu tricional de escolares de 1a a 4a séries do Ensino Fun damental das escolas urbanas da cidade de Pelotas, Rio Grande do Sul, Brasil. Cad. Saúde Pública, Rio de Ja neiro. 2008; 24(7):1667-1674. [ Links ]
16. Brasil LMP, Fisberg M, Maranhão HS. Excesso de peso de escolares em região do Nordeste Brasileiro: con traste entre as redes de ensino pública e privada. Rev. Bras. Saúde Matern. Infant, Recife. 2007; 7 (4): 405 412. [ Links ]
17. Rodrigues PA, Marques MH, Chaves MGAM et al. Prevalência e fatores associados a sobrepeso e obesi dade em escolares da rede pública. Ciência & Saúde Coletiva. 2011; 16(Supl. 1):1581-1588. [ Links ]
]]> 18. Freedman DS, at all. Height and Adiposity among Chil dren. Obesity Research. Vol. 12 No. 5 May 2004.19. Dommelen PV, Kroon MLA, C NI, Schonbeck Y, Buu ren S.The Impact of Height during Childhood on the National Prevalence Rates of Overweight. PLOS One, January 2014, vol 9,Issue1, 85769.
Recibido: 10-09-2016 Aceptado: 22-02-201
^rND^sStrauss^nRS^rND^sPollack^nHA^rND^sKelly^nT^rND^sYang^nW^rND^sChen^nCS^rND^sReynolds^nK^rND^sHe^nJ^rND^sDehghan^nM^rND^sAkhtar-Danesh^nN^rND^sMerchant^nAT^rND^sÖnnerfält^nJ^rND^sErlandsson^nLK^rND^sOrban^nK^rND^sBroberg^nM^rND^sHel^ngason C^rND^sThorngren-Jerneck^nK^rND^sQuaioti^nTCB^rND^sAlmeida^nSS^rND^sEriksson^nJ^rND^sForsen^nT^rND^sTuomilechto^nJ^rND^sOsmand^nC^rND^sBarker^nD^rND^sMatijasevich^nA^rND^sSantos^nIS^rND^sMenezes^nAMB^rND^sBarros^nAJD^rND^sGigante^nDP^rND^sHorta^nBL^rND^sBarros^nFC^rND^sVictora^nCG^rND^sStovitz^nSD^rND^sStovitz^nSD]]> ^rND^sSalomons^nE^rND^sRech^nCR^rND^sLoch^nMR^rND^sVieira^nMFA^rND^sAraujo^nCLP^rND^sHallal^nPC^rND^set^nal^rND^sBrasil^nLMP^rND^sFisberg^nM^rND^sMaranhão^nHS^rND^sRodrigues^nPA^rND^sMarques^nMH^rND^sChaves^nMGAM et al^rND^sFreedman^nDS^rND^sat^nall^rND^sDommelen^nPV^rND^sKroon^nMLA^rND^sC^nNI^rND^sSchonbeck^nY^rND^sBuuren^nS^rND^1A01^nRodrigo^sGatica^rND^1A01^nWilma^sYunge^rND^1A01^nCarol^sQuintana^rND^1A01^nMaria Ana^sHelmrich^rND^1A01^nEloina^sFernández^rND^1A01^nAndrea^sHidalgo^rND^1A01^nJessica^sFuentes^rND^1A01^nPamela^sFehrmann^rND^1A01^nClaudia^sDelgado^rND^1A01^nMaría Teresa^sSilva^rND^1A01^nSamuel^sDurán-Agüero^rND^1A01^nRodrigo^sGatica^rND^1A01^nWilma^sYunge^rND^1A01^nCarol^sQuintana^rND^1A01^nMaria Ana^sHelmrich^rND^1A01^nEloina^sFernández^rND^1A01^nAndrea^sHidalgo^rND^1A01^nJessica^sFuentes^rND^1A01^nPamela^sFehrmann^rND^1A01^nClaudia^sDelgado^rND^1A01^nMaría Teresa^sSilva^rND^1A01^nSamuel^sDurán-Agüero^rND^1A01^nRodrigo^sGatica^rND^1A01^nWilma^sYunge^rND^1A01^nCarol^sQuintana^rND^1A01^nMaria Ana^sHelmrich^rND^1A01^nEloina^sFernández^rND^1A01^nAndrea^sHidalgo^rND^1A01^nJessica^sFuentes^rND^1A01^nPamela^sFehrmann^rND^1A01^nClaudia^sDelgado^rND^1A01^nMaría Teresa^sSilva^rND^1A01^nSamuel^sDurán-AgüeroAsociación entre sedentarismo y malos hábitos alimentarios en estudiantes de nutrición
Association between sedentarism and bad dietary habits among nutrition students.
Rodrigo Gatica, Wilma Yunge, Carol Quintana, Maria Ana Helmrich, Eloina Fernández, Andrea Hidalgo,Jessica Fuentes, Pamela Fehrmann, Claudia Delgado, María Teresa Silva, Samuel Durán-Agüero
Facultad de Medicina, Facultad de Ciencias de la Salud, Universidad San Sebastián
RESUMEN
. El sedentarismo se relaciona con disminución a la sensibilidad de insulina y acumulación de tejido adiposo visceral. Lo que sumado a malos hábitos alimentarios, explican en parte el aumento global de sobrepeso y obesidad. En Chile el exceso de peso afecta a 64,4% y el sedentarismo al 88,6% de la población.El objetivo es determinar los niveles de sedentarismo en los estudiantes de la carrera de Nutrición y Dietética y evaluar si existe asociación con sus hábitos alimentarios. Se evaluaron 607 estudiantes de la carrera de Nutrición y Dietética aplicándoles una evaluación antropométrica de peso y talla, una encuesta de evaluación alimentaria y una encuesta de actividad física.Resultados: El porcentaje de mujeres sedentarias fue significativamente mayor que en los hombres (74,3% v/s 40,5%). Además,las mujeres que nunca cenabancasi duplicaron el porcentaje observado en los hombres. Finalmente,al comparar 2 grupos de estudiantes, unocompuesto por los que nunca desayunaban, ni cenaban y otro por los que desayunaban y cenaban todos los días,se determinó que existe asociación entre actividad física y la conducta alimentaria (  2= 10,56; p=0.001)
En este estudio se determinó que los individuos jóvenes sedentarios presentaban un mal comportamiento alimentario que quienes realizaban algún tipo de actividad física. Nuestros resultados sugieren que realizar algún tipo de actividad física se asocia a un mejor patrón de alimentación
Palabras clave: Actividad Física, Hábitos Dietarios, Estudiantes
SUMMARY.
]]> A sedentary lifestyle is associated with decreased insulin sensitivity and accumulation of visceral adipose tissue. Which combined with poor eating habits, explain the overall increase in overweight and obesity. In Chile overweight it affects 64.4% and 88.6% sedentary population. The objective was to determine the levels of sedentarism in Nutrition and Dietetics students’s and evaluate whether there is an association with eating habits. 607 students from Nutrition and Dietetics were evaluated by applying an anthropometric weight and height assessment, a food assessment survey and a physical activity survey.Results: The percentage of sedentary women was significantly higher than in men (74.3% v / s 40.5%), also women who never eat dinner nearly twice the percentage observed in men. Finally, students who performed some type of physical activity had a significantly higher percentage in the frequency of consumption of breakfast and dinner, with respect to sedentary students. Determining an association between physical activity and eating behaviour ( 2= 10,56; p=0.001). This study determined that young sedentary individuals had a worse eating habits than those who performed some type of physical activity. Our results suggest that perform some type of physical activity is associated with better eating pattern.
Key words: Physical Activity, Dietary Habits, Students
Recibido: 10-08-2016 Aceptado: 28-11-2016
INTRODUCCIÓN
El sedentarismo es un importante factor de riesgo para muchas enfermedades relacionadas al estilo de vida. A nivel mundial 1 de cada 3 adultos y 4 de cada 5 adolescentes, no realizan la cantidad ni la calidad de ejercicio diario recomendado (1). La inactividad física(incluso en cortos períodos de tiempo)se ha asociado,a cambios metabólicos, disminución de la sensibilidad a insulina, disminución del metabolismo lipídico postprandial, pérdida de masa muscular y acumulación de tejido adiposo visceral (2). La asociación del sedentarismo con obesidad, también se ha observado con la ingesta excesiva de alimentos, todo lo cual ha llevado a que la obesidad a nivel mundial, se haya duplicado desde la década de los ochenta (3). En este sentido es que el ejercicio y la restricción calórica se utilizan para perder peso corporal. Además, de los efectos beneficiosos de la actividad física sobre el control del peso, la actividad física también mejora los niveles de glicemia en pacientes diabéticos tipo 2 aumentando la captación de glucosa por parte del musculo y equili bra la producción de glucosa hepática (4).
Durante los últimos 50 años, se han realizado estudios que han evaluado los comportamientos alimentarios en niños y adolescentes,estos han concluido que existe una ingesta excesiva de bebidas azucaradas, de comida rápida y una baja ingesta de frutas y verduras (5). Este tipo de comportamiento se asocia con sobrepeso, peor calidad de vida y para solucionar estos los problemas, se suelen aplicar intervenciones nutricionales (6). El sobrepeso y la obesidad constituyen factores de riesgo independientes para enfermedades crónicas, además de asociarse a estigmatización social y baja autoestima. Según la Encuesta Nacional de Salud realizada en Chile el año 2010,el 27,4% de la población adulta presentaba obesidad y 39,3% sobrepeso, afectando el exceso de peso al 67% de la población. Esto representó un incremento del 6% con respecto a la encuesta realizada en el año 2003, (7, 8).Diversos factores, como sedentarismo y hábitos alimentarios, explican esta situación nutricional. En Chile la prevalencia de sedentarismo de tiempo libre, alcanzó en el año 2010 un 88,6% (8) y de acuerdo a la Encuesta nacional de consumo alimentario, la cena es consumida sólo por el 27% de la población (9).Por ello es que, quediversos trabajos tanto en Chile como en el extranjero, se han centrado en los hábitos alimentarios de estudiantes, por considerarlos una población susceptible de adquirir costumbres poco saludables (10,11,12, 13).Se ha reportado que niños y adolescentes que desayunan todos los días presentan un mejor perfil nutricional (5) y que quienes se saltan el desayuno presentan un mayor índice de masa corporal (13). Además, otro estudio ha determinado que existe una asociación inversa entre el sobrepeso y consumo de cena (14). Es por lo anteriormente expuesto, que nuestra investigación se centra en determinar los niveles de sedentarismo en los estudiantes de la carrera de Nutrición y Dietética y evaluar si existe relación con sus hábitos alimentarios.
MATERIAL Y MÉTODOS
Participantes. La muestra estuvocompuesta por 607estudiantes de la carrera de nutrición y dietética de la Universidad San Sebastián.Se encuestaron 175 estudiantes de la sede de Santiago ubicada en la región Metropolitana, 234 estudiantes de la sede Concepción de la octava región, 107 estudiantes de la sede de Valdivia de la décimo cuarta región y 91 estudiantes de la sede Puerto Montt de la décima región. La población incluida en la investigación correspondió a hombres y mujeres mayores de 18 años. La toma de la muestra fue dirigida no probabilística intencional. Los encuestadores fueron docentes que desempeñaban funciones en las diferentes sedes regionales de la universidad. La encuesta se aplicó durante el segundo semestre académico, entre septiembre y diciembre del año 2014, en dependencias de la Universidad San Sebastián,. Los criterios de inclusión fueron hombres y mujeres mayores de 18 años que cursaban alguna asignatura de la carrera de Nutrición y Dietética. Los criterios de exclusión fueron; estudiantes que no respondieron todas las encuestas. A los participantes, se le informó que la consulta tenía carácter investigativo, por lo tanto cada participante firmó un consentimiento informado, dicho documento fue revisado y aprobado por el Comité de ética de la Universidad San Sebastián. Se aseguró la confidencialidad de la información recopilada.
Diseño. El diseño de esta investigación corresponde a un estudio de tipo transversal, descriptivo y comparativo entre hombres y mujeres que estudian la carrera de Nutrición y Dietética, en las diferentes sedes de la Universidad San Sebastián. En este estudio se evalúo mediante el cálculo del índice de masa corporal (IMC)el estado nutricional, los hábitos alimentarios y la actividad física, mediante:
1. Antropometría
]]> Se efectuó una evaluación antropométrica de peso y talla. La determinación del peso se realizó con un mínimo de ropa, utilizando una balanza mecánica (SECA, capacidad máxima de 220 kg precisión en 50 g). La estatura se midió con un tallímetro incorporado a la balanza. Se calculó el índice de masa corporal (IMC) para categorizar el estado nutricional de acuerdo a criterio OMS.2. Encuesta alimentaria
Se realizó una encuesta alimentaria, el instrumento utilizado para la recolección de datos, correspondió a una encuesta denominada “Encuesta sobre hábitos alimentarios” creada por Durán y colaboradores (10). Se realizó una validación del cuestionario por juicio de 25 expertos, a través del método Delphi.El juicio de experto permitió contrastar cada uno de los ítems con la teoría en relación a los hábitos alimentarios de los estudiantes.
La encuesta tuvo por objetivo medir los hábitos alimentarios de los sujetos, fue de auto aplicación, y estaba compuesta por nueve ítems con un puntaje mínimo de 1 y máximo de 5 por pregunta (escala de tipo Likert), que indica la frecuencia de hábitos saludables (consumo de diferentes tipos de alimentos, durante el desayuno y cena).
3. Cuestionario Internacional de Actividad Física
Se aplicó un cuestionario Internacional de actividad física (IPAQ, por sus siglas en inglés) (15), para conocer sobre el tipo de actividad física que los estudiantes realizaban como parte de su vida diaria. Las preguntas se refirieron acerca del tiempo que utilizóla persona siendo físicamente activa en los últimos 7 días.
Análisis estadístico. El análisis de los datos se realizó con el software IBM® SPSS® Statistic 20.0 SPSS, y Microsoft ® Office Excel ® 2013 MSO Part of Microsoft Office. Para la evaluación de los resultados se utilizó estadística descriptiva (número de individuos, frecuencias y porcentajes), tablas de frecuencia y gráficos de barras. Las evaluación de las diferencia en consumo de alimentos según sexo y años de estudio (1-3 año y 4-5 año) se realizó mediante la aplicación de la Prueba de Mann Whittney considerando que la escala de medida de la variables era ordinal (escala tipo Likert del 1 al 5), donde 1 es quién nunca consume y 5 quién consume todos los días. Esta misma técnica estadística se utilizó para evaluar la diferencia en el tipo de alimentos que consumen los estudiantes activos y sedentarios dado que las respuestas están en la misma escala de medida (Likert).
Se comparó a los estudiantes que desayunaban y cenaban todos los días respecto de aquellos que nunca lo hacían, según fueran en un caso activos o sedentarios y en otro caso hombre o mujer. Esta comparación se realizó mediante la aplicación de la prueba Chi Cuadrado de independencia y el cálculo del coeficiente  (phi) que mide el grado de asociación entre las variables categóricas dicotómicas. Las hipótesis de diferencias fueron evaluadas considerando con un nivel de una significancia p ≤0,05
RESULTADOS
La edad promedio de la población encuestada (Tabla 1) fue de 22 años, con un rango que va desde los 18 años hasta los 39 años. El 70,7% de los estudiantes presentaronpeso normal, el 23,6% sobrepeso y solo un 3,3% obesidad. Con respecto, al sexo, el 87,3% de los estudiantes eran mujeres. El 78,9% de los estudiantes se encontraban cursando entre primer y tercer año de la carrera y el restante 21,1% se encontraba entre cuarto y quinto año de la carrera.Este último grupo presentó una frecuencia en el consumo de desayuno significativamente mayor que el grupo de los 3 primeros años de la carrera (Tabla 2). Finalmente, al comparar los hábitos de consumo de desayuno y cena, con respecto al índice de masa corporal (IMC) no se encontraron diferencias significativas (datos no mostrados). Con respecto, a las frecuencias en el consumo del desayuno no se observó diferencia significativa entre hombres y mujeres (Tabla 3). Se determinó que aproximadamente el 20%, tanto de hombres como mujeres, nunca desayunabany el 50% lo realizaba de manera poco frecuente (datos no mostrados).Al comparar las frecuencias de consumo de cena se determinóuna mayor frecuencia en el consumo de los hombres lo que fue estadísticamente significativo (Tabla 3). El 60,8% de las mujeres nunca cenaban, casi el doble que elregistrado entre los hombres. El 19,5% de los hombres cenaban todos los días, un porcentaje mucho mayor que el 8,5% en el caso de las mujeres (datos no mostrados). Además, se determinó que los hombres presentaron una frecuencia de consumo de pescado, significativamente mayor que las mujeres (Tabla 3).
]]> 

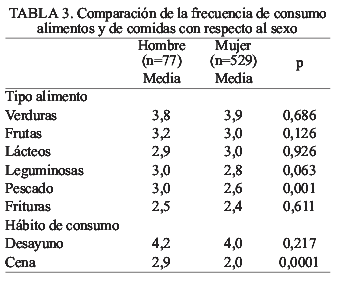
Para determinar si existía alguna asociación entre sexo y hábito alimentario, se seleccionaron sólo los estudiantes que desayunaban y cenaban todos los días (n=45) y se compararon con aquellos estudiantes que nunca desayunaban ni cenaban (n=46). Se determinó que el número de hombresque desayunaba y cenaba todos los días fue significativamente mayor que el valor esperado. Al aplicar la Prueba Chi Cuadrado de Independencia, se determinó que el sexo está asociado con la conducta alimentaria (  = 10,56; p=0,001). Además, basado en el cálculo del coeficiente phi, (
  = -0,24) esta asociación es discreta (Tabla 4).
Posteriormente, los estudiantes fueron agrupados en 2 categorías: estudiantes sedentarios y estudiantes que realizaban algún tipo de actividad física durante la semana (activos). Al comparar los IMC de estudiantes sedentarios con estudiantes activos, no se encontraron diferencias significativas (datos no mostrados). Al analizar el comportamiento de los estudiantes por sede, se determinó que las sedes de Puerto Montt y Concepción presentaron el mayor porcentaje de estudiantes sedentarios (69,7 y 72,5%, respectivamente), diferencia estadísticamente significativa con respecto a las sedes de Santiago y Valdivia (36 y 41,1%, respectivamente) (datos no mostrados). Al comparar la actividad física con respecto al sexo, en las sedes con alto porcentaje de estudiante sedentarios (Concepción y Puerto Montt), las mujeres sedentarias presentaron un porcentaje significativamente mayor que los hombres (74,3% v/s 40,5%). Al analizar en las sedes con bajo porcentaje de estudiante sedentarios (Santiago y Valdivia), nuevamente las mujeres sedentarias presentaron un porcentaje significativamente mayor que los hombres (40,5% v/s 22,5%). (Tabla 5).
Para determinar si existía alguna asociación entre actividad físicay hábito alimentario, se seleccionaron sólo los estudiantes que desayunaban y cenaban todos los días (n=45) y se compararon con aquellos estudiantes que nunca desayunaban ni cenaban (n=46). Se determinó que el número de estudiantes que realizaba alguna actividad física y que desayunaba y cenaba todos los días fue significativamente mayor que el valoresperado.Al aplicar la Prueba Chi Cuadrado de Independencia, se determinó que la actividad física está asociada con la conducta alimentaria (  = 10,56; p=0.001). Además, esta asociación es discreta basadas en el cálculo del coeficiente phi, ( = -0,341) (Tabla 6).


Finalmente, se comparó la frecuencia en el consumo de alimentos saludables (legumbres, pescado, frutas y verduras), de alimentos poco saludables (frituras), de desayuno y de cena entre estudiantes activos y sedentarios. En el grupo de estudiantes activos la frecuencia de desayuno y cena fue significativamente mayor que en el grupo de estudiantes sedentarios.Además, la frecuencia de consumo de legumbres, pescado, frutas y verduras fue significativamente mayor en los estudiantes que realizaban algún tipo de actividad física. Por otro lado, la frecuencia de consumo de frituras fue significativamente mayor en los estudiantes sedentarios (Tabla 7).
DISCUSIÓN
Se determinó que existe una asociación entre sedentarismo ymalos hábitos alimentarios. Sin embargo,no se estableció una asociación entre sedentarismo con IMC, una de las posibles causas es el elevado porcentajede los estudiantes con un IMC normal (70,4%). En cambio, el sedentarismo se asoció conuna menor frecuencia en el consumo de alimentos saludables (frutas y verduras) y con mayor tendencia en saltarse comidas (desayuno y cena). Este patrón se observó más claramente en las mujeres, las cuales presentaron peores hábitos alimentarios y mayor sedentarismo que los hombres. En este mismo sentido, se determinó que la frecuencia del consumo de desayuno fue significativamente mayor en el grupo de estudiantes que desarrollaron algún tipo de actividad física.Diversos estudios apoyan la idea de que el consumo diario de comidas, como desayuno y cena, se asocia con un mejor estado nutricional (5, 13, 14, 15, 16). De hecho, saltarse habitualmente el desayuno es considerado un hábito poco saludable y se relaciona con obesidad, diabetes mellitus tipo 2 y síndrome metabólico (17). Aunque la calidad del desayuno puede variar, se ha reportado que niños y adolescentes que desayunan todos los días presentan un mejor perfil nutricional (5). Otro estudio (13) ha determinado que quienes se saltan el desayuno presentan un mayor índice de masa corporal (IMC). A pesar que no se logró determinar esta asociación, este comportamiento puede implicar que en el futuro,dichos estudiantes sedentarios sean más susceptibles de desarrollar sobrepeso y obesidad.
]]> En esta investigación, la frecuencia en el consumo de cena fue significativamente mayor en los estudiantes activos y además estos presentaron un mayor consumo en frutas, verduras, legumbres y pescado. Lo que concuerda con el estudio publicado el año 2012 por Pedersen y colaboradores, quienes encontraron asociación entre el consumo irregular de cena con una baja frecuencia en el consumo de frutas y vegetales (16).A pesar que en nuestro estudio no encontramos una asociación entre maloshábitos alimentarios y exceso de peso, otro estudio publicado el año 2010 y realizado en niños ha reportado que existe una asociación inversa entre el sobrepeso y consumo de cena (14).Posiblemente, una de las razones por las que no encontramos esta asociación en nuestro estudio, es que el 87% de los encuestados era de sexo femenino, en tanto que el estudio del Yannakoulia presentó un porcentaje de mujeres del 54%. Sin embargo, nuestros datos indican que existe una asociación positivaentre la actividad física y mejores hábitos alimentarios. Lo que se sumaría a los efectos directos de la actividad física (18).De acuerdo a la presente investigación y a investigaciones previas (19, 20),la realización de algún tipo de actividad física durante la semana se relaciona a un estilo de vida más saludable (mejor hábito alimentario). En concordancia con este punto, en esta investigación se pudo determinar que el porcentaje de los hombres que desarrollaban algún tipo de actividad física fue significativamente mayor que en el caso de las mujeres. Datos similares a los observado por Rodríguez y colaboradores (2013),quiendeterminó que la inactividad física, es significativamente mayor en mujeres universitarias que en hombres (21)
En cuanto a los porcentajes de sedentarismo de tiempo libre, este alcanzó el 70%, en las sedes de Puerto Montt y Concepción casi el doble que en las sedes de Santiago y Valdivia. Sin embargo, ambos porcentajes son menores al compararlos con la prevalencia a nivel nacional (7), tanto para el grupo etario de 15 a 24 años (75,6%), como para personas mayores de 25 años (sobre 90%). Esta diferencia regional, se podría explicar en parte por efecto del clima, procedencia de los estudiantes y acceso a instalaciones para practicar deportes. Sin embargo, recientemente un estudio realizado en niños determinóque las diferencias regionales observadas en el comportamiento sedentario, no pueden atribuirse sólo a condiciones ambientales ni socioeconómicas (22). Por lo tanto, sería interesante analizar en mayor profundidad estos datos que permitieran explicar estas diferencias.
La inactividad física es uno de los mayores problemas de la salud pública, debido a que este comportamiento se relaciona con engrosamiento de la íntima en la arteria carótida, síndrome metabólico, cáncer y obesidad (23). A pesar que en este estudio, no se determinó una asociación entre sedentarismo y aumento de peso, otros estudios sí lo asocian con obesidad abdominal(20, 23, 24). Este tipo de obesidad genera citoquinas proinflamatorias que contribuyen con la resistencia a insulina, hiperinsulinemia, diabetes y mayor riesgo de presentar cáncer (24). Este aumento de citoquinas proinflamatorias, también genera disfunción endotelial, lo que se relaciona con ateroesclerosis, hipertensión y enfermedades cardiacas(12).
Diversos estudios han estimado, el aumento en los gastos de los sistemas de salud generados directamente por la obesidad entre 0,7 y 2,8%, (25) y los costos indirectos relacionados con baja productividad y mortalidad temprana (26). Uno de los costos asociados a obesidad más relevantes es la diabetes y dentro de ella la nefropatía diabética. En Chile, el 38,2% de las personas que necesitan ser dializadas son diabéticas, con un costo mensual estimadode 573.000 pesos por persona(27), representando uno de los gastos más relevantes para el servicio de salud público. Es por esto que muchos países, han implementado o están implementando políticas para la prevenciónde la obesidad (28). Dentro de las acciones que ejecutan los gobiernos se encuentran, por ejemplo; la creación de leyes en el etiquetado de alimentos y campañas educacionales tendientes a mejorar el estilo de vida y la alimentación.
CONCLUSIÓN
En el momento de realizar la investigación, la carrera de Nutrición y Dietética estaba conformada principalmente por mujeres y son ellas las que presentaron peores hábitos alimentarios y un mayor porcentaje de sedentarismo. Además, los estudiantes que cursaban los 2 últimos años de carrera, sólo presentaron una mejor frecuencia en el consumo de desayuno, bastante lejos de lo esperado por estudiantes que estaban pronto a titularse. De acuerdo la presente investigación, los estudiantes que realizaban algún tipo de actividad físicapresentaron un mejor patrón alimentario que aquellos sedentarios. Por lo tanto, se sugiere realizar actividades para combatir el sedentarismo y generar discusión en torno a la misión que les corresponde como profesionales encargados de mejorar los hábitos alimentarios de la población.
AGRADECIMIENTOS
A las autoridades de la carrera de Nutrición y Dietética por permitir realizar el estudio
REFERENCIAS
]]>1. Egan B, zierath JR. Exercise metabolism and the molecular regulation of skeletal muscle adaptation. Cell Metab. 2013;17(2):162-84. [ Links ]
2. Pedersen BK, Febbraio MA. Muscles, exercise and obesity: skeletal muscle as a secretory organ. Nat Rev Endocrinol. 2012;8(8):457-65. [ Links ]
3. Fock KM, Khoo J. J Diet and exercise in management of obesity and overweight. Gastroenterol Hepatol. 2013;28 Suppl 4:59-63. [ Links ]
4. Colberg SR, Sigal RJ, Fernhall B, Regensteiner JG, Blissmer BJ, Rubin RR, Chasan-Taber L, Albright AL, Braun B; American College of Sports Medicine; American Diabetes Association. Exercise and type 2 diabetes: the American College of Sports Medicine and the American Diabetes Association: joint position statement. Diabetes Care. 2010;33(12):e147-67. [ Links ]
5. Rampersaud GC, Pereira MA, Girard BL, Adams J, Metzl JD. Breakfast habits, nutritional status, body weight, and academic performance in children and adolescents. J Am Diet Assoc. 2005;105(5):743-60; [ Links ] quiz 761-2.
]]>6. Maughan RJ. Nutritional status, metabolic responses to exercise and implications for performance. Biochem Soc Trans. 2003;31(Pt 6):1267-9. [ Links ]
7. Ministerio de Salud. Encuesta Nacional de Salud ENS Chile 2009-2010.
8. Eduardo Atalah S. Epidemiología de la obesidad en Chile. Rev Med Clin Condes. 2012;23 (2) 117-123. [ Links ] 9. Ministerio de Salud. Encuesta Nacional del Consumo Alimentario. Centro de microdatos. Universidad de Chile. 2011.
10. Durán S, Valdés P, Godoy A, Herrera T. Hábitos alimentarios y condición física en estudiantes de pedagogía en educación física. Rev Chil Nutr. 2014;41(3): 251-259. [ Links ]
11. Goodwin PJ, Stambolic V. Impact of the obesity epidemic on cancer. Annu Rev Med. 2015;66:281-96. [ Links ]
12. Van de Voorde J, Pauwels B, Boydens C, Decaluwé K. Adipocytokines in relation to cardiovascular disease. Metabolism. 2013;62(11):1513-21. [ Links ]
13. Smetanina N, Albaviciute E, Babinska V, Karinauskiene L, Albertsson-Wikland K, Petrauskiene A, Verkauskiene R. Prevalence of overweight/obesity in relation to dietary habits and lifestyle among 7-17 years old children and adolescents in Lithuania. BMC Public Health. 2015;15(1):1001. [ Links ]
14. Yannakoulia M, Ntalla I, Papoutsakis C, Farmaki AE, Dedoussis GV Consumption of vegetables, cooked meals, and eating dinner is negatively associated with overweight status in children. J Pediatr. 2010;157(5):815-20. [ Links ]
15. Serón P, Muñoz S, Lanas F. Levels of physical activity in an urban population from Temuco, Chile. Rev Med Chil. 2010;138 (10):1232-9. [ Links ]
16. Pedersen TP, Meilstrup C, Holstein BE, Rasmussen M. Fruit and vegetable intake is associated with frequency of breakfast, lunch and evening meal: cross-sectional study of 11-, 13-, and 15-year-olds. Int J Behav Nutr Phys Act. 2012 6;9:9. [ Links ]
17. Kutsuma A, Nakajima K, Suwa K. Potential Association between Breakfast Skipping and Concomitant Late-Night-Dinner Eating with Metabolic Syndrome and Proteinuria in the Japanese Population. Scientifica (Cairo). 2014. Vol 2014: 1-9.
]]>18. Marcos A, Manonelles P, Palacios N, Wärnberg J, Casajús JA, Pérez M, Aznar S, Benito PJ, MartínezGomez D, Ortega FB, Ortega E, Urrialde R. Physical activity, hydration and health. Nutr Hosp. 2014;29(6):1224-39. [ Links ]
19. Keski-Rahkonen A, Kaprio J, Rissanen A, Virkkunen M, Rose RJ. Breakfast skipping and health-compromising behaviors in adolescents and adults. Eur J Clin Nutr. 2003;57(7):842-53. [ Links ]
20. Holmbäck I, Ericson U, Gullberg B, Wirfält E. A high eating frequency is associated with an overall healthy lifestyle in middle-aged men and women and reduced likelihood of general and central obesity in men. Br J Nutr. 2010;104(7):1065-73. [ Links ]
21. Rodríguez F, Palma X, Romo A, Escobar D, Aragú B, Espinoza L, McMillan N, Gálvez J. Eating habits, physical activity and socioeconomic level in university students of Chile. Nutr Hosp. 2013;28(2):447-55. [ Links ]
22. Bringolf-Isler B, Mäder U, Dössegger A, Hofmann H, Puder JJ, Braun-Fahrländer C, Kriemler S. Regional differences of physical activity and sedentary behaviour in Swiss children are not explained by socio-demographics or the built environment. Int J Public Health. 2015;60(3):291-300. [ Links ]
]]>23. Leischik R, Foshag P, Strauß M, Garg P, Dworrak B, Littwitz H, Lazic JS, Horlitz M. Physical activity, cardiorespiratory fitness and carotid intima thickness: sedentary occupation as risk factor for atherosclerosis and obesity. Eur Rev Med Pharmacol Sci. 2015;19(17):3157-68 [ Links ]
24. Gallagher EJ, LeRoith D. Obesity and Diabetes: The Increased Risk of Cancer and Cancer-Related Mortality. Physiol Rev. 2015;95(3):727-48. [ Links ]
25. Withrow D, Alter DA. The economic burden of obesity worldwide: a systematic review of the direct costs of obesity. Obes Rev. 2011;12(2):131-41. [ Links ]
26. Dee A, Kearns K, O'Neill C, Sharp L, Staines A, O'Dwyer V, Fitzgerald S, Perry IJ. The direct and indirect costs of both overweight and obesity: a systematic review. BMC Res Notes. 2014;7:242. [ Links ]
27. Garantías explicitas en salud http://www.nefro.cl/phocadownload/normges/augeges/garantias_explicitas_regein_ges_2010.pdf [ Links ]
28. Lakerveld J, Brug J, Bot S, Teixeira PJ, Rutter H, Woodward E, Samdal O, Stockley L, De Bourdeaudhuij I, van Assema P, Robertson A, Lobstein T, Oppert JM, Adány R, Nijpels G; SPOTLIGHT consortium. Sustainable prevention of obesity through integrated strategies: The SPOTLIGHT project's conceptual framework and design. BMC Public Health. 2012;17;12:793. [ Links ]
]]> ^rND^sEgan^nB^rND^szierath^nJR^rND^sPedersen^nBK^rND^sFebbraio^nMA^rND^sFock^nKM^rND^sKhoo^nJ^rND^sColberg^nSR^rND^sSigal^nRJ^rND^sFernhall^nB^rND^sRegensteiner^nJG^rND^sBlissmer^nBJ^rND^sRubin^nRR^rND^sChasan-Taber^nL^rND^sAlbright^nAL^rND^sBraun^nB^rND^sRampersaud^nGC^rND^sPereira^nMA^rND^sGirard^nBL^rND^sAdams^nJ^rND^sMetzl^nJD^rND^sMaughan^nRJ^rND^sEduardo^nAtalah S^rND^sDurán^nS^rND^sValdés^nP^rND^sGodoy^nA^rND^sHerrera^nT^rND^sGoodwin^nPJ^rND^sStambolic^nV^rND^sVan^nde Voorde J^rND^sPauwels^nB^rND^sBoydens^nC^rND^sDecaluwé^nK^rND^sSmetanina^nN^rND^sAlbaviciute^nE^rND^sBabinska^nV^rND^sKarinauskiene^nL^rND^sAlbertsson-Wikland^nK^rND^sPetrauskiene^nA^rND^sVerkauskiene^nR^rND^sYannakoulia^nM^rND^sNtalla^nI^rND^sPapoutsakis^nC^rND^sFarmaki^nAE^rND^sDedoussis^nGV^rND^sSerón^nP^rND^sMuñoz^nS^rND^sLanas^nF^rND^sPedersen^nTP^rND^sMeilstrup^nC^rND^sHolstein^nBE^rND^sRasmussen^nM^rND^sKutsuma^nA^rND^sNakajima^nK^rND^sSuwa^nK^rND^sMarcos^nA^rND^sManonelles^nP^rND^sPalacios^nN^rND^sWärnberg^nJ^rND^sCasajús^nJA^rND^sPérez^nM^rND^sAznar^nS^rND^sBenito^nPJ^rND^sMartínezGomez^nD^rND^sOrtega^nFB^rND^sOrtega^nE^rND^sUrrialde^nR^rND^sKeski-Rahkonen^nA^rND^sKaprio^nJ^rND^sRissanen^nA^rND^sVirkkunen^nM^rND^sRose^nRJ^rND^sHolmbäck^nI^rND^sEricson^nU^rND^sGullberg^nB^rND^sWirfält^nE^rND^sRodríguez^nF^rND^sPalma^nX^rND^sRomo^nA^rND^sEscobar^nD^rND^sAragú^nB^rND^sEspinoza^nL^rND^sMcMillan^nN^rND^sGálvez^nJ^rND^sBringolf-Isler^nB^rND^sMäder^nU^rND^sDössegger^nA^rND^sHofmann^nH^rND^sPuder^nJJ^rND^sBraun-Fahrländer^nC^rND^sKriemler^nS^rND^sLeischik^nR^rND^sFoshag^nP^rND^sStrauß^nM^rND^sGarg^nP^rND^sDworrak^nB^rND^sLittwitz^nH^rND^sLazic^nJS^rND^sHorlitz^nM^rND^sGallagher^nEJ^rND^sLeRoith^nD^rND^sWithrow^nD^rND^sAlter^nDA^rND^sDee^nA^rND^sKearns^nK^rND^sO'Neill^nC^rND^sSharp^nL^rND^sStaines^nA^rND^sO'Dwyer^nV^rND^sFitzgerald^nS^rND^sPerry^nIJ^rND^sLakerveld^nJ^rND^sBrug^nJ^rND^sBot^nS^rND^sTeixeira^nPJ^rND^sRutter^nH^rND^sWoodward^nE^rND^sSamdal^nO^rND^sStockley^nL^rND^sDe^nBourdeaudhuij I^rND^svan^nAssema P^rND^sRobertson^nA^rND^sLobstein^nT^rND^sOppert^nJM^rND^sAdány^nR^rND^sNijpels^nG; SPOTLIGHT consortium^rND^1A01^nAlethia Guadalupe^sMariscal Rizo^rND^1A01^nEdgar M^sVásquez Garibay^rND^1A01^nMa. Irene^sSantos Torres^rND^1A01^nMaría del Carmen^sEspinosa Gómez^rND^1A01^nRogelio^sTroyo Sanromán^rND^1A01^nClío^sChávez Palencia^rND^1A01^nAlethia Guadalupe^sMariscal Rizo^rND^1A01^nEdgar M^sVásquez Garibay^rND^1A01^nMa. Irene^sSantos Torres^rND^1A01^nMaría del Carmen^sEspinosa Gómez^rND^1A01^nRogelio^sTroyo Sanromán^rND^1A01^nClío^sChávez Palencia^rND^1A01^nAlethia Guadalupe^sMariscal Rizo^rND^1A01^nEdgar M^sVásquez Garibay^rND^1A01^nMa. Irene^sSantos Torres^rND^1A01^nMaría del Carmen^sEspinosa Gómez^rND^1A01^nRogelio^sTroyo Sanromán^rND^1A01^nClío^sChávez PalenciaDiferencias entre conductas alimentarias de preescolares que recibieron lactancia materna completa y preescolares que recibieron sucedáneos de la leche humana
Alethia Guadalupe Mariscal Rizo, Edgar M. Vásquez Garibay, Ma. Irene Santos Torres, María del Carmen Espinosa Gómez, Rogelio Troyo Sanromán, Clío Chávez Palencia
Centro Universitario de Ciencias de la Salud, Universidad de Guadalajara, Guadalajara, Jalisco, México. Centro Universitario Tonalá, Universidad de Guadalajara, Tonalá, Jalisco, México
RESUMEN
. El propósito fue demostrar diferencias en las conductas alimentarias entre preescolares que recibieron lactancia materna completa (LMC: exclusiva o predominante) y preescolares que recibieron sucedáneos de la leche humana (SLH), que acuden a jardín de niños de la zona metropolitana de Guadalajara. En estudio trasversal analítico por conveniencia, se seleccionaron a 177 preescolares de tres a cinco años de edad, sanos, nacidos a término, peso normal al nacer, con antecedentes de alimentación con LME o SLH que acudían a tres jardines de niños. Se aplicó un cuestionario vali dado de conductas alimentarias que consta de ocho escalas. Se obtuvieron variables socioeconómicas y demográficas de las familias e indicadores antropométricos de los participan tes. Se aplicaron pruebas t de Student, U de Mann-Whitney, Chi cuadrado, razón de momios, coeficiente de correlación de Pearson y regresión logística. Hubo 2.8 veces mayor probabilidad de puntaje elevado en la escala comer menos por emociones en el grupo de SLH [RM=2.8 (1.0, 8.3), p=0.037]. Se observaron 15 correlaciones significativas entre las diferentes escalas del cuestionario en el grupo de LMC (62.5%) y nueve en el grupo de SLH (37.5%). Hubo siete correlaciones significativas entre las escalas en el grupo LMC que no fueron significativas en el grupo de SLH. En preescolares que recibieron LMC, a mayor lentitud para comer hubo menor irritabilidad hacia los alimentos (r=-0.325, p=0.01). Los preescolares con antecedentes de LMC tendrían menor probabilidad de alteraciones de conducta alimentaria y mostraron mayor número de correlaciones significativas entre las escalas que los preescolares que recibieron SLH.
Palabras clave: Lactancia materna exclusiva, conductas alimentarias, preescolares
Eating behaviors of preschoolers who were exclusively breastfed, and preschoolers who received human milk substitutes
SUMMARY.
The purpose was to demonstrate differences in eating behaviors among preschool children who received full breastfeeding (FBF: exclusive or predominant) and preschool children who received human milk substitutes (HMS), who attend kindergarten in the metropolitan area of Guadalajara, Mexico. In analytical cross-sectional study by convenience, 177 preschoolers, three to five years old, healthy, term infants with normal weight at birth and feeding history of FBF or HMS attending three kinder gartens were selected. A validated questionnaire of eating behaviors consisting of eight scales was applied. Socioeconomic and demographic variables of families and anthropometric indicators of participants were obtained. Student's t test, U Mann-Whitney, chi-square, odds ratio, Pearson correlation coefficient and logistic regression tests were ap plied. There were 2.8 times more likely to score high on the scale eat less by emotions in HMS group [OR = 2.8 (1.0, 8.3), p = 0.037]. Fifteen significant correlations between different scales of the questionnaire in the FBF group (62.5%) and nine in the HMS group (37.5%) were observed. There were seven significant correlations among the scales in FBF group, but not significant in the HMS group. In preschoolers receiving FBF, more frequency of eating slowly was related to less irritability to food (r=-0.325, p=0.01).Preschoolers with a history of FBF would be less likely to have alterations in eating behavior and showed more significant correlations between the scales that preschoolers who received HMS.
]]> Key words: Full breastfeeding, eating behaviors, prescho olersRecibido: 16-09-2016 Aceptado: 01-11-2016
INTRODUCCIÓN
La Organización Mundial de la Salud (1) recomienda ofrecer “lactancia materna exclusiva (LME) durante los primeros seis meses de vida, tiempo en que se inicia la introducción de alimentos seguros y nutritivos mientras continua la lactancia hasta dos años o más”. Este es un periodo fundamental para el “desarrollo del potencial humano completo del niño” (2). Además, la LME favorece el crecimiento, la salud, el estado físico y emocional óptimo del lactante (3).Sin embargo, a pesar de las múltiples campañas de promoción, la lac tancia materna completa (exclusiva y predominante) no ha alcanzado la frecuencia esperada (4-6). La ENSANUT 2012 (4) señala que las prácticas de lactancia materna en México se encuentran por debajo de la recomendación de la OMS (1). La prevalencia de LME hasta los seis meses ha descendido significativamente de 22.3% en 2006 (7) a 14.4% en 2012 (4) y en la zona metropolitana de Guadalajara (zMG) ha ocurrido un descenso similar. Con relación a las conductas alimentarias, se ha señalado que las preferencias por los sabores se forman en los lactantes a través de la leche humana, la cual aparentemente cambia su olor según los alimentos que la madre consume (8, 9). Al parecer cuando el lactante inicia el consumo de alimentos sólidos prefiere algunos sabores sobre otros, basado en la experiencia previa durante la lactancia. Estudios realizados en países europeos, Estados Unidos y Chile, han mostrado que las preferencias alimentarias de los preescolares se asocian a la influencia de los padres y a factores socioeconómicos, demográficos y culturales (10-13). Paralelamente, algunos trabajos se han focalizado en explorar la relación entre la lactancia materna y el riesgo y/o protección para el desarrollar sobrepeso u obesidad en la edad preescolar (14-18). Se ha demostrado que los lactantes alimentados al pecho materno muestran mayor ingestión de verdura después de la exposición que los lactantes alimentados con fórmula (19). Se ha sugerido que la experiencia de la alimentación al pecho materno expone al lactante a diferentes sabores que encuentra en la leche humana; en consecuencia, alimentos consumidos por la madre con mayor frecuencia, serían mejor aceptados. Un estudio cuasi-experimental mostró que los recuerdos de olores adquiridos tempranamente durante la lactancia influirían en los procesos conductuales durante la niñez temprana (20). Si durante la lactancia materna se da el primer contacto con los alimentos. Es probable que esta experiencia tenga un impacto en el desarrollo de gustos y preferencias alimentarias, que perduren en la etapa preescolar, periodo en el que se consolidan los hábitos alimentarios Por ello, el propósito del estudio fue demostrar diferencias entre las conductas alimentarias de preescolares con antecedentes de lactancia materna completa (LMC) por un periodo igual o mayor a cuatro meses y preescolares con antecedentes de alimentación con sucedáneos de la leche humana (SLH) durante el mismo periodo, que acuden a jardines de niños de la zMG. METODOS En este estudio trasversal analítico se seleccionaron 177 preescolares de tres a cinco años de edad, que acu dían a tres jardines de niños de la zMG que aceptaron participar en el estudio durante el año 2012. Se encon traban aparentemente sanos, nacidos a término, con peso normal al nacer, antecedentes de alimentación con lactancia materna completa (exclusiva y predominante) o con SLH. El criterio de lactancia materna fue: a) Lac tancia materna completa (LMC): lactancia materna ex clusiva + lactancia materna predominante; b) lactancia materna exclusiva: exclusivamente leche humana, no se dan otros líquidos ni sólidos —ni siquiera agua— ex ceptuando la administración de soluciones de rehidra tación oral o de vitaminas, minerales o medicamentos en forma de gotas o jarabes; c) lactancia materna pre dominante: permite ciertos líquidos (agua y bebidas a base de agua, jugos de fruta), líquidos rituales y suero oral, gotas o jarabes (vitaminas, minerales, medicinas) (1). Se aceptaron participantes sin malformaciones con génitas ni genopatías aparentes y que contaran con el consentimiento informado y firmado por los padres. No se incluyeron preescolares de estancias infantiles. Se excluyeron 38 preescolares con antecedentes de lactan cia materna mixta o información incompleta. Se realizó un muestreo no aleatorio, por conveniencia, y el cálculo de la muestra se estimó con un valor alfa de 0.05/2, un valor de beta de 0.8 y una probabilidad de 0.5. Variables. Dependientes: conductas alimentarias obtenidas con el Cuestionario de Conductas Alimenta rias en Niños (Child Eating Behavior Questionnaire, CEBQ, por sus siglas en inglés) elaborado por Wardle et al (21). Este cuestionario validado en castellano consta de 35 ítems divididos en ocho sub-escalas: 1) respuesta a la saciedad; 2) lentitud para comer; 3) irri tabilidad hacia los alimentos; 4) respuesta a los alimen tos; 5) disfrute de los alimentos; 6) deseos de beber; 7) comer menos por emociones; 8) comer más por emo ciones. Utiliza una escala de Likert con las siguientes opciones y puntuaciones: nunca (1), casi nunca (2), a veces (3), a menudo (4), siempre (5). Una vez validado, se aplicó a la madre o tutor responsable del niño, se ob tuvo un puntaje total de la prueba y un puntaje para cada sub-escala, dichos puntajes se analizaron de ma nera cuantitativa y cualitativa. Independientes: antece dentes de alimentación con LMC o SLH; característi cas generales y antropométricas de los preescolares; escolaridad y ocupación de los padres; datos socioeco nómicos (ingreso familiar mensual, gasto en alimenta ción per-cápita).
Antropometría. Previa estandarización de dos ob servadores con el método de Habitch (22) se realizaron las siguientes mediciones: peso en ropa interior con una bata diseñada exprofeso para tal fin con un peso cono cido, en una báscula con una lectura mínima de 100 g (Tanita UM-081, Tokio, Japón). La estatura de los par ticipantes se obtuvo con una escala graduada marca seca-214 (Hamburgo, Alemania) sin zapatos, con la punta de los pies levemente separados y los talones jun tos; la cabeza, hombros, nalgas y talones, colocados en Plano de Frankfort.
Análisis estadístico. Además de las estadísticas des criptivas se realizaron las siguientes pruebas analíticas: t de Studenty, U de Mann-Whitney para la compara ción de variables paramétricas con y sin distribución normal; chi-cuadrado y razón de momios para la ex ploración de asociaciones entre variables no paramé tricas. Para el análisis del cuestionario de conductas alimentarias se obtuvo el promedio de las puntuaciones obtenidas de los ítems correspondientes a cada una de las ocho sub-escalas. Una vez obtenidos los promedios de cada una de las sub-escalas y de la puntuación total, se estratificaron en desviaciones estándar (DE): < - 1 DE, ± 1 DE, y > 1 DE para su análisis cualitativo. Asi mismo, se realizó una prueba del coeficiente de Pear son para el análisis de correlación entre las sub-escalas del cuestionario de conductas alimentarias y un modelo de regresión logística para la identificación de las va riables socioeconómicas, demográficas y educaciona les asociadas al uso de SLH.
Consideraciones éticas. El protocolo fue aplicado una vez obtenido consentimiento informado, no puso en riesgo al sujeto de estudio y se apegó a los linea mientos de la declaración de Helsinki. Fue aprobado por los Comités de bioética e investigación de la Uni versidad de Guadalajara, dictamen CI-02412.
RESULTADOS
Se obtuvo una muestra homogénea de preescolares, con características demográficas y socioeconómicas si milares, que habitaban en la zona Metropolitana de Guadalajara (zMG), Tabla 1.
]]>
La comparación de los indicadores antropométri cos mostró que en los preescolares que recibieron SLH, el índice talla/edad fue significativamente mayor que en el grupo que recibió LMC (p=0.042), Tabla 2.

Predominó el sexo femenino (54%) en preescolares que recibieron LMC y el sexo masculino (53.8%) en quienes recibieron SLH. En el grupo que recibió LMC, las familias eran nucleares en 69.9%, compuestas 5.7%, ampliadas 26.4% y monoparentales 5.7%; En el grupo que recibió SLH, las familias eran nucleares en 73.1%, compuestas 3.8%, ampliadas 21.2% y mono parentales 0%. El ingreso familiar fue de dos a cinco salarios mínimos en 62.1% de los lactantes en LMC y de 44.2% en lactantes en SLH; mientras que fue mayor de cinco salarios mínimos en 37.9% de los lactantes en LMC y 55.8% en lactantes en SLH (p=0.041). Las ma dres se dedicaban al hogar con más frecuencia en lac tantes que recibieron LMC (49.4%) que en lactantes alimentados con SLH (36.5%). Predominaron las ma dres profesionistas en lactantes en que recibieron LMC (14.9%) versus lactantes en SLH (5.8%); eran emple adas 20.4% de las madres en lactantes que recibieron LMC versus 44.1% en las madres de lactantes en SLH.
La ocupación del padre no mostró diferencias porcen tuales importantes entre los dos grupos. La mayoría (69.8%) eran empleados, 10.1% comerciantes, 10.8% profesionistas y 1.4% desempleados. La escolaridad de las madres mostró una dispersión similar entre el grupo que recibió LMC y el grupo que recibió SLH. La ma yoría de la población estudiada (93%) tenía mínimo se cundaria completa. Un número importante (25%) había cursado la licenciatura y estudios de posgrado. Del mismo modo, el nivel de escolaridad de los padres fue similar para ambos gru pos, donde 85% había cursado como mínimo la secundaria y 29% tenía estudios superiores a licenciatura.
La Tabla 3 muestra que los lactantes de ma dres dedicadas al hogar, profesionistas o comerciantes establecidas tenían menor probabilidad de dar SLH [RM= 0.247 (0.11, 0.55), p=0.001]. Cuando la decisión de abandonar la lactancia dependía de la madre, se mostró una proba bilidad seis veces mayor (49.4%) de dar LMC por lo menos hasta el cuarto mes de vida. Por el contrario, niños de familias cuyo ingreso familiar mensual fue mayor a cinco salarios mínimos, tuvieron una mayor probabilidad de recibir SLH [RM= 2.24 (1.05, 4.77), p=0.036].

Con relación al cuestionario de conductas alimen tarias en niños, se observaron tendencias no significa tivas en la escala de irritabilidad hacia los alimentos y en la escala total del cuestionario de conductas alimen tarias en niños. Al estratificar las frecuencias de pun tuaciones en <-1DE vs >-1DE, se observó una probabilidad 2.8 veces mayor de obtener puntajes ele vados en la escala comer menos por emociones en el grupo de SLH [RM= 2.8 (1.0, 8.3), p=0.037], Tabla 4.
]]>
Al estimar la correlación de las ocho sub-escalas del cuestionario, separadas entre el grupo LME vs SLH, Tabla 5, se encontraron 15 correlaciones signifi cativas entre las diferentes escalas en el grupo de LMC (62.5%) y solo ocho en el grupo de SLH (37.5%) [RM=2.7 (0.90, 8.3), p=0.074]. Se observaron ocho co rrelaciones significativas coincidentes entre los dos grupos; hubo siete correlaciones significativas en el grupo LMC que no fueron significativas en el grupo de SLH; mientras que hubo una sola correlación signifi cativa para la alimentación con SLH que no fue signi ficativa para LME.

DISCUSIÓN
Se observó una gran variabilidad en el ingreso fa miliar mensual en una población que supuestamente pertenecía al estrato social medio. Consideramos que esta característica económica habría influido en los fac tores sociales, económicos, educacionales y de hábitos de alimentación de la población estudiada. La frecuen cia de familias nucleares en la zona metropolitana de Guadalajara es cada vez menor, situación que no difiere con lo observado en el resto del país (23). Sin embargo, en la población estudiada 60.9% de las familias del grupo LMC eran nucleares vs 73.1% del grupo SLH.
Por el contrario, alrededor de 40% de las familias del grupo LMC estaban integradas de manera ampliada, compuesta y mono-parental. Es probable que este rasgo tenga una influencia favorable en los hábitos de lactan cia, dado que, al duplicar la frecuencia de LMC y SLH de manera proporcional en la tabla de contingencia, la LMC fue menos frecuente en familias nucleares (58.9%) que en otros modelos de familia (71.7%). En estos modelos de familia no nucleares, la probabilidad de LMC aumentó en 82% [RM=1.82 (1.02, 3.3), p=0.029]. Es posible que la madre haya contado con el apoyo familiar que le dio la confianza necesaria para prolongar la alimentación al pecho materno. La perma nencia de la mujer en el hogar, un ingreso familiar más bajo (2-5 salarios mínimos) y/o el hecho de que las ma dres fueran profesionistas o comerciantes establecidas, habrían sido factores favorables a la LMC debido a que estas circunstancias, les habría permitido mayor liber tad y tiempo para la lactancia. Este fenómeno tendría sustento porque las madres con menor probabilidad de LMCfueron aquellas que laboraban como empleadas.
Es probable que largas jornadas de trabajo y transporte habrían sido un obstáculo para la alimentación al pecho materno. Hallazgos similares se han observado por dé cadas en México y en otros países (5, 24, 25).
En preescolares con antecedentes de LMC y SLH, la respuesta a la saciedad (escala 1) estuvo asociada po sitivamente con la lentitud para comer (escala 2) y con comer menos por emociones (escala 7). Se encontró una asociación negativa entre la respuesta a los alimen tos (escala 4) y el disfrute de los mismos (escala 5).
]]> Esto implica que los preescolares, independientemente de sus antecedentes de alimentación, muestran conduc tas de mayor respuesta a la saciedad cuando los alimen tos no son de su agrado. De igual forma, ambos grupos mostraron una asociación inversa entre la lentitud para comer (escala 2) y el disfrute de los alimentos (escala 5). Estos hallazgos significarían que los niños comen más lento los alimentos que más les gustan y más rá pido los que más les disgustan. En ambos grupos hay una relación directa entre la irritabilidad hacia los ali mentos (escala 3) y el disfrute de los mismos (escala 5), lo que implica que los preescolares pueden identi ficar los alimentos que les gustan y los que les desagra dan. En ambos grupos, la escala comer menos por emo ciones o sub-alimentación emocional (escala 7) se asoció positivamente con la respuesta a la saciedad (es cala 1).En ambos grupos, no hubo correlación entre la res puesta a la saciedad (escala 1) y el deseo de beber (es cala 6) y entre la misma escala 1 y comer más por emociones (escala 8). Es posible que en preescolares, la saciedad y el deseo de beber, sean dos signos fisio lógicos de origen distinto. Hubo una relación directa entre saciedad y comer menos por emociones (escala 7) pero no correlacionó saciedad con comer más por emociones (escala 8).El grupo de LMC mostró una co rrelación negativa entre la respuesta a la saciedad (es cala 1) y la irritabilidad hacia los alimentos (escala 3).
Esta correlación no se observó en preescolares que re cibieron SLH. Es posible que la respuesta a la saciedad sea un signo fisiológico más intenso en preescolares que recibieron LMC y estos niños tendrían menor di ficultad para acercarse a nuevos alimentos, menor re chazo a los alimentos y disfrutarían mejor de una amplia variedad de alimentos. Estos rasgos serían menos ostensible en preescolares que recibieron SLH.
La sub-alimentación emocional (escala 7) está directa mente relacionada con la lentitud para comer (escala 2) en niños que recibieron LMC, esto significa que el niño presenta una ingestión adecuada de alimentos a un ritmo constante aun cuando tenga alguna emoción que le altere. En esta misma escala 7 se observa una asociación inversa con la escala respuesta a los alimen tos (escala 4) en el grupo de preescolares que recibieron SLH. O sea, estos niños mostrarían conductas menos receptivas a la comida cuando se encuentran molestos, cansados o enojados. Podría afirmarse que sus estados de ánimo alteran su relación con los alimentos. A dife rencia de los preescolares que recibieron SLH, aquellos que recibieron LMC, mostraron una correlaciona in versa entre lentitud para comer (escala 2) con irritabi lidad hacia los alimentos (escala 3); con respuesta a los alimentos (escala 4); y disfrute de los alimentos (escala 5); y una correlación directa débil con comer menos con emociones (escala 7). Estos hallazgos significarían que en preescolares que recibieron LMC, a mayor len titud para comer hay menor irritabilidad hacia los ali mentos; en consecuencia, menos alteraciones de conducta alimentaria.
Las 15 correlaciones significativas entre las dife rentes escalas en el grupo de LMC (62.5%) vs solo ocho en el grupo de SLH (37.5%), muestran mayor consistencia y congruencia en los hábitos y conductas alimentarias en los preescolares que recibieron LMC.
Sin embargo, se habría cometido un error tipo II ya que al duplicar las observaciones en forma proporcional en cada una de ellas, se observó una probabilidad 2.7 veces mayor de un número más elevado de correlacio nes entre las escalas en preescolares que recibieron LMC [RM=2.7 (95% 1,2, 6.0), p=0.011].
La principal fortaleza del estudio fue el análisis de dos grupos bien diferenciados en tipo de alimentación pertenecientes a una misma población, con caracterís ticas antropométricas similares. Esta ventaja evitó un sesgo potencial de incluir variables no controladas. Una debilidad sería la probabilidad de haber cometido un error de tipo II debido al tamaño de la muestra, lo que habría afectado a algunas variables socioeconómicas y demográficas y a la sub-escala: irritabilidad hacia los alimentos y a la puntuación total del CEBQ y que ha bría favorecido más al grupo LMC.
El desarrollo de la conducta alimentaria es un pro ceso complejo en el que participan componentes fisio lógicos de regulación del apetito, del crecimiento y peso corporal; de componentes psicológicos del niño, de los padres, de la familia y de componentes culturales y sociales. Por ello, es importante el estudio a mayor profundidad de estas variables porque las alteraciones en la conducta alimentaria en los primeros años de vida influidas por su presencia provocarían desaceleración del crecimiento, aversiones alimentarias y dificultades en la convivencia familiar.
CONCLUSIÓN
Los hallazgos sugieren la existencia de rasgos dife renciados en las conductas alimentarias en preescolares que habrían sido influidos por la alimentación con LMC o SLH durante la etapa lactante. La mayor diver sidad en el consumo de alimentos en la etapa preescolar del grupo que recibió LMC habría sido influida por la exposición a sabores y olores que percibe el lactante cuando es alimentado al pecho materno. La ausencia de asociaciones significativas en algunas escalas y en la puntuación total de la encuesta apoyaría la necesidad de realizar estudios con diferentes poblaciones, estratos socioeconómicos y educacionales en diferentes regio nes del país.
]]> El desarrollo de la conducta alimentaria es un pro ceso complejo en el que participan componentes fisio lógicos de regulación del apetito, del crecimiento y peso corporal; de componentes psicológicos del niño, de los padres, de la familia y de componentes culturales y sociales. Por ello, es importante el estudio a mayor profundidad de estas variables porque las alteraciones en la conducta alimentaria en los primeros años de vida influidas por su presencia provocarían desaceleración del crecimiento, aversiones alimentarias y dificultades en la convivencia familiar.AGRADECIMIENTOS
Manifestamos nuestro profundo agradecimiento a la LN. Mabel Itzel Macías Jiménez por su apoyo en la aplicación de encuestas y en la medición y evaluación antropométrica.
REFERENCIAS
1. WHO. Exclusive breastfeeding. e-Library of Evidence for Nutrition Actions (eLENA), 2016. [Citado el 04 de junio de 2016]. Disponible en: http://www.who.int/elena/titles/exclusive_breastfeeding/en/ [ Links ]
2. OPS. Principios de orientación para la alimentación complementaria del niño amamantado. Organización panamericana de la salud. Washington DC. 2003; 8-14. Citado el 8 marzo de 2011. Disponible en: http://whqlibdoc.who.int/paho/2003/9275324603_spa.pdf [ Links ]
3. Victora CG, Horta BL, Loret de Mola C, Quevedo L, Pinheiro RT, Gigante DP, et al. Association between breastfeeding and intelligence, educational attainment, and income at 30 years of age: a prospective birth co hort study from Brazil. Lancet Glob Health. 2015; 3: e199-e205. [ Links ]
4. Gutiérrez JP, Rivera-Dommarco J, Shamah-Levy T, Vi llalpando-Hernández S, Franco A, Cuevas-Nasu L, Ro mero-Martínez M, Hernández-Ávila M. Encuesta Nacional de Salud y Nutrición 2012. Resultados Na cionales. Instituto Nacional de Salud Pública: Cuerna vaca, México, 2012.
5. González de Cosío T, Escobar-zaragoza L, González Castell LD, Rivera-Dommarco JA. Prácticas de ali mentación infantil y deterioro de la lactancia materna en México. Salud Publica Mex 2013; 55 (suppl 2): S170-S179. [ Links ]
6. Vásquez-Garibay EM, Ávila-Alonso E, Contreras Ramos T, Cuellar-Espinosa L, Romero-Velarde E. Fac tores de riesgo, asociados al estado nutricio en lactantes que son atendidos en guarderías. Bol Med Hosp Infant Mex. 2007; 64(1): 18-28 [ Links ]
7. Olaiz-Fernández G, Rivera-Dommarco J, Shamah Levy T, Rojas R, Villalpando-Hernández S, Hernán dez-Ávila M, Sepúlveda-Amor J. Encuesta Nacional de Salud y Nutrición 2006. Cuernavaca (México): Ins tituto Nacional de Salud Pública; 2006.
8. Mennella JA, Beauchamp GK. Maternal diet alters the sensory qualities of human milk and the nursling's be havior. Pediatrics. 1991; 88(4): 737-44. [ Links ]
9. Nicklaus S, Boggio V, Issanchou S. Food choice at lunch during the third year of life: High selection of animal and starchy foods but avoidance of vegetables. Acta Pediatr. 2005; 94(8): 943-951 [ Links ]
10. Jahnke D, Warschburer P. Familial transmission of ea ting behaviors in preschool-aged children. Obesity 2003; 16(8): 1821-5 [ Links ]
11. Philips N, Sioen I, Michels N, Sleddens E, De Henauw S. The influence of parenting style on health related be havior of children: findings from the ChiBS study. Int J Behav Nutr Phys Act. 2014; 11: 95. doi: 10.1186/s12966-014-0095-y. [ Links ]
12. Gubbels JS, Kremers SP, Stafleu A, de Vries SI, Gold bohm RA, Dagnelie PC, et al. Association between pa renting practices and children's dietary intake, activity behavior and development of body mass index: the KOALA Birth Cohort Study. Int J Behav Nutr Phys Act. 2011; 8: 18. doi: 10.1186/1479-5868-8-18. [ Links ]
13. Osorio EJ, Weisstaub NG, Castillo DC. Desarrollo de la conducta alimentaria en la infancia y sus alteracio nes. Rev Chil Nutr. 2002; 29(3):280–285 [ Links ]
14. Nascimento VG, da Silva JP, Ferreira PC, Bertoli CJ, Leone C. Maternal breastfeeding, early introduction of non-breast milk, and excess weight in preschoolers. Rev Paul Pediatr. 2016 Jun 16. doi: 10.1016/j.rpped.2016.05.004. [ Links ]
15. Ramirez-Silva I, Rivera JA, Trejo-Valdivia B, Marto rell R, Stein AD, Romieu I, et al. Breastfeeding status at age 3 months is associated with adiposity and car diometabolic markers at age 4 years in Mexican chil dren. J Nutr. 2015; 145(6):1295-302. [ Links ]
16. Schwartz R, Vigo Á, de Oliveira LD, Justo Giugliani ER. The Effect of a Pro-Breastfeeding and Healthy Complementary Feeding Intervention Targeting Ado lescent Mothers and Grandmothers on Growth and Pre valence of Overweight of Preschool Children. PLoS One. 2015; 10(7): e0131884. doi: 10.1371/journal.pone.0131884. eCollection 2015. [ Links ]
17. Ejlerskov KT, Christensen LB, Ritz C, Jensen SM, Mølgaard C, Michaelsen KF. The impact of early growth patterns and infant feeding on body composi tion at 3 years of age. Br J Nutr. 2015; 114(2):316-27. [ Links ]
]]>18. Portela DS, Vieira TO, Matos SM, de Oliveira NF, Vieira GO. Maternal obesity, environmental factors, ce sarean delivery and breastfeeding as determinants of overweight and obesity in children: results from a co hort. BMC Pregnancy Childbirth. 2015; 15: 94. doi: 10.1186/s12884-015-0518-z. [ Links ]
19. Sullivan S, Birch LL. Infant dietary experience and ac ceptance of solid foods. Pediatrics. 1994; 93(2): 271 277. [ Links ]
20. Delaunay-El Allam M, Soussignan R, Patris B, Marlier L, Schaal B. Long-lasting memory for an odor acquired at the mother's breast. Dev Sci. 2010; 13(6): 849-63. [ Links ]
21. Wardle J, Guthrie CA, Sanderson S, Rapoport L. De velopment of the Children’s Eating Behavior Question naire. J. Child Psychol. Psychiatry. 2001; 42(7):963-70. [ Links ]
22. Habitch JP. Estandarización de métodos epidemiológi cos cuantitativos sobre el terreno. Bol Oficina Sanit Panam 1974; 76(5):375-384. [ Links ]
]]> 23. INEGI. Hogares familiares y hogares no familiares: Vi vimos en hogares diferentes. 2015. Citado el 3 de Agosto de 2016. Disponible en: http://cuentame.inegi.org.mx/poblacion/hogares.aspx?tema=P24. Betoko A, Charles MA, Hankard R, Forhan A, Bonet M, Saurel-Cubizolles MJ, et al. Infant feeding patterns over the first year of life: influence of family characte ristics. Eur J Clin Nutr. 2013; 67(6):631-7. doi: 10.1038/ejcn.2012.200. [ Links ]
25. Santos-Torres I, Vasquez-Garibay E, Napoles-Rodrí guez F. Breast feeding habits in marginated neighbor hoods in Guadalajara. Bol Med Hosp Infant Mex. 1990; 47(5): 318-23. [ Links ]
^rND^sVictora^nCG^rND^sHorta^nBL^rND^sLoret^nde Mola C^rND^sQuevedo^nL^rND^sPinheiro^nRT^rND^sGigante^nDP^rND^set^nal^rND^sGonzálezdeCosío^nT^rND^sEscobar-zaragoza^nL^rND^sGonzález^nCastell LD^rND^sRivera-Dommarco^nJA^rND^sVásquez-Garibay^nEM^rND^sÁvila-Alonso^nE^rND^sContreras^nRamos T^rND^sCuellar-Espinosa^nL^rND^sRomero-Velarde^nE^rND^sMennella^nJA^rND^sBeauchamp^nGK^rND^sNicklaus^nS^rND^sBoggio^nV^rND^sIssanchou^nS^rND^sJahnke^nD^rND^sWarschburer^nP^rND^sPhilips^nN^rND^sSioen^nI^rND^sMichels^nN^rND^sSleddens^nE^rND^sDe^nHenauw S^rND^sGubbels^nJS^rND^sKremers^nSP^rND^sStafleu^nA^rND^sde^nVries SI^rND^sGold^nbohm RA^rND^sDagnelie^nPC^rND^set^nal^rND^sOsorio^nEJ^rND^sWeisstaub^nNG^rND^sCastillo^nDC^rND^sNascimento^nVG^rND^sda Silva^nJP^rND^sFerreira^nPC^rND^sBertoli^nCJ^rND^sLeone^nC^rND^sRamirez-Silva^nI^rND^sRivera^nJA^rND^sTrejo-Valdivia^nB^rND^sMarto^nrell R^rND^sStein^nAD^rND^sRomieu^nI^rND^set^nal^rND^sSchwartz^nR^rND^sVigo^nÁ^rND^sde^nOliveira LD^rND^sJusto^nGiugliani ER^rND^sEjlerskov^nKT^rND^sChristensen^nLB^rND^sRitz^nC^rND^sJensen^nSM^rND^sMølgaard^nC^rND^sMichaelsen^nKF^rND^sPortela^nDS^rND^sVieira^nTO^rND^sMatos^nSM^rND^sde^nOliveira NF^rND^sVieira^nGO^rND^sSullivan^nS^rND^sBirch^nLL^rND^sDelaunay-El^nAllam M^rND^sSoussignan^nR^rND^sPatris^nB^rND^sMarlier^nL^rND^sSchaal^nB^rND^sWardle^nJ^rND^sGuthrie^nCA^rND^sSanderson^nS^rND^sRapoport^nL^rND^sHabitch^nJP^rND^sBetoko^nA^rND^sCharles^nMA^rND^sHankard^nR^rND^sForhan^nA^rND^sBonet^nM^rND^sSaurel-Cubizolles^nMJ^rND^set^nal^rND^sSantos-Torres^nI^rND^sVasquez-Garibay^nE^rND^sNapoles-Rodríguez^nF^rND^nNatalie^sRíos^rND^nMargarita^sSamudio^rND^nFabiana^sParedes^rND^nFernando^sVio^rND^nNatalie^sRíos^rND^nMargarita^sSamudio^rND^nFabiana^sParedes^rND^nFernando^sVio^rND^nNatalie^sRíos^rND^nMargarita^sSamudio^rND^nFabiana^sParedes^rND^nFernando^sVioEfecto de una intervención educativa nutricional en un entorno laboral
Natalie Ríos, Margarita Samudio, Fabiana Paredes, Fernando Vio
Instituto de Nutrición y Tecnología de los Alimentos (INTA), Universidad de Chile. Santiago, Chile. Instituto de Investigaciones en Ciencias de la Salud (IICS), Universidad Nacional de Asunción, Asunción, Paraguay.
RESUMEN
El objetivo fue evaluar el efecto de una intervención educativa nutricional en un entorno laboral. Para ello se realizó un estudio cuasi-experimental, longitudinal, con una intervención educacional de cuatro meses de duración. Participaron 90 trabajadores, 44 mujeres y 46 hombres, edad promedio 29,3 ± 5,4 años, de una empresa de telefonía celular de Asunción-Paraguay. Se efectuaron encuestas de datos clínicos, hábitos alimentarios, actividad física y mediciones antropométricas al inicio y final de la intervención. Para hábitos alimentarios se utilizaron el cuestionario de frecuencia de consumo cuantificado y el registro de consumo alimentario de una semana, ambos previamente validados y utilizados en otras investigaciones. La actividad física se estimó con el Cuestionario Internacional de Actividad Física IPAQ que divide a la misma en tres categorías (baja, moderada y alta). La antropometría incluyó peso, talla, IMC y circunferencia de cintura. La educación nutricional consistió en consultas de consejería individual, concurso para bajar de peso, acciones colectivas de apoyo e intervenciones del entorno del lugar de trabajo. La ingesta de frutas y verduras fue significativamente mayor (p<0,001 y p=0,001); el consumo de pan disminuyó en un 56% (p=0,001); mejoró el estado nutricional (p<0,001) y disminuyó la circunferencia de cintura (p<0,001) al final del estudio. Los niveles de actividad física moderado y alto aumentaron de 43,4% a 59%. Esta intervención integral en el lugar de trabajo, con un concurso para bajar de peso, mejoró el estado nutricional e impactó positivamente en el estilo de vida de los empleados.
Palabras clave: Enfermedades crónicas no transmisibles, estilos de vida saludable, entornos laborales, educación nutricional, intervención nutricional.
Effect of a nutrition educational intervention in a work environment
SUMMARY.
. The objective is to evaluate a nutrition educational intervention in a work place. This is a quasi-experimental and four- month longitudinal study in 90 participants (44 women and 46 men), average age 29.3 ± 5.4 years, from a telephone company in Asunción, Paraguay. Anthropometry, nutritional assessment and physical activity evaluation were carried out at the beginning and at the end of the intervention. For food habits, a food frequency questionnaire and one-week food consumption registration system were applied, both validated and used previously in other studies. The level of physical activity was measured using the International Physical Activity Questionnaire (IPAQ) which divides physical intensity in three levels (low, moderate and high). Anthropometry included weight, height and waist circumference. Nutrition education consisted in individual lifestyle counseling, a contest to lose weight, collective support actions and environmental intervention at the work place. A significant increase of intakes of fruits and vegetables (p<0.001 y p= 0.001 respectively); a 56% reduction in bread consumption (p= 0.001); significantly (p<0.001) improvement of nutritional status, and waist circumference reduction (p<0.001) were observed al the end of the study. High and moderate physical activity improved from 43.4% to 59%. This integral nutrition intervention at the work place with a weight loss contest improved the nutritional status and had a positive impact in the workers life styles.
Key words: Chronic diseases, healthy lifestyles, work places, nutrition education, nutrition intervention.
]]> Recibido: 19-10-2016 Aceptado: 18-01-2017INTRODUCCIÓN
Las principales causas de morbimortalidad en Paraguay, al igual que en la mayoría de los países de la Región, son las enfermedades crónicas no transmisibles (ECNT) como la enfermedad cardiovascular (ECV), enfermedad pulmonar obstructiva crónica, el cáncer y la diabetes (1).
Según la Primera Encuesta Nacional de Factores de Riesgo de Enfermedades No Transmisibles realizada en Paraguay en el 2011(ENFR 2011), el exceso de peso en la población adulta y en ambos sexos fue del 57,6% y la obesidad del 22,8%.
El costo económico que representan las ECNT para los países es muy alto. En el año 2010 sólo para las ECV a nivel mundial se estimó un gasto de USD 863 mil millones, cifra que se estima aumentará a más de USD 1 billón para el 2030 (2).
El ámbito laboral es un espacio privilegiado para implementar actividades y programas integrales de promoción de la salud y prevención de ECNT, las que deberían estar dirigidas a modificar los determinantes del comportamiento para poder ser exitosas (3).
La Organización Mundial de la Salud (OMS) llevó a cabo una revisión para determinar los resultados de las intervenciones de los lugares de trabajo relacionados con la dieta y el ejercicio. Los programas integrales resultaron en una reducción del 25-30% en costos médicos y ausentismo en un lapso de tres años y medio (4). Los resultados de algunos de estos programas no se han medido, ya sea por falta de recursos financieros, por no incluir indicadores de evaluación en la formulación de los mismos, o porque se necesitan varios años para dar cuenta de los resultados y del impacto. Sin embargo, entre los que muestran evidencia de éxito, los denominadores comunes fueron el ejercicio, la nutrición y la salud mental, contar con el apoyo de la gerencia y programas gratuitos, tanto grupales como individuales, que incluyan evaluaciones clínicas con un profesional de la salud, asesoramiento nutricional, de actividad física y material de apoyo en línea (5).
En Paraguay, dentro del Plan Nacional de Acción para la Prevención y el Control de las ECNT 20142024 del Ministerio de Salud y Bienestar Social, se enmarca la iniciativa “Ambiente Laboral con Estilo de Vida Saludable”, que certifica empresas por desarrollar programas de promoción y prevención de ECNT, los cuales incluyen cuatro componentes: alimentación saludable, actividad física, ambiente libre de humo de tabaco y consumo nocivo de alcohol (6). Si bien numerosas empresas ya han sido certificadas, no hay trabajos publicados del tipo de actividades que realizan, de las evaluaciones de línea de base ni de resultados, tampoco una metodología de trabajo aplicable y replicable en otras empresas.
Por ello, el objetivo del presente estudio es evaluar el efecto de una intervención educativa nutricional en un entorno laboral, en relación al aumento del consumo de frutas y verduras, de actividad física y disminución del consumo de panificados, para mejorar el estado nutricional y la calidad de vida de los trabajadores.
MATERIALES Y MÉTODOS
]]> Diseño de la investigaciónEstudio cuasi-experimental, longitudinal, en trabajadores hombres y mujeres de una empresa de telefonía celular de Asunción, Paraguay, realizado entre noviembre de 2015 y febrero de 2016, donde se evaluó una intervención en educación nutricional con mediciones al inicio y al final, siguiendo la metodología de la “evaluación por adecuación” para medir impacto en programas de salud pública, descrita por Habicht et al. (7).
Sujetos
Tamaño de la muestra
La estimación del tamaño de la muestra se basó en las diferencias esperadas en el consumo diario de frutas, verduras y panificados, en base a la diferencia reportada entre la evaluación inicial y final del estudio “Evaluación de una intervención educativa nutricional en trabajadores de la construcción para prevenir enfermedades crónicas no transmisibles en Chile” (8), que fue un incremento de 62,4 gramos para frutas y verduras y una disminución de 44,4 gramos de panificados. Para una potencia del 90% y un nivel de significación del 5%, el número mínimo estimado fue de 90 sujetos, cuyas características están descritas en la Tabla 1.
Selección de la muestra
La selección fue por conveniencia, a través de la invitación a las personas que deseaban participar por correo electrónico y carteles informativos distribuidos en la empresa, seleccionando a cada individuo de acuerdo con los criterios de inclusión hasta alcanzar el número definido de participantes.


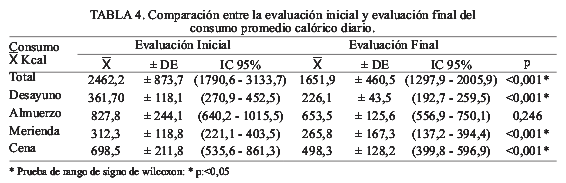
Criterios de inclusión y exclusión
Trabajadores del sexo masculino y femenino, mayores de 18 años de edad, trabajar al menos seis horas en la empresa, realizar exclusivamente trabajos de oficina, no ser pasantes y no tener patologías que imposibiliten la práctica de actividad física dentro del programa.
Las personas inscritas recibieron información acerca del estudio y firmaron el consentimiento informado aprobado por el Comité de ética del Instituto de Nutrición y Tecnología de los Alimentos (INTA) de la Universidad de Chile.
]]> MÉTODOSMediciones de Presión Arterial y Antropometría
La presión arterial (PA), se obtuvo con un esfingomanómetro (ASPEN AS102, Wenzhou, China), clasificándose hipertensión una presión sistólica ≥ 140 mmHg o diastólica ≥ 90 mmHg, de acuerdo al Consenso Paraguayo de Hipertensión Arterial 2015, elaborado por la Sociedad Paraguaya de Cardiología y Cirugía Cardiovascular en conjunto con el Programa Nacional de Prevención Cardiovascular del MSPyBS.
El peso se midió con ropa liviana en una balanza (Seca elegantia 815, Hamburgo, Alemania) con 100 g de precisión, calibrada antes de iniciar las mediciones, y la talla se midió con un estadiómetro portátil adosado a la pared (Seca 217, Hamburgo, Alemania) con precisión 0,1 cm. Se calculó el índice de Masa Corporal (IMC) en kg/m2 y se clasificó el estado nutricional según la norma de la OMS en bajo peso (< 18,5), normopeso (18,5 a 24,9), sobrepeso (25 a 29,9), obesidad I (30-34,9), obesidad II (35-39,9), obesidad III (≥ 40) (9).
La circunferencia de cintura (CC) se midió con cinta métrica (Seca 203, Hamburgo, Alemania) de 0,1 cm de precisión, considerando por encima del rango un valor ≥ 88cm en las mujeres y ≥ 102cm en los hombres.
Encuestas
Se efectuaron encuestas de datos demográficos, calidad de vida, percepción de la alimentación, hábitos alimentarios, tabaquismo, sedentarismo, una encuesta de frecuencia de consumo cuantificado (EFCC) y un registro alimentario de una semana. Se utilizaron preguntas de calidad de vida de la Primera Encuesta Nacional sobre Empleo, Trabajo, Salud y Calidad de Vida de los Trabajadores y Trabajadoras en Chile (ENETS) 2010 (10).
La actividad física se estimó a través del Cuestionario Internacional de Actividad Física IPAQ versión corta (11), que mide el nivel de actividad física expresado en MET-minutos/semana o a través de niveles de actividad física bajo, moderado o alto. El presente trabajo se expresa en niveles de actividad física considerando los siguientes puntos de corte para cada una de ellas:
Categoría baja: aquellos individuos que no se pueden situar en los criterios de las categorías moderada o alta fueron considerados como un nivel de actividad física “baja”.
Categoría moderada: a) tres días o más de actividad física de intensidad vigorosa al menos 20 minutos por día o b) cinco o más días de intensidad física moderada y/o andar al menos 30 minutos por día o c) cinco o más días de cualquier combinación de andar, actividad de intensidad moderada y actividad de intensidad vigorosa sumando un mínimo total de actividad física de al menos 600 MET-minutos/semana.
]]> Categoría alta: a) actividades de intensidad vigorosa al menos tres días por semana sumando un mínimo total de actividad física de al menos 1500 MET-minutos/semana o b) siete o más días de cualquier combinación de andar, intensidad moderada o actividades de intensidad vigorosa sumando un mínimo total de actividad física de al menos 3000 MET-minutos/semana.Las encuestas y mediciones fueron realizadas por nutricionistas entrenadas y con experiencia en este tipo de mediciones.
Intervención educativa nutricional
La intervención fue diseñada en base al modelo ecológico social que considera los factores internos de la persona e institucionales, los procesos interpersonales, además de los factores comunitarios y las políticas públicas. La intervención consistió en sesiones de consejería individual y acciones colectivas de apoyo a la alimentación saludable con un “Concurso de descenso de peso” con tres categorías según objetivo de descenso establecido (tres a cinco kg; seis a 10 y más de 10 kg) divididos por sexo. Cada participante acudió a seis encuentros de 30 minutos de duración de consejería en vida sana, a cargo de especialistas en nutrición, en un periodo de cuatro meses.
Consejería individual
En el primer encuentro el profesional de nutrición realizó una encuesta orientada a analizar los factores individuales, familiares y del contexto laboral que influyen en la alimentación. En cada consulta el participante recibió un plan alimentario personalizado diseñado por el profesional; recomendaciones sobre el consumo moderado de grasas, azúcares simples y panificados; motivación para aumentar el consumo de frutas y verduras y realizar actividad física. Además, se le proporcionó de material educativo con información nutricional y junto con ello una planilla para el registro diario de ingesta alimentaria y de la actividad física realizada, la cual debía ser completada todos los días hasta la siguiente consulta, la misma servía para evaluar avances, determinar aspectos a mejorar y establecer objetivos en cada encuentro.
Acciones colectivas de apoyo a la alimentación saludable
Desde el departamento de Recursos Humanos (RRHH) se enviaron semanalmente mensajes de texto saludables al celular de todos los participantes. Además, podían hacer preguntas a los profesionales a través de correo electrónico o whatsapp entre una consulta de consejería nutricional y otra durante el tiempo que duró la intervención.
En forma simultánea se realizaron auditorías a la cocina-comedor para conocer la situación de trabajo y el tipo de menú ofrecido. A partir de estos resultados se elaboró un menú para almuerzos y cenas y se diseñaron opciones saludables para desayunos y meriendas, incorporando frutas y verduras, cereales integrales, legumbres, pescado, pollo y disminuyendo preparaciones con carnes rojas.
En total se realizaron tres visitas de monitoreo para asegurar que se cumpliese lo acordado. Por otro lado, se realizaron envíos de mensajes saludables semanalmente a través del celular y acciones en la cocina comedor, como colocación de afiches con consejos desarrollados en las sesiones de consejería, elaboración de opciones saludables de menú y capacitación en buenas prácticas de manufactura a los empleados que elaboran la alimentación.
]]> Análisis estadísticoPara el análisis de los datos se utilizó el programa estadítico SPSS versión 11.5 (SPSS Inc., Chicago, EEUU). Se utilizó estadística descriptiva para presentar las características generales de los participantes. Posterior a la aplicación de la prueba de normalidad de Kolmogorov-Smirnov, se llevó a cabo la comparación del consumo de frutas, verduras y panificados pre y post intervención, utilizando las pruebas pareadas t de student o prueba de los rangos con signo de Wilcoxon según tenga o no distribución normal. El nivel de significación estadística para esta investigación se estableció en p<0,05.
RESULTADOS
En la Tabla 2 se presenta el efecto de la intervención sobre el estado nutricional por sexo, observándose una disminución significativa del IMC y la circunferencia de cintura en ambos sexos; no se observaron cambios significativos en la PA.
En la Tabla 3 se muestra el consumo de alimentos, destacando el incremento significativo en el consumo de frutas y verduras en la evaluación final. Por otro lado se aprecia una disminución significativa en el consumo de pan, carnes rojas, cereales, cecinas, bebidas azucaradas, mayonesa, chocolate, azúcar/miel, golosinas dulces y saladas.
En la Tabla 4 se observa que el consumo calórico diario total disminuyó en promedio 810,3 calorías desde el inicio al final de la intervención, lo cual también se refleja en una disminución significativa en el FIGURA 1. Nivel de actividad física en la evaluación inicial y final de los participantes del estudio presentaba categoría baja se redujo a 41,1% y del 43,3% que tenía actividad física moderada o alta aumentó a 58,8%.
DISCUSIÓN
Las investigaciones en promoción de la salud y prevención de ECNT en el lugar de trabajo tienen gran importancia para mejorar la calidad de vida de los trabajadores y disminuir el riesgo de adquirir dichas enfermedades. Los lugares de trabajo, junto a las escuelas, son los mejores espacios de intervención para acciones de Promoción de Salud, en particular en los temas relacionados con la alimentación, actividad física y lugares libres de humo de tabaco por ser donde los niños y adultos pasan una parte significativa de su tiempo (12,13)
Debido a que en Paraguay no hay datos publicados al respecto, se diseñó este estudio para evaluar efectividad de una intervención educativa nutricional en empleados administrativos de una empresa de telefonía celular por ser considerada representativa del trabajo en oficinas. A pesar del corto tiempo de la intervención, los resultados obtenidos muestran cambios significativos en el estado nutricional y la CC, lo cual coincide con los resultados publicados en una revisión sistemática (14), que mostró que aquellos programas con duración entre dos y 18 meses que hacían hincapié en consejería nutricional y actividad física, daban lugar a un descenso no mayor a seis kilos.
Por otro lado, se ha visto que en el área del control de peso, los programas implementados en los lugares de trabajo por lo general presentaron altos niveles de deserción y la mitad de la pérdida de peso en comparación con programas similares en la clínica (15). Por esta razón en este estudio se utilizó como estrategia motivacional un “Concurso de descenso de peso” realizado dentro de la compañía, sin costo económico para el trabajador, con premiación a los ganadores, lo cual resultó altamente motivador para los participantes y sin dudas contribuyó con el logro de los objetivos. Esto coincide con los resultados presentados en un estudio de tan solo 12 semanas de duración, donde tanto los empleados como los gerentes reportaron que la competencia fue motivadora y clave para el éxito del programa (16).
]]> La motivación se notó además con el incremento de la actividad física en los niveles moderado y alto y la disminución del nivel bajo como se observa en la mayoría de las investigaciones de promoción de salud en el lugar de trabajo con impacto en el pérdida de peso y la actividad física. (17) . En este sentido sería interesante promover medidas para que la actividad física de los empleados sea considerada una política permanente en la empresa.El aumento significativo en el consumo de frutas y verduras es importante, e inclusive mayor que lo reportado en numerosos estudios que evaluaron el impacto de las actividades de promoción del consumo de frutas y verduras en el lugar de trabajo (18,19). Un aspecto que cabe destacar fue que aquellos que reportaron seguir comiendo entre comidas, lo hacían consumiendo principalmente frutas.
En una revisión que evaluaba los efectos de las intervenciones en el lugar de trabajo sobre la dieta, se encontraron cambios positivos, no sólo en el consumo de frutas y verduras, sino también en la ingesta total de grasas similares a los reportados en esta investigación (20).
En este estudio además se reportó una disminución en la ingesta de panificados, bebidas azúcaradas y alimentos altos en azúcares simples, como las bebidas azucaradas y golosinas dulces y saladas. Esto contrasta con un estudio realizado en Chile en trabajadores de la construcción, donde no hubo cambio en el consumo de bebidas gaseosas azucaradas (8). Esto probablemente se deba al tipo de trabajo que realizan los trabajadores de construcción.
Llama la atención el bajo consumo calórico al inicio de la intervención, por estar la muestra formada en su mayoría por personas con sobrepeso y obesidad; esto puede deberse a que los sujetos obesos subestiman el consumo calórico habitual en los reportes de ingesta (21), sumado a que un año antes de la intervención, este grupo recibió charlas educativas sobre factores de riesgo, lo cual pudo haber dado lugar al sesgo de responder en las encuestas lo que se considera correcto, de acuerdo a la educación recibida y no lo que realmente comieron, como sucedió en el estudio de los mineros de Chile (22).
Estudios de casos reportados por Quintiliani y col. (23) evidencian que el modelo ecológico social puede ser útil en el diseño y evaluación de los efectos de la Promoción de Salud en el ámbito laboral. Este estudio fue diseñado en base al modelo menciondo, teniendo en cuenta tanto la dimensión individual como la colectiva, por lo que cabe destacar que todas las sugerenicas propuestas a la gerencia, tales como modificación del menú, carteles educativos en el comedor, capacitación al personal de cocina, envío de mensajes saludables a través del celular, entre otras actividades, fueron realizadas en tiempo y forma. Para ello, el departamento de RRHH se mostró abierto a las propuestas y sugerencias, acompañando de cerca y en forma permanente todas las etapas del proyecto, lo cual fue una gran fortaleza del estudio y contribuyó al éxito de la intervención.
Otras fortalezas del estudio fueron la elaboración de un proyecto de acuerdo a las necesidades de la población objetivo; la recolección cuidadosa de los datos al inicio, en el proceso y al finalizar la intervención con la descripción detallada de todas las acciones realizadas en cada etapa; el logro de los objetivos propuestos; por lo tanto este estudio puede considerarse ser un modelo de intervención en entornos laborales factible de aplicar en otras empresas del país. Por último, este estudio es el primero y único en el rubro empresas de Paraguay.
Entre las limitaciones se pueden mencionar en primer lugar la selección de la muestra por conveniencia, por ser la única opción disponible para la realización del estudio. En segundo lugar, la falta de un grupo control no permitió hacer comparación con un grupo similar por lo que la efectividad se calculó comparando datos basales y post intervención, de acuerdo a la metodología descrita por Habicht et al. (7).
A pesar de estas limitaciones, los resultados son muy alentadores y demostraron la factibilidad de implementar este tipo de programas en lugares de trabajo, lo cual puede constituirse en un modelo para futuras intervenciones en otras empresas.
Con este estudio se puede concluir que una intervención correctamente realizada en una empresa, con el apoyo de los directivos, del departamento de RR.HH y con un personal técnico de buen nivel, pueden obtenerse resultados positivos con cambios en el estado nutricional y en los hábitos alimentarios de los trabajadores de la empresa. Las metodologías empleadas demostraron ser efectivas, en especial el concurso para bajar de peso, que fue una herramienta motivacional muy bien recibida y estimulante para que los empleados cumplieran las metas de bajar de peso y realizar mayor cantidad de actividad física.
]]> Es necesario seguir investigando para contar con más información sobre los estilos de vida saludable, así como también conocer la prevalencia en ECNT y los factores de riesgo que predominan en las empresas del país, para realizar intervenciones efectivas.REFERENCIAS
1. Ministerio de Salud Pública y Bienestar Social. Indicadores Básicos de Salud: Paraguay 2013.Asunción: MSPyBS;2013. [ Links ]
2. Bloom DE, Cafiero ET, Jané-Llopis E, Abrahams-Gessel S, Bloom LR, Fathima S, et al. The Global Economic Burden of Non-communicable Diseases.Geneva: World Economic Forum;2011. [ Links ]
3. Organización Mundial de la Salud. Impact of out-ofpocket payments for treatment of non-communicable diseases in developing countries: A review of literature. Discussion Paper No.2.Geneva:WHO;2011.
4. Organización Mundial de la Salud. WHO Healthy Workplace, Framework and Model: Background and Supporting Literature and Practices. Geneva:WHO; 2010. [ Links ]
5. Blackford K, Jancey J, Howat P, Ledger M, Lee AH. Office-based physical activity and nutrition intervention: barriers, enablers, and preferred strategies for workplace obesity prevention, Perth, Western Australia, 2012.Prev Chronic Dis.2013;10:13-24. [ Links ]
6. Ministerio de Salud Pública y Bienestar Social. Plan Nacional de Acción para la Prevención y el Control de las Enfermedades Crónicas No Transmisibles 20142024. Paraguay. Asunción: MSPyBS;2014.
7. Habicht JP, Victora C and Vaughan J. Evaluation designs for adequacy, plausibility and probability of public health programme performance and impact. Int J Epidemiol. 1999;28:10-8. [ Links ]
8. Salinas J, Lera L, González CG, Vio F. Evaluación de una intervención educativa nutricional en trabajadores de la construcción para prevenir enfermedades crónicas no transmisibles en Chile. Rev Med Chil.2016;144:194-201. [ Links ]
9. WHO Expert Consultation. Lancet.2004;363:157-63. [ Links ]
10. Ministerios de Salud, Dirección del Trabajo, Instituto de Seguridad Laboral. Primera encuesta nacional de empleo, trabajo, salud y calidad de vida de los trabajadores y trabajadoras en Chile Informe interinstitucional (ENETS 2009-2010) [Internet]. Chile: Gobierno de Chile; 2011 [consultado 5 Jul 2015]. p. 160. Disponible en: http://www.isl.gob.cl/wp-content/uploads/2011/09/Informe-Final-ENETS-nterinstitucional.pdf [ Links ]
11. Craig CL, Marshall AL, Sjostrom M, Bauman AE, Booth ML, Ainsworth BE, et al. International physical activity questionnaire: 12-country reliability and validity. Med Sci Sports Exerc 2003;35:1381-95. [ Links ]
12. Organización Internacional del Trabajo. Un enfoque integral para mejorar la alimentación y nutrición en el trabajo. Estudio en empresas chilenas y recomendaciones adaptadas. Santiago:OIT;2012. [ Links ]
13. Organización Mundial de la Salud. Ambientes de Trabajo Saludables: Un Modelo para la Acción. Para empleadores, trabajadores, autoridades normativas y profesionales. Ginebra: OMS/OPS; 2010. [ Links ]
14. Benedict M, Arterburn D. Worksite-based weight loss programs: a systematic review of recent literature. Am J Health Promot.2008;22:408-16. [ Links ]
15. Foreyt JP, Scott LW, Gotto AM: Weight control and nutrition education programs in occupational settings. Public Health Rep.1980;95:127-36. [ Links ]
16. Stunkard AJ, Brownell KD: Work site treatment for obesity. Am J Psychiatry.1980; 137:252-3. [ Links ]
17. Organización Mundial de la Salud. Recomendaciones mundiales sobre la actividad física para la salud. Suiza:OMS;2010. [ Links ]
18. Da Silva A, Rugani I, Blumenberg D.Impact of the promotion of fruit and vegetables on their consumption in the workplace. Rev Saúde Pública.2013;47:29-36. [ Links ]
19. Bandoni D, Sarno F, Constante P. Impact of an intervention on the availability and consumption of fruits and vegetables in the workplace. Public Health Nutr.2011;14:975-81. [ Links ]
20. Ni Mhurchu C, Aston L, Jebb S.Effects of worksite health promotion interventions on employee diets:a systematic review.BMC Public Health.2010;10:62. [ Links ]
21. Johansson G, Wikman A, Ahrén AM, Hallmans G, Johansson I. Underreporting of energy intake in repeated 24-hour recalls related to gender, age, weight status, day of interview, educational level, reported food intake, smoking habits and area of living. Public Health Nutr.2001;4:919-27. [ Links ]
22. Caichac A, Mediano, Blanco G, Lydia Yáñez CG, Vio F. Intervención en alimentación y nutrición para mineros con factores de riesgo cardiovascular, basada en la investigación formativa.Rev Chil Nutr.2013;40:336-32. [ Links ]
23. Quintiliani L, Poulsen S, Sorensen G. Healthy Eating Strategies in the Workplace. Int J Workplace Health Manag.2010;3:182-96. [ Links ]
^rND^sBlackford^nK^rND^sJancey^nJ^rND^sHowat^nP^rND^sLedger^nM^rND^sLee^nAH^rND^sHabicht^nJP^rND^sVictora^nC and Vaughan J^rND^sSalinas^nJ^rND^sLera^nL^rND^sGonzález^nCG^rND^sVio^nF]]> ^rND^sCraig^nCL^rND^sMarshall^nAL^rND^sSjostrom^nM^rND^sBauman^nAE^rND^sBooth^nML^rND^sAinsworth^nBE^rND^set^nal^rND^sBenedict^nM^rND^sArterburn^nD^rND^sForeyt^nJP^rND^sScott^nLW^rND^sGotto^nAM^rND^sStunkard^nAJ^rND^sBrownell^nKD^rND^sDaSilva^nA^rND^sRugani^nI^rND^sBlumenberg^nD^rND^sBandoni^nD^rND^sSarno^nF^rND^sConstante^nP^rND^sNiMhurchu^nC^rND^sAston^nL^rND^sJebb^nS^rND^sJohansson^nG^rND^sWikman^nA^rND^sAhrén^nAM^rND^sHallmans^nG^rND^sJohansson^nI^rND^sCaichac^nA^rND^sMediano,^nBlanco G^rND^sLydia^nYáñez CG^rND^sVio^nF^rND^sQuintiliani^nL^rND^sPoulsen^nS^rND^sSorensen^nG^rND^nFulgencio^sVilcanqui-Pérez^rND^nCarlos^sVílchez-Perales^rND^nFulgencio^sVilcanqui-Pérez^rND^nCarlos^sVílchez-Perales^rND^nFulgencio^sVilcanqui-Pérez^rND^nCarlos^sVílchez-PeralesFibra dietaria: nuevas definiciones, propiedades funcionales y beneficios para la salud. Revisión
Fulgencio Vilcanqui-Pérez, Carlos Vílchez-Perales
Departamento de Nutrición, Universidad Nacional Agraria la Molina, La Molina, Lima, Perú.
Escuela Académico Profesional de Ingeniería Agroindustrial, Universidad Nacional Micaela Bastidas de Apurímac, Abancay, Apurímac, Perú.
RESUMEN
En los últimos diez años hubo importantes modificaciones en la definición de la fibra dietaria bajo la dirección de la Comisión del CODEX Alimentarius. El más importante fue la inclusión de los carbohidratos no digeribles de 3 a 9 unidades de grado de polimerización dentro de la definición química, la que fue adoptada algunos países y en otras están en proceso de evaluación tal como los Estados Unidos; lo que hace que no exista un consenso global. Donde sí hay un consenso es en la definición fisiológica de la fibra dietaria, considerada como grupo de carbohidratos resistentes a la digestión por las enzimas del intestino delgado y fermentado en forma parcial o total en el colon, con efectos favorables en la salud. La Association of Official Analytical Chemist (siglas en Inglés: AOAC), en armonía con la nueva definición del CODEX Alimentarius, establecieron los métodos AOAC 2009.01 y 2011.25, diseñado para cuantificar la fibra dietaria solubles, fibra dietaria insoluble y la fibra dietaria total. En este contexto, se vienen desarrollando investigaciones in vitro e in vivo (en animales y humanos) para demostrar los efectos fisicoquímicos, funcionales y fisiológicos que van orientados hacia la prevención y tratamiento de algunas enfermedades no transmisible (ENTs). La presente revisión, pretende informar de las nuevas definiciones y los métodos de análisis, las propiedades funcionales y fisiológicas de la fibra dietaria y sus efectos en la salud humana.
Palabras clave: Fibra dietaria. Definición. Propiedades funcionales. Propiedades fisiológicas. Sobrepeso y obesidad.
Dietary fiber: New definitions, functional properties and health benefits. Review
SUMMARY.
]]> In the last ten years there have been important changes in the definition of dietary fiber under the leadership of the CODEX Alimentarius Commission. The most important was the inclusion of non-digestible carbohydrates of 3 to 9 units of degree of polymerization within the chemical definition, which was adopted in some countries and in others are in the process of evaluation such as the United States which indicates that does not exist a global consensus. Where there is a consensus is in the physiological definition of dietary fiber, considered as a group of carbohydrates resistant to the digestion by enzymes of the small intestine and fermented partially or totally in the colon, with favorable health effects. The Association of Official Analytical Chemists (AOAC), in line with the new definition of CODEX Alimentarius, established the AOAC 2009.01 and 2011.25 methods, designed to quantify soluble dietary fiber, insoluble dietary fiber and total dietary fiber. In this context, In Vitro and In Vivo research (in animals and humans) are being carried out to demonstrate the physicochemical, functional and physiological effects that are directed towards the prevention and treatment of some non-communicable diseases (NCDs). This review aims to inform the new definitions and methods of analysis, the functional and physiological properties of dietary fiber and their effects on human health.Key words: Dietary fiber. Definition. Functional properties. Physiology properties. Overweight and obesity.
Recibido: 30-10-2016 Aceptado: 21-03-2017
INTRODUCCIÓN
Hay un gran interés por conocer los conceptos, la clasificación, los métodos de análisis, las propiedades fisicoquímicas, funcionales, fisiológicas y sus efectos en la salud de la fibra dietaria, como una respuesta al incremento de las ENTs. Los organismo oficiales como el CODEX Alimentarius Commission (CAC), the United States Institute of Medicine (IOM), Health Canadá, European Food Safety Authority (EFSA), Food Standars Australia and New zealand (FSANz), y American Association of Cereal Chemists International (AACCI), entre otros, se han preocupado por uniformizar la definición de la fibra dietaria, basados en la composición química y el rol fisiológico que cumple a favor de la salud (1). En 2009, el CODEX Alimentarius ha incluido dentro de la definición de la fibra dietaria a moléculas de bajo peso molecular todas ellas con funciones importantes a favor de la salud humana. La clasificación y los métodos de análisis también han
experimentado modificaciones conforme a las definiciones que fueron adoptando a lo largo del tiempo, pero principalmente en el método enzimático-gravimétrico (2). Existen recientes investigaciones con nuevas fuentes de fibra dietaria bajo la luz de los conocimientos de su grado de solubilidad, capacidades de hidratación y fermentación y el tamaño del peso molecular; con efectos importantes sobre las propiedades fisiológicas. Al mismo tiempo se han identificado los diferentes mecanismos de regulación del sobrepeso y la obesidad, el índice glucémico y diabetes tipo II, cáncer en el colon, estreñimiento y enfermedad cardiovascular; en conjunto conocidos como ENTs.
FIBRA DIETARIA: DEFINICIÓN, CLASIFICACIÓN Y MÉTODOS DE ANÁLISIS
Definición
La definición de la “fibra dietaria” se remonta al año 1953 realizada por Hipsley, refiriéndose al constituyente no digerible de las paredes celulares de los vegetales (3); desde entonces, el concepto ha sido objeto de varias revisiones. Más adelante (1960 a 1970), se propone la hipótesis de la relación entre el consumo inadecuado de la fibra dietaria y algunas enfermedades de los países desarrollados. En este mismo periodo, se define a la fibra dietaria como la suma de polisacáridos de origen vegetal constituidos por celulosa, hemicelulosa y lignina, que no son digeridas por las secreciones endógenas del tracto digestivo de los mamíferos (4) y Trowell en 1985, incluye a los oligosacáridos, pectinas, gomas y ceras (5). En 2000, la AACC define a la fibra dietaria como las partes comestibles de las plantas o análogos de los carbohidratos resistentes a la digestión y absorción en el intestino delgado humano y con fermentación parcial o completa en el intestino grueso, en cuya composición se incluyen a polisacáridos, oligosacáridos, lignina y sustancias asociadas a las plantas (5). Desde el punto de vista de la salud, la fibra dietaria debe promover efectos atenuantes de los niveles de colesterol y glucosa, estos últimos relacionados con la diabetes tipo 2, obesidad, cáncer del colon y enfermedades cardiovasculares (6-9). Como se pudo evidenciar, la definición de la fibra dietaria ha sido abordada en diferentes periodos, sin encontrar un consenso. En el año 2009, después de dos décadas de discusión, el CODEX Alimentarius, a través de sus delegados científicos, pretende armonizar la definición. Entre los más importantes fue la inclusión de polímeros no digeribles de 3 a 9 grados de polimerización, tales como la inulina, FOS, GOS, maltodextrinas resistentes, rafinosa y otros. Al mismo tiempo, ha reconocido a la lignina y otros componentes menores (polifenoles, ceras, saponinas, fitatos, cutinas y fitoesteroles) como parte de la fibra dietaria, siempre en cuando estén asociados a los componentes de la pared celular vegetal (10-13). Sin embargo, el dilema persiste porque al final de la definición del CODEX Alimentarius, se hace notar de la libertad que tendrían las autoridades competentes de cada país respecto a la inclusión de carbohidratos de 3 a 9 unidades monoméricas. Los países como Canadá, Australia, Nueva zelanda, Unión Europea, Brasil, Chile, China, Indonesia, Corea, Malasia, México y Tailandia adoptaron la sugerencias; sin embargo, países como los Estados Unidos de América están a la espera de la decisión de la autoridad competente (14,10,1). Por lo tanto, no existe una definición química generalizada de la fibra dietaria, más aún cuando existen sugerencias de la exclusión de estos polímeros de bajo peso molecular. Donde sí existe consenso es en la definición fisiológica considerada como grupo de polímeros y oligómeros de carbohidratos (incluyendo a lignina) que escapan a la digestión del intestino delgado y pasan al intestino grueso, donde son fermentados en forma parcial o completa por la microbiota intestinal. Además las fibras deben evidenciar efectos de laxación, atenuación de los niveles de glucosa en la sangre y la reducción del colesterol (5).
2.2. Clasificación y métodos de análisis de la fibra dietaria
]]> La forma más sencilla de clasificar a la fibra dietaria es de acuerdo a su grado de hidratación con el agua: solubles e insolubles (15,8,10). Otro criterio de clasificación es de acuerdo al grado de fermentación por las enzimas del intestino humano (14). Existe una estrecha relación entre las propiedades de solubilidad y fermentación; por ejemplo, dentro de las fibras dietarias de bajo peso molecular (siglas en Inglés: LMWDF) de 3 a 9 grados de polimerización se encuentran la inulina, FOS, GOS que son solubles y altamente fermentables (10). En cambio, dentro de las fibras solubles de alto peso molecular (siglas en Inglés: HMWDF) mayores a 9 grados de polimerización se encuentran las altamente fermentables tales como los almidones resistentes en sus diferentes tipos, pectina, goma guar y otros. Dentro de las fibras HMWDF con fermentación intermedia está la avena. Además, en el grupo HMWDF se encuentran las fibras insolubles con baja o escaza fermentación tales como salvado de trigo, frutas y verduras; finalmente, las HMWDF insolubles no fermentables están la celulosa, lignina y metilcelulosa (16,10). En la Tabla 1, se puede observar la distribución de la fibra dietaria de acuerdo al peso molecular, precisando que la inulina proveniente de las plantas puede tener desde 3 hasta 200 grados de polimerización y forman soluciones de baja viscosidad (17). Las fibras insolubles pueden ser convertidas en fibras solubles mediante tratamientos químicos, pero con modificaciones en el aspecto sensorial; sin embargo, tratamientos con trichoderma (organismo productor de enzimas celulolíticas) han sido probados con mucho éxito y se ha logrado el incremento en tres veces el contenido de fibra soluble, sin disminuir el contenido total de fibra dietaria (18). Algunos investigadores consideran que el criterio de clasificación de soluble e insoluble de la fibra debe quedar obsoleta y proponen su reemplazo por viscosos y no viscosos o fermentables y no fermentables, precisamente porque no todas las fibras solubles tienen la misma capacidad viscosa, tal como la inulina que forma solución de baja viscosidad (19); sin embargo, el criterio de clasificación por su grado de hidratación seguirá siendo pertinente y vigente, puesto que las propiedades fisicoquímicas, los efectos funcionales y fisiológicos dependen del grado de solubilidad.Tan importante como la definición de fibra dietaria, es identificar los métodos apropiados para cuantificar su contenido, pues los alimentos tienen diferentes tipos de fibra; esto implica que las cantidades pueden sobre o sub estimarse cuando no hay una selección apropiada. Los métodos se pueden resumir en no enzimático-gravimétrico, enzimático-gravimétrico, enzimático-químico, enzimático-colorimétrico y enzimático-cromatográfico (2). El método no enzimático-gravimétrico fue el primero en su diseño por los años sesenta con cierta vigencia, pues en el análisis proximal de alimentos para animales y humanos aún es utilizado y conocido como la “fibra cruda” o “fibra bruta”; que viene a ser el residuo de la digestión ácida y alcalina. Entre otros métodos también están los tratamientos con bromuro de cetyl trimetil amonio conocido como fibra ácido detergente (FAD) y con lauril sulfato de sodio como fibra neutro detergente (FND), diseñados específicamente para cuantificar la celulosa, hemicelulosa y lignina (20-21,2). Los tratamientos con ácidos y detergentes han sido cuestionados debido al uso de reactivos muy agresivo puesto que durante la hidrólisis de proteínas y almidones también lo hacían con algunas fibras, dando como resultados la subestimación de una buena cantidad de fibra dietaria, por lo que no es recomendable para alimentos.

Desde 1985 el método oficial para medir la fibra total, fibra dietaria soluble e insoluble es el método AOAC 985.29 (enzimático-gravimétrico), que consisteen la digestión de los carbohidratos y proteínas por las enzimas (13,22). Este método permite cuantificar a la fibra dietaria de alto peso molecular, lignina, algunos almidones resistentes, inulina; pero subestima por ejemplo a las maltodextrinas resistentes y algunos oligosacáridos (1). Así, se fueron diseñando varios métodos reconocidos por la AOAC, pero todos ellos con algunas limitaciones. Los métodos más recientes adoptados por la AOAC son la AOAC 2009.01 y AOAC 2011.25; métodos que tienen las mejores aproximaciones porque permite cuantificar a polisacáridos no almidonosos, lignina, almidones resistentes, inulina, oligosacáridos, polidextrosa y maltodextrinas resistentes, acorde con la nueva defición (1); razón por el cual, estos últimos son los más utilizados, tanto para trabajos de investigación y con fines de etiquetado de alimentos.
PROPIEDADES FUNCIONALES DE LAS FIBRAS DIETARIAS
Solubilidad y viscosidad
Las propiedades de solubilidad y viscosidad tienen profundos efectos en la funcionalidad de fibra dietaria durante el procesamiento de alimentos y en el trayecto gastrointestinal (23). Si la estructura del polisacárido es tal que las moléculas forman una matriz cristalina (celulosa), es muy probable que sea energéticamente más estables, es decir insolubles; y por el contrario mientras sea mayor la ramificación (goma de acacia), con presencia de grupos iónicos (pectina metoxilada) incrementan la solubilidad. Las alteraciones en las unidades de monosacáridos y sus formas moleculares (goma xantana y goma de acacia) incrementan la solubilidad (5).
La viscosidad se describe como la resistencia al flujo cuando se aplica un esfuerzo de corte. En general, con el aumento del peso molecular y la longitud de la cadena (goma guar), incrementa la viscosidad de la solución de la fibra; sin embargo, dependen también de la concentración de la fibra dietaria en la solución, la temperatura, el pH y las condiciones del esfuerzo de corte. La formación de la viscosidad y geles del contenido estomacal juegan un rol importante en los efectos fisiológicos y bioquímicos, puesto que al formar una estructura tridimensional, reduce el contacto físico entre las enzimas digestivas y los nutrientes que son arrastrados por la materia fecal sin haber sido digeridos y absorbidos a través del intestino (5,24).
Fermentabilidad
]]> La fermentación de la fibra dietaria varía de acuerdo al grado de solubilidad desde una fermentación completa (pectina), pasando por fermentación mediana (hemicelulosa) y hasta una fermentación nula (lignina). La fermentación es producida por la microbiota intestinal, principalmente por los microorganismos anaeróbicos distribuidos en dos phylus: Firmicutes ( Ruminococcus, Clostridium, Eubacterium, Lactobacillus ) con 60 %, Bacteroidetes (Alistipes, Prevotella, Bacteriodes) con 15 % y con un número significativo de Actinobacteria (Bifidobacterium) y Protobacteria (25). La fermentación de la fibra dietaria juega un rol importante en los efectos fisiológicos y bioquímicos (regulación del sobrepeso y la obesidad) puesto que a partir de ella se producen los ácidos grasos de cadena corta (AGCC) tales como el butirato, propionato y acetato; metabolitos que están involucrados con la promoción y/o inhibición de ciertas hormonas responsables de la estimulación de saciedad y apetito (26,27). La manzana con alto contenido de pectina, el plátano y los tubérculos con altos contenidos de almidón resistente, han demostrado una fermentación rápida y completa; sin embargo, todos ellos contribuyen escasamente con el aumento del volumen fecal. Por otro lado, el Psyllium y el salvado de trigo fermentan lentamente; y están más asociados al incremento de la masa y volumen fecal (23).Capacidad de hidratación
Las propiedades de hidratación determinan en gran medida el destino de la fibra dietaria en el tracto digestivo y representan algunos de los efectos fisiológicos (5). Las fibras solubles como la pectina, los βglucanos, algunas hemicelulosas, la goma de acacia y entre otros, forman con el agua un retículo, lo que origina soluciones de gran viscosidad que atrapan moléculas de grasa y evitan el contacto con las sales biliares resultando en modificación del metabolismo lipídico, disminución de lipoproteínas formadoras de placas, reducción del colesterol y disminución de glucosa postprandial. También es conocido de su potencial anticarcinógeno debido a que atrapan diversas sustancias tóxicas que se introducen a través de los alimentos, evitando que entren en contacto con la mucosa intestinal y favorece su eliminación a través de las heces (16). En varias investigaciones, se han reportado la propiedad de hidratación expresada en la capacidad de absorción del agua (CAA), capacidad de retención del agua (CRA) y la capacidad de hinchamiento (CH), propie dades que proveen información útil para las aplicaciones tecnológicas, funcionales y nutricionales (28). En la Tabla 2 se pueden observar que las fuentes de fibra de tipo soluble son las que tienen mejores propiedades de hidratación tal como el musgo ( Sphagnum magellanicum ), el albedo de maracuyá, éste último debido al alto contenido de pectina; sin embargo, no es el único factor que influye sobre esta propiedad, pues también dependen del área específica de superficie, porosidad, densidad, tamaño de partículas y la microestructura de la fibra (29).
Capacidad de adsorción de moléculas orgánicas
La capacidad de adsorción de grasa es otra de las propiedades importantes de la fibra dietaria con fines de estabilización de emulsiones en el procesamiento de alimentos con alto contenido de grasa, al igual que para observar los efectos fisiológicos en humanos (30). La fibras dietarias ricas en ácidos urónicos y compuestos fenólicos, tienen la capacidad de secuestrar e incluso unirse químicamente a los ácidos biliares, mecanismo más sugerido de su acción hipocolesterolemiante. Sin embargo, las condiciones ambientales (tiempo de exposición, el pH), las formas físicas, químicas, las propiedades de superficie y la naturaleza de los ácidos biliares también influyen en la capacidad de adsorción (5). La capacidad de adsorción de grasa se cuantifica por la adición a la muestra seca de la fibra un exceso de aceite, homogenizado; luego por el centrifugado. Por diferencia de pesos se obtiene el valor de esta propiedad. Otra técnica para determinar la capacidad de adsorción de moléculas orgánicas es a través de la medida del índice de retardo de la acción de ácido biliar simulado in vitro (28,31). La fibra dietaria, también tiene la capacidad de adsorber a la glucosa y reducir la digestibilidad del almidón, las que pueden ser evaluados mediante pruebas in vitro (28). Se han identificado que la lignina, pectina y galactomananos (goma guar) son las fibras dietarias con mayor capacidad para unirse a las moléculas orgánicas (32).
FIBRA DIETARIA, SALUD Y CANTIDADES RECOMENDADAS
Sobrepeso y obesidad
Se define como un factor de riesgo para las enfermedades como la diabetes, cardiopatía, hipertensión arterial, accidentes cerebrovasculares y algunas formas de cáncer (33,34). Este factor se caracteriza por una excesiva acumulación de la grasa que conducen a una composición cuyo contenido de grasa corporal supera un estándar prefijado según la altura, edad y sexo. El consumo de alimentos con bajo contenido de fibra dietaria, está relacionado con el sobrepeso y obesidad (35,36); considerada por la Organización Mundial de la Salud (OMS) como una epidemia de escala mundial que afecta a las personas de todas las edades y de diferentes estratos sociales (37,38).


El tercer mecanismo, también llamado efectos colónico-hormonales, se produce cuando la fibra dietaria es fermentada por las bacterias del colon hasta convertir en glucosa, siguiendo éste último la ruta de la glicólisis hasta convertirse en piruvato. Luego es convertido en AGCC, tales como el acetato (2 carbonos), propionato (3 carbonos) y butirato (4 carbonos) en proporciones de 60:25:15 (28). Los AGCC son potentes mediadores en células enteroendocrinas secretoras de hormonas péptido similar al glucagon (siglas en Inglés: GLP-1), péptido tirosina-tirosina (siglas en Inglés: PYY), grelina y leptina reguladoras del apetito y saciedad (42,9). El incremento de la concentración de GLP1 y PYY en la sangre, ejercen efectos anorexigénicos a nivel del sistema nervioso central, teniendo como resultado el incremento de la saciedad y la disminución del apetito (42). Por el contrario, la grelina reduce su concentración y como consecuencia la disminución del apetito (33,43). En estudios realizados con ratas adultas, la inclusión en la dieta del 10 % de pectina, tuvo el incremento de las concentraciones plasmáticas de PYY y GLP-1 en 168 y 15 %, respectivamente; en cambio la leptina se redujo en un 62 % (44). Por otro lado, la inclusión de 3,4 g y 6,8 g de Psyllium (fibra soluble) en personas voluntarias y sanas, por dos y tres días antes del desayuno y antes de la comida del medio día; concluyeron que la fibra soluble contribuye en gran medida a la sensación de satisfacción y reducción del hambre (45).
Indice glucémico y diabetes tipos II
En países desarrollados y en vías de desarrollo, la diabetes tipo 2 es reconocida como un problema importante para la salud; fisiopatología que ocasiona la disminución de la sensibilidad de insulina y la alteración de la función de las células β del páncreas que conduce a la hiperglicemia (46). En la actualidad, la ingesta de alimentos ricos en fibra dietaria ya sea en forma natural (cereales y leguminosas integrales), enriquecidos con fibra dietaria o como fibras purificadas; son consideradas como una terapia médica y es una buena estrategia para reducir la hiperglucemia postprandial en pacientes con diabetes tipo 2. Los mecanismos están basados en la reducción de la densidad en calorías de los alimentos, tiempo prolongado de masticación, aumento de la saciedad, retraso en el vaciamiento gástrico y atenuación de la velocidad de absorción de la glucosa en el intestino delgado debido a que la fibra tiene la capacidad de adsorber y retener moléculas orgánicas tal como la glucosa y grasa (46,47).
Estudios en humanos, han demostrado que el consumo de 15 g/día de fibra reduce significativamente la diabetes (41). Estudios específicos mediante la administración de 6 g de goma guar parcialmente hidrolizada (fibra soluble) en cada comida por 12 meses, redujo significativamente los niveles de glucosa postprandial en el plasma y los triglicéridos; reducción del colesterol unido a lipoproteínas de baja densidad (siglas en Inglés: cLDL) y el incremento significativo del colesterol unido a lipoproteínas de alta densidad (siglas en Inglés: cHDL), atribuidos principalmente a la formación de la viscosidad del contenido del lumen (48) que atrapa a los ácidos biliares y son excretados junto a las heces; de este modo se interrumpe la circulación entero hepática de estos compuestos. Por otro lado, la Asociación Americana de Diabetes (sigla en Inglés: ADA) recomienda el consumo de fibra entre 20 a 25 g/día (soluble e insoluble) en personas saludables para mantener un mejor control glicémico e insulínico y en pacientes con diabetes tipo 2, hasta 50 g/día de fibra; aunque esta cantidad puede presentar limitaciones en la palatabilidad y problemas gastrointestinales secundarios (1).
Cáncer
El cáncer del colon y del recto representa una causa muy importante de morbilidad y mortalidad en todo el mundo, especialmente en los Estados Unidos de Norteamérica, Europa y en algunos países del Asia (49). En un principio, se habían afirmado que alimentos con alto contenido de fibra dietaria estarían asociados con la disminución significativa de 40 a 45 % de riesgo de desarrollar cáncer y es más, alimentos como los granos, cereales y frutas fueron atribuidos como los que más reducen el cáncer colorectal (50). Los posibles mecanismos anticancerígenos serían el incremento de la masa fecal y la reducción del tiempo de tránsito intestinal, la reducción de la producción del ácido biliar secundaria, la formación de los ácidos grados de cadena corta fruto de la fermentación de las bacterias del colon, reducción del pH del colon, adsorción de los carcinógenos fecales por la fibra y la reducción a la resistencia a la insulina (51,52). Sin embargo, en estudios epidemiológicos, la afirmación anterior fue cuestionada, puesto que se encontraron resultados contradictorios, sin detectar evidencias visibles sobre el efecto protector de la fibra dietética contra el cáncer colorectal (49). Debido a estas inconsistencias, en el año 2011, el Fondo Mundial para la Investigación del Cáncer (siglas en Inglés: WCRF), ha publicado un informe en cuyas conclusiones señalan que no hay “probable” efecto protector de los alimentos con alto contenido de fibra dietética sobre el riesgo de padecer de cáncer colorectal (49); por lo que en la actualidad, los investigadores están empeñados en identificar otros factores que podrían estar involucrados tales como la edad, la dependencia genética del cáncer, la etnia y la etapa de vida; siendo necesario realizar futuras investigaciones y ajustar posibles covariables (50).
Enfermedad cardiovascular
]]> Recientes estudios demuestran en forma consistente una asociación inversa entre la ingesta de alimentos ricos en fibra dietética y el riesgo de enfermedad coronaria; por consiguiente, la disminución de la enfermedad cardiovascular. Los mecanismos propuestos apuntan básicamente a las fibras solubles que forman altas viscosidades para la reducción de las concentraciones del cLDL, sin afectar las concentraciones del cHDL (41). Las alteraciones en la absorción del colesterol, ácidos biliares y el metabolismo hepático del colesterol debido a la formación de la viscosidad por la presencia de la fibra soluble es otro mecanismo que explica la reducción de la enfermedad cardiovascular (23). El consumo de 14 g de fibra dietaria por cada 1000 kcal de energía protege de las enfermedades cardiovasculares, específicamente el consumo de fibras solubles y específicamente el consumo de 3 o más gramos de β-glucanos al día, disminuye el colesterol total y el cLDL entre 0,25 y 0,30 mol/L, sin variar la cantidad de cHDL o triglicéridos en la sangre (41). Por otra parte, el consumo de 2 a 10 g de semilla de Plantago psyllium al día, disminuye los niveles de colesterol total en 1,55 mg/dL por cada g de semilla consumido, en tanto que el cLDL disminuye en 2,7 mg/dL (53).Estreñimiento
La Asociación Americana de Gastroenterología describe al estreñimiento como un trastorno basado en los síntomas de defecación insatisfactoria, caracterizado por el movimiento poco frecuente del intestino, dificultades en el paso de las heces, sensación incompleta, heces duras y voluminosas y tiempos prologados (54). La ingesta de alimentos con bajo contenido en fibra dietaria ha sido relacionada con el estreñimiento, problema clínico común que afecta a los niños y adultos. En la mayor parte de los casos se presentan como un efecto secundario por el uso de medicamentos para el tratamiento de varias enfermedades (55,56). La ingesta de la fibra dietaria se traduce en el incremento de la masa, volumen fecal y la velocidad de tránsito intestinal; como consecuencia de la ingesta de alimentos que contienen celulosa, hemicelulosa y lignina (fibras insolubles) gracias a la capacidad de retención de agua y formación de mezclas de baja viscosidad (40, 41). El salvado de trigo, con 45,6 % de fibra insoluble y 2,4 % de fibra soluble, ha demostrado tener una gran capacidad para el incremento de la masa y volumen fecal, por consiguiente en la reducción del tiempo de tránsito intestinal; debido a la estimulación mecánica, promoción de los movimientos regulares y al peristaltismo (57,16). Por el contrario, las fibras solubles como la pectina, no tienen efectos significativos sobre la masa y el volumen fecal; aunque en algunas investigaciones señalan que pueden contribuir al incremento de la masa microbiana fruto de la fermentación; pues los microorganismos del colon tienen un contenido del 80 % de agua (58). La producción de los gases debido a la fermentación de las fibras solubles, formación de masa viscosa y al atrapamiento en el colon puede tener efectos en el volumen de las heces y una disminución del tiempo de tránsito intestinal (23).
Cantidades recomendadas
Las recomendaciones para la ingesta de la fibra dietaria están en función a la edad, género y la cantidad de energía ingerida. En términos generales el consumo diario de la fibra dietaria debe estar en el rango de 18 a 38 g/día para personas adultas. Específicamente para los Estados Unidos y Canadá, la Academia Nacional de Ciencias y el Instituto de Medicina de USA, recomiendan el consumo de 25 y 38 g/día para mujeres y hombres respectivamente (1). Para los niños, una recomendación sencilla es la efectuada por la Academia Americana de Pediatría (siglas en Ingles: AAP), que consiste en la suma de la edad del niño (años) con 5 g de fibra/día; es decir un niño de cinco años debería de consumir 10 g/día de fibra (54). En cambio para las personas de 9 a 13 años de edad, la Academia de Nutrición y Dietetica recomienda el consumo de 26 y 38 g/día de fibra para mujeres y varones respectivamente (61). Los valores actuales en el consumo de fibra dietaria están muy por debajo de los niveles recomendados, por ejemplo en los Estados Unidos la ingesta media es de 12-15 y 16,5-19,4 g/día para mujeres y hombres respectivamente (1); siendo los adolescentes los más propensos en cumplir las recomendaciones.
CONCLUSIONES
Existe un consenso universal en la definición fisiológica de la fibra dietaria como un grupo de polímeros y oligómeros de carbohidratos que escapan a la digestión en el intestino delgado y pasan al intestino grueso, donde son fermentados en forma parcial o completa por la microbiota intestinal, con evidencias a favor de la salud. Sin embargo, desde el punto de vista químico; aún existen controversias relacionados con aquellas moléculas de 3 a 9 grados de polimerización, cuya inclusión fue propuesta por el CODEX Alimentarius y sin haber sido adoptado por la totalidad de sus países miembros. El método enzimático-gravimétrico adoptados por la AOAC con códigos de 2009.01 y 2011.25, son los que mejor se adaptan a la definición establecida por el CODEX Alimentarius.
Las fibras solubles tienen mejores propiedades de hidratación que conducen a la formación de viscosidad, fermentación, y producción de AGCC que estimulan la producción de GLP1, PYY; hormonas que regulan el apetito y la saciedad; mecanismo importantes para la modulación del sobrepeso y la obesidad. En cambio las fibras insolubles están relacionadas con el incremento de la masa y el volumen fecal, reducción del tiempo de tránsito intestinal con posibilidades del control del estreñimiento y el cáncer en el colon.
AGRADECIMIENTOS
Los autores agradecen al Fondo Nacional de Desarrollo Científico, Tecnológico y de Innovación Tecnológica – FONDECYT, Convenio de Subvención N° 275-2015-FONDECYT.
]]> REFERENCIAS1. Miller J. CODEX-aligned dietary fiber definitions help to bridge the “fiber gap”. Nutr J. 2014; 13(1):1-10. [ Links ]
2. Elleuch M, Bedigian D, Roiseux O, Besbes S, Blecker C, Attia H. Dietary fibre and fibre rich by-product of food processing: Characterization, technological functionality and commercial applications. Food Chem. 2011; 124(2):411-421. [ Links ]
3. Hipsley HB. Dietary “Fibre” and pregnancy Toxaemia. Br Med J. 1953; 2(4833):420-422. [ Links ]
4. Burkitt DP, Walker ARP, Painter NS. Effect of dietary fibre on stools and transit times, and its role in the causation of disease. Lancet II. 1972; 300(7792):14081411. [ Links ]
5. Dhingra D, Michael M, Rajput H, Patil RT. Dietary fibre in foods: a review. J Food Sci Technol. 2012; 49(3):255-266. [ Links ]
6. DeVriers JW. On defining dietary fibre. Proc Nutr Soc. 2003; 62:37-43. [ Links ]
7. Cherbut C. Inulin and oligofructose in the dietary fibre concept. Br J Nutr. 2002; 87(2):S159-S162. [ Links ]
8. Escudero E, González P. La fibra dietética. Nutr Hosp. 2006; 21(2):61-72. [ Links ]
9. Lattimer JM, Haud MD. Effects of dietary fiber and its components on metabolic health. Nutrients. 2010; 12(2):1266-1289. [ Links ]
10. Westenbrink S, Brunt K, van der Kamp JW. Dietary fibre: Challenges in production and use of food composition data. Food Chem. 2013; 140(3):562-567. [ Links ]
11. CODEX Alimentarius Commision. 2009. Report on the 30th session of the Codex Committee on Nutrition and Foods for Special Dietary Uses, Appendix II, p. 46. In: Codex Alimentarius Commission, ALINORM 09/32/26 Rome, Italy. 83 p. [ Links ]
12. De Menezes EW, Giuntini EB, Dan MCT, Sardá FAH, Lajolo FM. Codex dietary fibre definition-justification for inclusion of carbohydrates from 3 to 9 degrees of polymerisation. Food Chem. 2013; 140(3):581-585. [ Links ]
13. McCleary BV, De Vries JW, Rader JI, Cohen G, Prosky L, Mugford DC, Champ M, Okuma K. Determination of total dietary fiber (CODEX definition) by enzymatic-gravimetric method and liquid chromatography: Collaborative study. J AOAC Int. 2010; 93(1): 221-233. [ Links ]
14. Fuller S, Beck E, Salman H, Tapsell L. New Horizons for the study of dietary fiber and health: A review. Plant Foods Hum Nutr. 2016; 71(1):1-12. [ Links ]
15. Papathanasopoulos A, Camilleri M. Dietary fiber supplements: effects in obesity and metabolic syndrome and relationship to gastrointestinal functions. Gastroenterol. 2010; 138 (1):65-72. [ Links ]
16. Eswaran S, Muir J, Chey WD. Fiber and functional gastrointestinal disorders. Am J Gastroenterol. 2013; 108(5):718-727. [ Links ]
17. Shoaib M, Shehzad A, Omar M, Rakha A, Raza H, Sharif HR, et al. Inulin: properties, health benefits and food applications. Carbohydr Polym. 2016; 147:444454. [ Links ]
18. Chawla R, Patil GR. Soluble fiber dietary. Food Sci Food Saf. 2010; 9(2):178-196. [ Links ]
19. Slavin J. Dietary fiber and body weight. Nutrition. 2005; 21(3):411-418. [ Links ]
20. Mertens DR. Challenges in measuring insoluble dietary fiber. J Anim Sci. 2003; 81(12):3233-3249. [ Links ]
21. Southgate DAT, Hudson GJ, Englyst H. The analysis of dietary fibre the choices for the analyst. J Sci Food Agric. 1978; 29(11):979-989. [ Links ]
22. Prosky L. Determination of total dietary fiber in foods products and total diet. J Assoc Off Chem. 1984; 67:1044-1052. [ Links ]
23. Mudgil D, Barak S. Composition, properties and health benefits of indigestible carbohydrate polymers as dietary fiber. A review. Int J Biol Macromolec. 2013; 61:1-6. [ Links ]
24. Isken F, Susanne K, Osterhoff M, Pfeiffer A, Weickert M. Effects of long-term soluble vs. insoluble dietary fiber intake on high-fat diet-induced obesity in C57BL/6J mice. J Nutr Biochem. 2010; 21(4):278248. [ Links ]
25. Lopez - Legarrea P, Fuller NR, zulet MA, Martinez JA, Caterson ID. The influence of mediterranean, carbohydrate and high protein diets on gut microbiota composition in the treatment of obesity and associated inflammatory states. Asia Pac J Clin Nutr. 2014; 23(3):360-368. [ Links ]
26. Romo-Vaquero M, Selma MV, Larrosa M, Obiol M, Garcia-Villalba R, González L, et al. Rosemary extract rich in carnosic acid selectively modulates caecum microbiota and inhibits β-glucosidase activity, altering fiber and short chain fatty acids fecal excretion in lean and obese female rats. PloS one. 2014; 9(4): e94687. [ Links ]
27. Layden BT, Angueira AR, Brodsky M, Durai V, Lowe WL. Short chain fatty acids and their receptors: new metabolic targets. Transl Res. 2013; 161(3):131-140. [ Links ]
28. Ma MM, Mu TH. Effects of extraction methods and particle size distribution on the structural, physicochemical, and functional properties of dietary fiber from deoiled cumin. Food Chem. 2016; 194:237-246. [ Links ]
29. Lopez JH, Fernandez J, Pérez JA, Viuda M. Chemical, physico-chemical, technological, antibacterial and antioxidant properties of dietary fiber powder obtained from yellow passion fruit ( Passiflora edulis var. flavicarpa ) co-products. Food Res Int. 2013; 51(2):756763. [ Links ]
30. Yaich H, Garna H, Bchir B, Besbes S, Paquot M, Richel A, et al. Chemical composition and functional properties of dietary fibre extracted by Englyst and Prosky methods from the alga Ulva lactuca collected in Tunisia. Algal Res. 2015; 9:65-73. [ Links ]
31. Alarcón MA, López JH, Restrepo DA. Characterization of technological functionality of dietary fiber rich source obtained from plantain peel. Rev. Fac. Nal. Agr. Medellin. 2013; 66(1): 6959-6968. [ Links ]
32. Villarroel M, Acevedo C, Yañez E, Biolley E. Propiedades funcionales de la fibra del musgo Sphagnum magellanicum y su utilización en la formulación en productos de panadería. Arch Latinoam Nutr. 2003; 53(4):1-14. [ Links ]
33. López–Jiménez F, Cortés–Bergoderi M. Obesidad y corazón. Rev Esp Cardiol. 2011; 64(2):140-149. [ Links ]
34. Valdés S, García-Torres F, Maldonado-Araque C, Goday A, Calle-Pascual A, Soriguer et al. Prevalencia de obesidad, diabetes mellitus y otros factores de riesgo cardiovascular en Andalucía. Comparación con datos de prevalencia nacionales. Rev Esp Cardiol. 2014; 67(6):442-448.
35. Frost G, Sleeth ML, Sahuri-Arisoylu M, Lizarbe B, Cerdan S, Brody L, et al. The short-chain fatty acid acetate reduces appetite via a central homeostatic mechanism. Nat commun. 2014; 5:1-11. [ Links ]
]]>36. Flegal KM, Carroll MD, Kit BK, Ogden CL. Prevalence of obesity and trends in the distribution of body mass index among US adults, 1999-2010. JAMA. 2012; 307(5): 491-497. [ Links ]
37. Barczynska R, Bandurska K, Slizewska K, Litwin M, Szalecki M, Libudzisz z, et al. Intestinal microbiota, obesity and prebiotec. Pol J Microbiol. 2015; 64(2):93100. [ Links ]
38. Devaux M, Sassi F. Social inequalities in obesity and overweight in 11 OECD countries. Eur J Public Health. 2011; 23(3): 464-469. [ Links ]
39. Sánchez FJ. 2016. La obesidad un grave problema de salud pública. En: III Curso avanzado sobre obesidad. (Eds). Real Academia Nacional de Farmacia: España, pp. 11-41.
40. Slavin J, Green H. Dietary fibre and satiety. Nutr Bull. 2007; 32(suppl 1):32-42. [ Links ]
41. Slavin J. Fiber and prebiotics: Mechanisms and health benefits. Nutrients. 2013; 5:1417-1435. [ Links ]
42. Devaraj S, Hemarajata P, Versalovic J. La microbiota intestinal humana y el metabolismo corporal: implicaciones con la obesidad y la diabetes. Acta Bioquim Clín Latinoam. 2013; 47(2):421-434. [ Links ]
43. Druart C, Alligier M, Salazar N, Neyrinck AM, Delzenne N. Modulation of the gut microbiota by nutrients with prebiotic and probiotic properties. Adv Nutr. 2014; 5(5):624S-633S. [ Links ]
44. Adam CL, Gratz SW, Peinado DI, Thomson LM, Garden KE, Williams PA, et al. Effects of dietary fibre (Pectin) and/or increased protein (Casein or Pea) on satiety, body weight, adiposity and ceacal fermentation in high fat diet-induced obese rats. PloS one. 2016; 11(5):e0155871. [ Links ]
45. Brum JM, Gibb RD, Peters JC, Mattes RD. satiety effects of psyllium in healthy volunteers. Appetite. 2016; 105:27-36. [ Links ]
46. Kim EK, Oh TJ, Kim LK, Cho YM. Improving effect of the acute administration of dietary fiber-enriched cereals on blood glucose levels and gut hormone secretion. J Korean Med Sci. 2016; 31(29):222-230. [ Links ]
47. Bae IY, Jun Y, Lee S, Lee HG. Characterization of apple dietary fibers influencing the in vitro starch digestibility of wheat flour gel. LWT-Food Sci Technol. 2016; 65:158-163. [ Links ]
48. Kapoor MP, Ishihara N, Okubo T. Soluble fibre partially hydrolysed guar gum markedly impacts on postprandial hyperglycaemia, hyperlipidaemia and incretins metabolic hormones over time in healthy and glucose intolerant subjects. J Funct Foods. 2016; 24:207-220. [ Links ]
49. Huxley RR, Woodward M, Clifton P. The epidemiologic evidence and potential biological mechanism for a protective effect of dietary fiber on the risk of colorectal cancer. Curr Nutr Rep. 2013; 2(1):63-70. [ Links ]
50. Kendall CW, Esfahani A, Jenkis DJ. The link between dietary and human health. Food Hydrocoll. 2010; 24(1):42-48. [ Links ]
51. Murphy N, Norat T, Ferrari P, Jenab M, Bueno de Mesquita B, Skeie G, et al. Dietary Fibre intake and risks of cancers of the colon and rectum in the European prospective investigation into cancer and nutrition. PloS one. 2012; 7(6):e39361. [ Links ]
52. Fuchs CS, Giovannucci EL, Colditz GA, Hunter DJ, Stampfer MJ, Rosner B et al. Dietary fiber and the risk of colorectal cancer and adenoma in woman. N Engl J Med. 1999; 340(3):169-176. [ Links ]
53. Bernstein AM, Titgemeier B, Kirkpatrick K, Golubic M, Roizen MF. Major cereal grain fibers and psyllium in relation to cardiovascular health. Nutrients. 2013; 5(5):1471-1487. [ Links ]
54. Kranz S, Brauchla M, Slavin JL & Miller KB. What do we know about dietary fiber intake in children and health? The effects of fiber intake on constipation, obesity, and diabetes in children. Adv Nutr. 2012; 3(1), 47-53. [ Links ]
55. Anderson J, Baird P, Davis RH, Ferreri S, Knudtson M, Koraym A, et al. Health benefits of dietary fiber. Nutr Rev. 2009; 64(4):188-205. [ Links ]
56. Ueberall MA, Muller-Lissner S, Buschmann-Kramm C, Bosse B. The bowel function index for evaluating constipation in pain patients: definition of a reference range for a non-constipated population of pain patients. J Int Med Res. 2011; 39(1):41-50. [ Links ]
57. Robin F, Schuchmann HP, Palzer S. Dietary fiber in extruded cereals: limitations and opportunities. Trends Food Sci Tech. 2012; 28(1):23-32. [ Links ]
58. Tungland BC, Meyer D. Nondigestible oligo-and polysaccharides (dietary fiber): their physiology and role in human health and food. Compr Rev Food Sci Food Saf. 2002; 1(3):90-109. [ Links ]
59. Yaich H, Garna H, Besbes H, Paquot M, Blecker C, Attia H. Chemical composition and functional properties of Ulva lactuca seawed collected in Tunisia. Food Chemistry. 2011; 128(4):895-901. [ Links ]
60. De Moraes CT, Jablonski A, De Oliveira A, Rech R, Flores SH. Dietary fiber from orange byproducts as a potential fat replacer. LWT-Food Sci Tech. 2013; 53(1):9-14. [ Links ]
61. Dahl WJ, Stewart ML. Position of the Academy of Nutrition and Dietetics: health implications of dietary fiber. J Acad Nutr Diet. 2015; 115(11):1861-1870. [ Links ]
^rND^sMiller^nJ^rND^sElleuch^nM^rND^sBedigian^nD^rND^sRoiseux^nO^rND^sBesbes^nS^rND^sBlecker^nC^rND^sAttia^nH^rND^sHipsley^nHB^rND^sBurkitt^nDP^rND^sWalker^nARP^rND^sPainter^nNS^rND^sDhingra^nD^rND^sMichael^nM^rND^sRajput^nH^rND^sPatil^nRT^rND^sDeVriers^nJW^rND^sCherbut^nC^rND^sEscudero^nE^rND^sGonzález^nP^rND^sLattimer^nJM^rND^sHaud^nMD^rND^sWestenbrink^nS^rND^sBrunt^nK^rND^sVanDerKamp^nJW^rND^sDe^nMenezes EW^rND^sGiuntini^nEB^rND^sDan^nMCT^rND^sSardá^nFAH^rND^sLajolo^nFM^rND^sMcCleary^nBV^rND^sDe^nVries JW^rND^sRader^nJI^rND^sCohen^nG^rND^sProsky^nL^rND^sMugford^nDC^rND^sChamp^nM^rND^sOkuma^nK^rND^sFuller^nS^rND^sBeck^nE^rND^sSalman^nH^rND^sTapsell^nL^rND^sPapathanasopoulos^nA^rND^sCamilleri^nM^rND^sEswaran^nS^rND^sMuir^nJ^rND^sChey^nWD^rND^sShoaib^nM^rND^sShehzad^nA^rND^sOmar^nM^rND^sRakha^nA^rND^sRaza^nH^rND^sSharif^nHR^rND^sChawla^nR^rND^sPatil^nGR^rND^sSlavin^nJ^rND^sMertens^nDR^rND^sSouthgate^nDAT^rND^sHudson^nGJ^rND^sEnglyst^nH^rND^sProsky^nL^rND^sMudgil^nD^rND^sBarak^nS^rND^sIsken^nF^rND^sSusanne^nK^rND^sOsterhoff^nM^rND^sPfeiffer^nA^rND^sWeickert^nM^rND^sLopez-Legarrea^nP^rND^sFuller^nNR^rND^szulet^nMA^rND^sMartinez^nJA^rND^sCaterson^nID^rND^sRomo-Vaquero^nM^rND^sSelma^nMV^rND^sLarrosa^nM^rND^sObiol^nM^rND^sGarcia-Villalba^nR^rND^sGonzález^nL^rND^sLayden^nBT^rND^sAngueira^nAR^rND^sBrodsky^nM^rND^sDurai^nV^rND^sLowe^nWL^rND^sMa^nMM^rND^sMu^nTH^rND^sLopez^nJH^rND^sFernandez^nJ^rND^sPérez^nJA^rND^sViuda^nM^rND^sYaich^nH^rND^sGarna^nH^rND^sBchir^nB^rND^sBesbes^nS^rND^sPaquot^nM^rND^sRichel^nA^rND^sAlarcón^nMA^rND^sLópez^nJH^rND^sRestrepo^nDA^rND^sVillarroel^nM^rND^sAcevedo^nC^rND^sYañez^nE^rND^sBiolley^nE^rND^sLópez-Jiménez^nF^rND^sCortés-Bergoderi^nM^rND^sValdés^nS^rND^sGarcía-Torres^nF^rND^sMaldonado-Araque^nC^rND^sGoday^nA^rND^sCalle-Pascual^nA^rND^sSoriguer^nx^rND^sFrost^nG^rND^sSleeth^nML^rND^sSahuri-Arisoylu^nM^rND^sLizarbe^nB^rND^sCerdan^nS^rND^sBrody^nL^rND^sFlegal^nKM^rND^sCarroll^nMD^rND^sKit^nBK^rND^sOgden^nCL^rND^sBarczynska^nR^rND^sBandurska^nK^rND^sSlizewska^nK^rND^sLitwin^nM^rND^sSzalecki^nM^rND^sLibudzisz^nz^rND^set^nal^rND^sDevaux^nM^rND^sSassi^nF^rND^sSánchez^nFJ^rND^sSlavin^nJ^rND^sGreen^nH^rND^sSlavin^nJ^rND^sDevaraj^nS^rND^sHemarajata^nP^rND^sVersalovic^nJ^rND^sDruart^nC^rND^sAlligier^nM^rND^sSalazar^nN^rND^sNeyrinck^nAM^rND^sDelzenne^nN^rND^sAdam^nCL^rND^sGratz^nSW^rND^sPeinado^nDI^rND^sThomson^nLM^rND^sGarden^nKE^rND^sWilliams^nPA^rND^set^nal^rND^sBrum^nJM^rND^sGibb^nRD^rND^sPeters^nJC^rND^sMattes^nRD^rND^sKim^nEK^rND^sOh^nTJ^rND^sKim^nLK^rND^sCho^nYM^rND^sBae^nIY^rND^sJun^nY^rND^sLee^nS^rND^sLee^nHG^rND^sKapoor^nMP^rND^sIshihara^nN^rND^sOkubo^nT^rND^sHuxley^nRR^rND^sWoodward^nM^rND^sClifton^nP^rND^sKendall^nCW^rND^sEsfahani^nA^rND^sJenkis^nDJ^rND^sMurphy^nN^rND^sNorat^nT^rND^sFerrari^nP^rND^sJenab^nM^rND^sBuenodeMesquita^nB^rND^sSkeie^nG^rND^sFuchs^nCS^rND^sGiovannucci^nEL^rND^sColditz^nGA^rND^sHunter^nDJ^rND^sStampfer^nMJ^rND^sRosner^nB^rND^set^nal^rND^sBernstein^nAM^rND^sTitgemeier^nB^rND^sKirkpatrick^nK^rND^sGolubic^nM^rND^sRoizen^nMF^rND^sKranz^nS^rND^sBrauchla^nM^rND^sSlavin^nJL^rND^sMiller^nKB^rND^sAnderson^nJ^rND^sBaird^nP^rND^sDavis^nRH^rND^sFerreri^nS^rND^sKnudtson^nM^rND^sKoraym^nA^rND^set^nal^rND^sUeberall^nMA^rND^sMuller-Lissner^nS^rND^sBuschmann-Kramm^nC^rND^sBosse^nB^rND^sRobin^nF^rND^sSchuchmann^nHP^rND^sPalzer^nS^rND^sTungland^nBC^rND^sMeyer^nD^rND^sYaich^nH^rND^sGarna^nH^rND^sBesbes^nH^rND^sPaquot^nM^rND^sBlecker^nC^rND^sAttia^nH^rND^sDeMoraes^nCT^rND^sJablonski^nA^rND^sDeOliveira^nA^rND^sRech^nR^rND^sFlores^nSH^rND^sDahl^nWJ^rND^sStewart^nML^rND^nDario^sGregori^rND^nGiulia^sLorenzoni^rND^nClaudia^sGafare^rND^nDario^sGregori^rND^nGiulia^sLorenzoni^rND^nClaudia^sGafare^rND^nDario^sGregori^rND^nGiulia^sLorenzoni^rND^nClaudia^sGafareWe are glad to present such special issue of the Archivos Latinoamericanos de Nutrición, developed in the context of the Executive Programmes of Scientific and Technological Cooperation between Italy-Argentina (2011-2013,extended until 2017) and Italy-Mexico (2011-2013), under joint support of the Italian Ministry of Foreign Affairs, the MINCYT (Ministerio de Ciencia, Tecnología e Innovación Productiva, Argentina) and the CONACYT (Consejo Nacional de Ciencia y Tecnología, Mexico). Such bilateral research projects, focused on nutrition-related diseases’ surveillance and prevention, were led by Prof. Dario Gregori (Univer-sity of Padova, Italy) and Prof. Hugo Rodriguez (Garrahan Hospial, Buenos Aires, Argentina) (Italy-Argentina Cooperation), and by Prof.Francesco Giunta (University of Pisa, Italy) and Prof. Javier Dibildox (University San Luis Potosí, San Luis Potosí, Mexico) (Italy-Mexico Cooperation). These projects were aimed at analyzing epidemiological and preventive aspects of a multi-factorial phenomenon that represents a severe burden from the public health perspective: the relationship between nutrition and non-communicable diseases (referring particularly to obesity).
Obesity is well-known to be a concerning epidemic worldwide, both in developed and newly industrialized countries (NIC), and several efforts have been made to understand heterogeneous factors affecting its onset. In recent years, several researches have focused on the contribution of nontraditional factors to obesity. However,no definitive evidence is available in this field, in particular when moving apart from the North-American or Western-European experiences.
This special issue is aimed at serving as a collector for research experiences coming from outside of those regions. Investigations include researches on the role of both traditional (eating habits) and nontraditional factors (concentrating particularly on brand awareness, exposure to TV advertising, marketing of gadgets with toys) in affecting the adoption of unhealthy lifestyles, resulting in increased non-communicable diseases’ risk in subjects from both developed and emerging economies. Together with the analysis of such predictors, which is essential to develop ad hoc public health interventions fighting obesity and other nutrition-related diseases, the impact of these public health policies, promoting healthy nutrition, has been investigated, analyzing if children’s eating habits are compliant with current nutritional recommendations. Besides preventive aspects (and their efficacy), pure epidemiological investigations have been conducted,e.g.: analyzing the role of simple anthropometric measures in predicting body composition in children of different ethnicities. Finally, addictive behaviors connected to nutrition have been investigated, focusing on predictors of alcoholism in childhood.
]]> As clearly seen from above, papers included in this special issue report from an intense bilateral cooperation between Italy and Latin America in an emerging field like nutrition and noncommunicable diseases. In our view, this should contribute on promoting the development and the dissemination of researches in regions only partially covered by the general literature.
Alexander Hochdorn, Giulia Lorenzoni, Nicola Soriani, Luca Rosati, Adriana de Hoyos, Javier Dibildox, Claudia Elena Gafare, Ignacio Amador, Jose Luis Mayorga, Dario Gregori.
Unit of Biostatistics, Epidemiology and Public Health, Department of Cardiac, Thoracic and Vascular Sciences, University of Padova, Italy. Prochild ONLUS Trieste, Italy. University of Monterrey, Mexico.
University San Luis Potosí, San Luis Potosí, Mexico. Department of Nutrition, University of Buenos Aires and Food and Diet Therapy Service, Acute General Hospital Juan A. Fernàndez, Buenos Aires, Argentina. Cuarto Centenario, San Luis Potosí, Mexico.
]]> SUMMARY: This study aims at assessing children’s awareness towards branded food products in central Mexico. One-hundred and twenty children, aged 3-10
years and balanced by gender, were recruited in San Luis Potosí. Kids’ heights and weights were measured in order to calculate their BMI. A cross-sectional questionnaire was administered to children’s parents in order to gain socio-demographic information. Children’s brand awareness was assessed using the IBAI (International Brand Awareness Inventory). Basic exploratory analyses were performed for samples’ general characteristics, and ANOVA was adopted for investigating differences between the IBAI tasks. Results demonstrated that 50% of kids correctly associated the logo to the respective brand in more than 70% of the cases. About half of the sample recalled the right name of the food type in 50% of the cases. 50% of kids recognized the brand name in less than 20% of cases. Older children (7-10 y) showed a higher brand awareness when compared to younger ones (3-6 y). Children demonstrated a consistent knowledge of famous fast-food and snack products. Prevention through informative campaigns should make parents more aware of the TV contents, their kids are exposed to.
Key words: Brand awareness, children, weight gain, Mexico.
RESUMEN. ¿Las marcas de los alimentos promueven la obesidad? Una investigación sobre los niños en San Luis Potosí. Este estudio tiene como objetivo evaluar la conciencia de los niños hacia los productos alimenticios de marca en México. Ciento veinte niños, de entre 3-10 años en grupos equitativos por sexos, fueron reclutados en San Luis Potosí. Se midieron la talla y los pesos de los niños con el fin de calcular sus IMC. A los padres de los niños se les entrego un cuestionario transversal a fines de obtener información socio-demográfica. El conocimiento de la marca de los niños se evaluó, mediante el uso del IBAI (Inventario Internacional de conocimiento de la marca). Se realizó un análisis exploratorio de base para obtener las características generales de la muestra y se adoptó un anova para investigar las diferencias entre las tareas IBAI. Los resultados demostraron que el 50% de los niños había asociado correctamente el logotipo de la marca respectiva en más del 70% de los casos. Aproximadamente la mitad de la muestra recordaba el nombre correcto de marca de alimentos en el 50% de los casos. 50% de los niños reconocía el nombre de la marca en menos del 20% de los casos. Los niños mayores (7-10 años) mostraron una conciencia de marca más alta si se compara con los más jóvenes (3-6 años). Los niños demostraron consistentemente tener conocimiento de los productos de comida rápida y bocadillos más conocidos. La prevención a través de campañas informativas debería conscientizar a los padres sobre los contenidos de televisión a los que que
sus hijos están expuestos.
Palabras clave: Conocimiento de la marca, niños, aumento de peso, México.
]]> INTRODUCTION
The growing epidemic of childhood overweight and obesity is a major public health concern. Multiple factors influence eating attitudes and food choices of children, like advertising (1, 2), branding (3), peers judgments (4, 5) and social context (6). Such factors need to be evaluated when considering behavioral influences, in order to assess proper public intervention to reduce the international increase in childhood nutrition related diseases.
Genes and environment interact influencing phenotypes for intake and expenditure (7), thus indicating the need to provide information about behavioral aspects influencing obesity’s rise (8). Although genetic factors play a fundamental role in obesity development (9), the rapid increase seen within the last 50 years cannot be attributable exclusively to etiologic causes (8). The “toxic environment” has been recognized as one of the leading risk factors in childhood obesity (6), a representing a scenario where kids are highly stimulated by food-related media messages and encouraged to consume high-fat, high-sugar foods (10, 11).
Food preferences appear just at an early age and are developed all along people’s lifetime, becoming important determinants of food intake first in children, then in adolescents, and finally in adults (12). Many factors, as availability, accessibility, familiarity and parental modeling, influence the process (13). Children, who exceed daily energy intake levels and present scarce frequency of regular physical activity, are considered being at a higher risk of increasing their body mass (7, 14). By means of an experimental assessment it would be possible to access the behavioral and motivational patterns, promoting compulsive consumption of highly energy-dense foods, which are commercialized on tv broadcasts and other advertisement sources (15, 16).
When considering emotions and choices behind food consumption, brand awareness and frequency of exposure to advertising have traditionally been indicated as conditioning children’s tastes, diverting their preferences towards highly energetic food (1, 17). It has been estimated, indeed, that children are exposed to 10000 advertisements for food per year, 95% of which are for fast foods, candy, sugared cereal and soft drinks (11). From a recent study developed in toddlers, daily caloric requirement exceeded in energy intake from 10 to 30%, mostly due to energy-dense food consumption (18).
]]> Although present trends show an increasing pressure on food industry’s advertising campaigns to divert children’s preferences towards less processed food, the association between brand awareness, advertising and obesity has not yet been proved (19, 20). Moreover, little focus has been directed towards the relationship between children’s food intake and energy expenditure (21). The aim of this research was to develop an instrument to assess Mexican chidren brand
awareness (the IBAI (International Brand Awareness Instrument)), based on a former research conducted by Forman et al. (3).
MATERIAL AND METhODS
Sample
Research population consisted of 120 children, recruited in San Luis Potosí, the sample of children was equally divided in females and males, and then split into two age groups (3-6, 7-10). The choice to divide the sample into two age-specific clusters emerged from findings of former studies carried out on this specific topic (22- 24). Results of these studies underlined, indeed, that the recalling and recognition performance of children differed according to their age.
Study Design ]]>
A selection of 12 different brand marks was performed for the mexican specific IBAI version. consistently to what was defined by Forman et al. (3), the IBAI has been adapted to the country-specific context of the present research with special attention reserved to the choice of several food brands, included for this study. Three alimentary lines were proposed as stimuli: sweet foods, savory ones, and carbonated beverages. The choice of these aliments emerged from a constant confrontation among all stakeholders involved within the project (experts in public health, psychologists, educators as well as nutritionists). In order to
propose a valid instrument for the context, two basic criteria had to be granted when choosing the single brands: 1.) all products must be available in most Mexican stores and markets on a local as well as on a national level; 2.) all of these trademarks must refer to foods usually consumed by children taking part in this research.
Independent variable
The stimuli consisted of 12 flashcards, containing just a part of a brand mark (e.g. the typical “M” in Mc Donald). In addition, sets of 12 four-image charts were correlated to each flash card. The images in the charts represent different alimentary alternatives (see table 1 for details). Out of these, only one corresponds to the brand partially shown in the flashcards. Figure 1 shows an example of a flashcard along with its multiple-choice image chart.
Procedure
]]> Children were recruited after lunch in a quiet room inside the school they attend. The same meal was administered to all the kids and they followed the same physical activity patterns.
Afterwards, children were allocated individually in a classroom, and asked to sit on a chair next to a table, where the material was exposed. The kid was set in front of the researcher in order to interact with him and the observation tools (the 12 image charts). Once the researcher explained the procedure to the child, he showed her/him each single card representing a food brand, then the selection of 4 pictures containing alimentary products.
First the child was asked to name the specific logo shown on each single card and afterwards she/he was invited to link it to one of the 4 images of aliments. The researcher then assigned 1 point if the child correctly named the product, 1 point if it has been matched to the respective food category and finally 1 point if the kid recognized the specific name of the product (e.g. “Mc Donald” is the brand, the correct image is a double roll containing two hamburgers with cheese, the products name is “Big Mac”).
Brand Awareness Scores (IBAI-score) could range from a minimum of 0 to a maximum of 36, with a cut-off set at 16 points, defining two groups: low-brand awareness children (<16) and high brand awareness ones (> 16) [15].

FIGURE 1. Example of flash cards used for the IBAI. The logo of Coca-Cola (co) has been associated to milk, orange juice, chocolate and a carbonated beverage (correct match: image A)

Children who were diagnosed with cognitive disorders, metabolic diseases or allergies were excluded. Parent’s informed consent was obtained for all children prior to each child’s participation in the study, and they were explained the precise aims of the study and was guaranteed anonymity. Treatment of all data was performed in compliance with the guidelines and ethics standards issued by The American Psychological Association (25).Appropriate permission was obtained from the Institutional Review Boards.
Cross-sectional questionnaire ]]>
A questionnaire was administered either to children than to their parents. The questionnaire was structured into four parts. The first one aimed to assess socio-demographic characteristics of the whole family, asking about parental education, family members’ BMI and composition of the household. A second section, in turn, looked into the general health-status of the family, especially eating habits, nursing, chronic diseases, etc. The following section assessed their eating habits in terms of both, quality and quantity of energy intake. The last part considered daily intensity and weekly frequency of physical activity performed by the children.
Anthropometrics
Children were weighed and measured in light clothing and without shoes on a balance scale and with a body meter measuring tape with wall stop. Weights and heights were utilized to calculate BMI. Children were considered to be overweight/obese with a BMI ≥85th and underweight with a BMI <5th, according to CDC growth standards (26, 27).
Statistical analysis
Basic exploratory data analysis was performed on the sample and was reported using median (I-III quartile) for continuous variables and percentages (absolute numbers) for categorical variables, whenever appropriate. Throughout a linear regression model the effect of age and gender on the total IBAI score was assessed. In order to analyze differences with regard to the three tasks of the IBAI (brand recognition, brand-product association, product recall), anova was adopted for repeated measures. Distributions of correct recognition, recall and matching emerged from the IBAI test are shown through boxplots (Figure 2). ]]> Analyses were performed using the R-software.
RESULTS
Children’s IBAI scores arising from exact recognition of the brand mark, positive association between the logo and the respective product, as well as correct recall of the specific aliment are shown in Table 2.
Figure 2, instead, shows the different distribution of the single IBAI tasks, where overall 50% of the kids associated correctly the logo to the respective brand in more than 70% of the cases. Around half of the sample recalled the right name of the food type in 50% of the cases. 50% of kids recognized the brand name in less than 20% of cases. This comparison among the single boxplots, representing the main outcomes of the study with the twelve flashcards, shows that the brand-product association task, the brand recognition task and the product recall task show different levels of performance as demonstrated in Figure 2.
With regard to age, results showed that older children (7-10 y) performed better in the recognition task, instead in the recalling and association tasks, when compared to the younger ones (3-6 y). No significant gender related association could be revealed.
]]> DISCUSSION
In the rapid spread of nutrition related pathologies among children, age-specific advertising has been targeted as positively increasing the phenomenon. A systematic review of all the evidence made available by the Food Standards Agency (FSA) in 2003 (28), and a report by the Office of Communications (Ofcom) in 2004 (29) underlined the urgent need to expand knowledge about the influence of food commercials on children’s eating habits. Both researches concluded that there is a link between the exposure to advertisement and obesity. In a further study, Ashton (30), underlined, instead, that both studies showed evident contradictions.
In the first review, a statistically significant relation between a child’s exposure to advertising and a rise of energy intake was found. However, whilst exposure to food commercials did reduce children’s nutrient efficiency, it accounted for only 2% of the variance and had no direct effect on caloric intake, while parental behavior’s influence was fifteen times greater (31). As indicated by Kopelman (32), indeed, both reports appeared to have major limitations, being strongly dominated by studies in North American setting and concentrating only on television advertising, ignoring all other inputs that might influence children’s awareness. Kopelman’s study, held on children from 9 to 11 years, did not demonstrate a close relationship between brand awareness and the children’s reported eating behaviors, food knowledge and preferences, although the English sample showed a high brand logo recognition.
Buijzen et al. stated in a study published in 2008 (33) that television food advertising contributes to an unhealthy diet, influencing not only children’s awareness towards brand-marks, but promoting even more a general rise in consuming energy-dense foods. Conclusions, however, were derived from correlational data, which do not isolate any specific causes. The same limitation regards also the linkage between branding and obesity.
Brand awareness is defined as the active and passive knowledge of a particular brand. Research on the brand awareness of young children has focused on two aspects of brand awareness: brand recognition and brand recall. The IBAI questionnaire, adapted to the Mexican context, considered both these aspects, by researching not only children’s knowledge of brand recognition, but also of specific product naming.
]]> Former studies, examining toddlers’ and preschoolers’ brand recognition (34, 35) and brand recall (36), showed that children’s ability to recognize brands starts earlier in development than their ability to recall these brands, showing in preschoolers an excellent recognition memory, whereas their recall memory performance is considerably weaker. Moreover, older children have more content knowledge than younger children about almost everything. In general, new information is best learned and remembered when it can be related to existing knowledge in memory, a capacity that is more distinct in older children (37). In brand awareness building, along with normal developmental patterns, environmental factors result crucial determinants.
Brands are recognized by children in early life, but their effect on obesity development has not yet been clarified. By 2 years of age, brand awareness can be detected in children (38), progressively increasing selective attention and association abilities with certain products (39, 40), particularly if brands use salient features such as bright colors, pictures, and cartoon characters (34). Just in pre-school period, preferences towards specific foods start to arise, inducing a behavior defined as “consumption by influence” (41). Marketing strategies, therefore, take into account these phenomena (41), in order to encourage children to recognize and differentiate particular products and logos; for example advertisers place cereal boxes at children’s eye level, because they know that toddlers can recognize brands of cereals, attracting their attention while there are seating in the grocery cart (6).

FIGURE 2. Percentage of correct responses for the 3 IBAI tasks.
 ]]>
]]>
Previous experimental studies have shown a brand effect on children’s preferences. Robinson et al. (42) examined the effects of cumulative marketing and brand exposure on young children, by testing the influence of branding on taste preferences. Results showed that branding of foods and beverages influenced young children’s taste perceptions, with a significant greater effect in those more highly exposed to TV. Roberto (43) explored the use of licensed characters as taste promoters in children from 3 to 6 years.
Such results underlined a positive influence on taste and preferences towards so called junk food. A similar, recent work by Lapierre et al. (44) investigated whether food packaging with licensed media characters affected taste assessment of cereals, revealing consistently to Robinson and Roberto a positive effect of
subjective judgments. Unlike previous studies, focused on younger age groups, our research targeted children between 3 to 10 years old, in order to assess brand-awareness not only within specific groups, but also carrying out a comparison among them. Within our sample, age-related differences appeared.
O’ Cass’ and Clarke’s study (45) showed that main differences between age and gender are evident in types of brands recognized or recalled rather than in the number. In our study, indeed, the older group demonstrated a better performance while carrying out the brand recognition tasks. Despite age and gender, environmental factors like television advertising exposure, family characteristics, and peer influence determine young children’s brand awareness. Correlational studies on children’s brand recognition have demonstrated a significant relationship between television exposure and brand recognition (34, 46, 47). Some studies suggest that children from high income families show a better brand awareness, because they have greater exposure to the economic world than children of low socioeconomic status (37). Other studies, in contrast, have found that children belonging to low income families are better aware of brands, because they are exposed to the market-place earlier and more extensively than those grown in contexts with high socio-economic background (48).
STUDY LIMITATIONS
]]> The study incorporated data from 120 kids, all children belonged to the same Mexican regional context, namely San Luis Potosì, and results could therefore only be intended as context-specific. Further research should extend the sample to a more cross-regional survey in order to understand if cultural differences in a country, presenting important variances from the north (close to the United States) to the south, where influences of South-American societies exercise a stronger impact, would produce different levels of awareness towards brand marks.
Lifestyles and consumption habits are assumed to differ significantly, also due to the geopolitical pluralism of a central American country, which is going through a cultural transition. There was a second limitation, data could only be intended as an aproximate estimation of general trends across the overall population. Direct observation, also via ethnographic methodologies, could integrate the findings of this study with a perspective, naturally situated within real contexts.
CONClUSIONS
The study aims to assess, the awareness of 3-10 years old children towards brand marks of certain food products, usually commercialized in supermarkets and fast food franchising within a regional context of central Mexico. Results showed that children demonstrated a consistent knowledge about famous fast-food and snack products and that the awareness towards brands produces major effects in older children.
Prevention through informative campaigns, making the parents more aware of the TV contents, their kids are watching, would improve the choice of kid-specific programs, monitoring also the food advertisement they are usually exposed to.
]]> SOURCE OF fUNDING
The work has been partially supported by an unrestricted grant from the Italian Ministry of Foreign Affairs under the programs “Programmi di alta rilevanza scientifica e tecnologica” Italia-Messico and Italia-Argentina, and from ProChild ONLUS (Italy).
REFERENCES
1. Halford JC, Gillespie J, Brown V, Pontin EE, Dovey TM. Effect of television advertisements for foods on food consumption in children. Appetite. 2004;42(2):221-5. [ Links ]
2. Abbott RA, Lee AJ, Stubbs CO, Davies PS. Accuracy of weight status perception in contemporary Australian children and adolescents. Journal of paediatrics and child health. 2010;46(6):343-8. [ Links ]
]]>
3. Forman J, Halford JC, Summe H, MacDougall M, Keller KL. Food branding influences ad libitum intake differently in children depending on weight status. Results of a pilot study. Appetite. 2009;53(1):76-83. [ Links ]
4. Story M, Neumark-Sztainer D, French S. Individual and environmental influences on adolescent eating behaviors. J Am Diet Assoc. 2002;102(3 Suppl):S40-51. [ Links ]
5. Dishion TJ, Tipsord JM. Peer contagion in child and adolescent social and emotional development. Annu Rev Psychol. 2011;62:189-214. [ Links ]
6. Schwartz MB, Puhl R. Childhood obesity: a societal problem to solve. Obes Rev. 2003;4(1):57-71. [ Links ]
7. Butte NF, Cai G, Cole SA, Comuzzie AG. Viva la Familia Study: genetic and environmental contributions to childhood obesity and its comorbidities in the Hispanic population. Am J Clin Nutr. 2006;84(3):646-54; quiz 73-4. [ Links ]
]]>
8. Birch LL, Fisher JO. Development of eating behaviors among children and adolescents. Pediatrics. 1998;101(3 Pt 2):539-49. [ Links ]
9. Garn SM, Clark DC. Trends in fatness and the origins of obesity Ad Hoc Committee to Review the Ten-State Nutrition Survey. Pediatrics. 1976;57(4):443-56. [ Links ]
10. Byrd-Bredbenner C, Grasso D. Health, medicine, and food messages in television commercials during 1992 and 1998. J Sch Health. 2000;70(2):61-5. [ Links ]
11. Horgen KB, Choate M, Brownell KD. Television food advertising: Targeting children in a toxic environment. In: Singer DG, Singer JL, editors. andbook of children and the media. California: Sage; 2001. p. 447-61. [ Links ]
12. Drewnowski A. Sensory preferences for fat and sugar in adolescence and adult life. Ann N Y Acad Sci. 1989;561:243-50. [ Links ]
]]>
13. Gidding SS, Dennison BA, Birch LL, Daniels SR, Gillman MW, Lichtenstein AH, et al. Dietary recommendations for children and adolescents: a guide for practitioners. Pediatrics. 2006;117(2):544-59. [ Links ]
14. Hill JO, Wyatt HR, Melanson EL. Genetic and environmental contributions to obesity. Med Clin North Am. 2000;84(2):333-46. [ Links ]
15. Halford JC, Boyland EJ, Hughes G, Oliveira LP, Dovey TM. Beyond-brand effect of television (TV) food advertisements/commercials on caloric intake and food choice of 5-7-year-old children. Appetite. 2007;49(1):263-7. [ Links ]
16. Harris JL, Pomeranz JL, Lobstein T, Brownell KD. A crisis in the marketplace: how food marketing contributes to childhood obesity and what can be done. Annual review of public health. 2009;30:211-25. [ Links ]
17. Hunter BT. Marketing food to kids: Using fun to sell.Consumers’ Research. 2002;85(3):16-20.
]]> 18. Fox MK, Pac S, Devaney B, Jankowski L. Feeding infants and toddlers study: What foods are infants and toddlers eating? J Am Diet Assoc. 2004;104(1 Suppl
1):s22-30.
19. Gregori D, Ballali S, Gafare CE, Casella A, Stefanini G, de Sousa Alves R, et al. Investigating the obesogenic effects of marketing snacks with toys: an experimental study in Latin America. Nutrition journal. 2013;12(1):95. [ Links ]
20. Gregori D, Gulati A, Hochdorn A, Ballali S, Paramesh H, Kumar M, et al. Food packaged with toys: an investigation on potential obesogenic effects in Indian children. Indian J Pediatric. in press(Special Monographic Issue). [ Links ]
21. Birch L, Savage JS, Ventura A. Influences on the Development of Children’s Eating Behaviours: From Infancy to Adolescence. Can J Diet Pract Res. 2007;68(1):s1-s56.
22. Vecchio MG, Berchialla P, Didier N, Cayul O, Valdenegro D, Ghidina M, et al. The IBAI Instrument to Assess Brand Awareness Toward Food in Children: the Chile Adaptation. The Open Obesity Journal. 2013;5(Suppl 1):30-5. [ Links ]
23. Franchin L, Zobec F, Ghidina M, Stefanini G, Berchialla P, Gregori D. Measuring brand awareness as a component of eating habits in children: The development of the IBAI (International Brand Awareness Instrument) Italian version. Progress in Nutrition. 2012;14(2):132-40. [ Links ]
24. Vecchio MG, Ghidina M, Gulati A, Berchialla P, Paramesh EC, Gregori D. Measuring Brand Awareness as a Component of Eating Habits in Indian Children: The Development of the IBAI Questionnaire. Indian J Pediatric. in press. [ Links ]
25. APA. Ethical principles of psychologists and code of conduct Washington DC: American Psychological Association; 2002. Available from: http://www.apa.org/ethics/code/principles.pdf. [ Links ]
26. Kuczmarski RJ, Ogden CL, Grummer Strawn LM,Flegal KM, Guo SS, Wei R, et al. CDC growth charts:United States. Adv Data. 2000(314):1-27. [ Links ]
27. Kuczmarski RJ, Ogden CL, Guo SS, Grummer-Strawn LM, Flegal KM, Mei Z, et al. 2000 CDC Growth Charts for the United States: methods and development. Vital Health Stat 2002;11(246):1-190. [ Links ]
28. Review of research on the effects of food promotion to children [Internet]. 2003 [cited 05 May 2012]. Available from: http://www.food.gov.uk/multimedia/pdfs/foodpromotiontochildren1.pdf.
29. Ofcom. Childhood obesity—food advertising in context. In: Communications Oo, editor. London2004.
30. Ashton D. Food advertising and childhood obesity. J R Soc Med. 2004;97(2):51-2. [ Links ]
31. King R, Bickman L, Nurcombe B, Hides L, Reid W. The impact of poster advertising in buses on young people’s awareness and knowledge of a telephone counselling service. Health Promot J Austr. 2005;16(1):74-7.
32. Kopelman CA, Roberts LM, Adab P. Advertising of food to children: is brand logo recognition related to their food knowledge, eating behaviours and food preferences? J Public Health (Oxf). 2007;29(4):358-67. [ Links ]
33. Buijzen M, Schuurman J, Bomhof E. Associations between children’s television advertising exposure and their food consumption patterns: a household diary-survey study. Appetite. 2008;50(2-3):231-9.
34. Fischer PM, Schwartz MP, Richards JW, Jr., Goldstein AO, Rojas TH. Brand logo recognition by children aged 3 to 6 years. Mickey Mouse and Old Joe the Camel. JAMA. 1991;266(22):3145-8. [ Links ]
35. Mizerski R. The relationship between cartoon trade character recognition and attitude toward product category in young children. Journal of Marketing.1995;59:58-70. [ Links ]
36. Macklin MC. Do children understand TV ads? Journal of Advertising Research. 1983;23(1):63-70. [ Links ]
37. Valkenburg PM, Buijzen M. Identifying determinants of young children’s brand awareness:Television, parents, and peers. Applied Developmental Psychology. 2005;26:456-68. ]]>
38. Hite CF, Hite RE. Reliance on brand by young children. Journal of the Market Research Society. 1995;37(2):185-93. [ Links ]
39. Rust L. OBSERVATIONS: Parents and Children Shopping Together: A New Approach to the Qualitative Analysis of Observational Data. Journal of Advertising Research. 1993;33(4):65-70. [ Links ]
40. Vecchio MG, Ghidina M, Gulati A, Berchialla P, Paramesh EC, Gregori D. Measuring Brand Awareness as a Component of Eating Habits in Indian Children: The Development of the IBAI Questionnaire. Indian journal of pediatrics. 2014. [ Links ]
41. McNeal J. Kids as customers: a handbook of marketing to children. Lexington, MA: Lexington Books; 1992. [ Links ]
42. Robinson TN, Borzekowski DL, Matheson DM, Kraemer HC. Effects of fast food branding on young children’s taste preferences. Archives of pediatrics & adolescent medicine. 2007;161(8):792-7. ]]>
43. Roberto CA, Baik J, Harris JL, Brownell KD. Influence of licensed characters on children’s taste and snack preferences. Pediatrics. 2010;126(1):88-93.
44. Lapierre MA, Vaala SE, Linebarger DL. Influence of licensed spokescharacters and health cues on children’s ratings of cereal taste. Archives of pediatrics & adolescent medicine. 2011;165(3):229-34.
45. O’Cass A, Clarke P. Dear Santa, do you have my brand? A study of the brand request styles. Journal of Consumer Behaviour. 2001;2:37-53.
46. Derscheid LE, Kwon YH, Fang SR. Preschoolers’ socialization as consumers of clothing and recognition of symbolism. Perceptual and Motor Skills. 1996;82:1171–81.
47. Valkenburg PM, Cantor J. The development of a child into a consumer. Journal of Applied Developmental Psychology. 2001;22:61-72. [ Links ]
48. Gunter B, Furnham A. Children as consumers: A psychological analysis of the young people’s market. London: Routledge; 1998.
Dario Gregori, Alexander Hochdorn, Ricardo de Hoyos, Simonetta Ballali, Adriana de Hoyos, Claudia Elena Gafare, Giulia Lorenzoni, Javier Dibildox
Unit of Biostatistics, Epidemiology and Public Health, Department of Cardiac, Thoracic and Vascular Sciences,University of Padova, Italy. University of Monterrey, Mexico. Prochild ONLUS, Trieste, Italy. Department of Nutrition, University of Buenos Aires and Food and Diet Therapy Service, Acute General Hospital Juan A. Fernàndez, Buenos Aires, Argentina. University San Luis Potosí, San Luis Potosí, Mexico.
SUMMARY: Food advertising on TV is a common marketing practice, and it is suspected of promoting obesogenic behaviours. The study aimed at evaluating if gadgets (toys) packaged with food increase food consumption, and if contemporary exposure to TV and/or advertising is a further promoting factor. One-hundred and twenty children (balanced according to gender and age groups, 3-6 and 7-10 years old) were randomised in an experimental setting designed as a 2x5 full factorial ad libitum eating study. The first factor was represented by the exposure to gadgets, organized on two levels, “food with gadget” (TOY) and “food alone” (NoTOY). The second one consisted in the exposure to TV and advertising along five levels (no exposure to TV, exposure to TV without advertising, exposure to TV and 1, 2, or 3 advertsements). Our results showed no significant differences when considering the groups even after taking into account the dependent variables. The medium spot group showed the lowest energy intake, but the difference between the other groups was not significant. TV advertising and the presence of gadgets (toys) do not influence caloric intake in children.
Key words: TV exposure; advertising; toys as gadgets; obesogenic behaviour; experimental study.
]]> RESUMEN. La publicidad de alimentos en la televisión y la ingesta energética en los niños: resultados de la OBEY-AD México. La publicidad de alimentos en la televisión es una práctica común de comercialización, y se cree que puede promover comportamientos obesogénicos. El estudio tiene como objetivo evaluar si los gadgets (juguetes) empaquetados con alimentos aumentan el consumo de alimentos y si la exposición contemporánea a la televisión y / o la publicidad es un factor promotor adicional. Ciento veinte niños (agrupados por sexo y edad, 3-6 y 7-10 años de edad) fueron asignados al azar en una escuela de San Luis Potosí -México. Los niños fueron asignados al azar en el contexto experimental de un estudio de diseño factorial completo 2x5 de consumo de alimentos ad libitum. El primer factor estuvo representado por la exposición a juguetes y estuvo organizado en dos niveles: “alimento con juguetes” (TOY) y “alimento solo” (NoTOY). El segundo consistía en la exposición a la televisión y a publicidad televisiva a lo largo de cinco niveles (sin exposición a TV, exposición a TV sin publicidad, exposición a TV y a 1, 2 o 3 anuncios publicitarios). Nuestros resultados no mostraron diferencias significativas entre los grupos, incluso teniendo en cuenta las variables dependientes. Sólo en el grupo mediano al que se mostraron dos publicidades se observó el consumo de energía más bajo. La diferencia entre los otros grupos no fue significativa. La publicidad en televisión y la presencia de los pequeños juguetes no influyen en el consumo de calorías en los niños.
Palabras clave: Exposición a la televisión; publicidad; juguetes como dispositivo; comportamientos obesogénicos; estudio experimental.
INTRODUCTION
Obesity, which represents a clear and present risk for health-status of children and adolescents, has become an epidemic with an estimated 17.6 million overweight and obese children on a global scale (1, 2). Mexico has one of the highest obesity rates in Latin America (3) with prevalence of obesity among adolescents ranging from 9.0% among 10-year-olds boys to 6.1% among 15-year-olds, and from 5.9% among 12- year-old girls to 8.2% among 16-year-olds (4).
The rise of obesity already in early age, as a major risk factor underlying a high rate of non-communicable diseases (NCD), including diabetes mellitus (5), coronary heart disease (6), hypertension and some cancer-related diseases (7), needs to be treated throughout widespread policies for prevention and, in case of a disease in progress, with clinical support (8, 9). A recent WHO report on non-communicable diseases has pointed out that cardiovascular disorders and diabetes represent the most common NCD’s caused deaths with 17 million and 1.3 million victims annually, respectively (10). Such data highlights the urgent need to promote prevention policies, especially in the youngest ones.
Despite the fact that genetic factors play a significant role in the development of obesity (11), the increase of its prevalence in the past years strongly suggests that environmental factors are largely responsible (12). Variety of food supply available 24h/day (13), changes in dietary habits due to time constraints, like globalization processes (14, 15) and changes in physical activity due to technological advances create a ‘toxic’ environment responsible for obesity and eating disorders (16). A generally recognized cause of obesity is the excess of caloric intake in relation to energy expenditure (17, 18), although such an obesity driver could not be isolated as directly associable to weight-gain (19). Therefore the focus of attention has been turned to limit inappropriate (qualitative and quantitative) energy intake, above all where the context turns out to be an obesogenic promoter especially for children. TV viewing, advertising ]]> and snacking, indeed, have been recognized as co-causing factors (20-23). TV exposure often prompts physical inactivity (24), and increases at the same time a typical post-modern positioning towards consumption of dense and highly energetic snack food. Furthermore, several professionals in the public health system have concluded that constant exposure to messages encouraging consumption of snacks or fast food which is communicated to children through food advertising turns out to be the cause of inappropriate eating habits (25). Every day, children, while watching TV, are exposed on average to 15 spots advertising food products (Federal Trade Commission, 2007), and 98% of these marketing campaigns promote aliments high in fat, sugar and/or sodium (26).
Anyway, the results of different studies vary from showing positive association between TV viewing and increased levels of obesity during childhood (27, 28) to short and long-term effects of advertising on children’s eating habits. Such mechanisms contribute to the promotion of unhealthy diets (20, 29) often causing ongoing consumption of those food products which were advertised during childhood, later in their life as well (30). Although some associations have been found between exposure to visual commercial messages and caloric intake (31), no evidence could be revealed that a causal link between these two variables could exist (32). Such findings, indeed, are almost due to deductive associations rather than caused by a univocal relation.
An intersectional view, instead, frames this phenomenon within a circular interdependence between contextual (culture, society, geopolitical coordinates), biological (genetics and physiology), psychological (emotional and motivational) as well as behavioral factors (inactivity, parental attitudes and social based bias) (21, 33). From this perspective, “snacking” of highly energy-dense food, is seriously compromising the maintenance of “healthy and balanced dietary habits”.
Aim of this research, therefore, is to assess the influence of TV, advertising and gadgets on energy intake throughout an experimental model developed by Gregori et al. (1). This experimental assessment consists in an ad libitum eating study, involving children from 3 to 10 years in San Luis Potosi, Mexico.
MATERIALS AND METhODS
Study design
]]> The experiment was designed as a 2x5 full factorial ad libitum eating study. The first factor was represented by the exposure to gadgets, organized on two levels, “food with gadget” (TOY) and “food alone” (NoTOY). The second one consisted in the exposure to TV and advertising along five levels: “no exposure to TV” (NoFilmNoSpot), “exposure to TV without advertising” (FilmNoSpot), “exposure to TV and one advertising” (FilmLowSpot), “exposure to TV and two advertising” (FilmMediumSpot), “exposure to TV and three advertising” (FilmHighSpot).
The Film was a cartoon lasting about 22 minutes, chosen to be a non-spoken cartoon in order to propose a culture –free stimulus. Details about the choice of the tool and its role in the experiment are given elsewhere (1).
Sample size computation
Sample size was computed with reference to an alpha equal to 0.05 and a power of 0.90, aimed at detecting at least a difference of 20 Kcal of caloric intake (assuming an equal standard deviation in the two groups of about 10 Kcal) between the two experimental groups “food with gadget” and “food alone” in each of the 10 randomization cells. 120 Mexican children were indicated as needed to accomplish with such study targets, both males and females (50% respectively), ranging from 3 to 10 years of age.
Randomization and ethical conduction of the study
The single children were randomized according to each of the 10 cells of the full-factorial design, and randomization was performed through an ad-hoc computerized program, including the data collection and study conduction software system used for the research. Randomization was blocked by age (two groups of children 3-6 and 7-10 years old) and by gender (male and female) to ensure complete balance for the two potential confounding factors. Children having any kind of psychological or physical conditions, or presenting allergic reactions to the food items offered in the experimental session were not taken into consideration. Parents’ informed consent was obtained, and all experimental procedures were performed according to the guidelines and ethical standards established by the American Psychological Association (36). Appropriate permission was obtained from the Institutional Review Boards. ]]>
Study setting
Children were enrolled in a school setting in San Luis Potosí (Mexico). They were evaluated during a break after lunch inside a classroom, specifically set up for the study. All children within the school received the same meal and had a consistent pattern of programmed physical activity. Parents were invited to position
themselves at the lateral or back side of the classroom in order to fill out a questionnaire, without being seen by their children, who were engaged in the experimental session. Children were videotaped by two hidden digital cameras, strategically located to capture the front and side positions of the children. The researcher, instead,was located back-screen, to be readly available for children’s questions without influencing his behavior.
Parents’ questionnaire
The questionnaire given to children’s parents was divided in two sections. The first part was aimed at determining socio-demographic characteristics of the whole family, asking about parents’ education and familiars’ BMI, as well as a detailed set of queries on principal meals and basic physical activities performed within the family. Questions on child’s eating habits were introduced in the second part of the questionnaire, aimed at assessing TV viewing and physical activity of both, the children and their families.
]]> Anthropometrics
Children were weighed and measured in light clothing and without shoes on an electronic stand-up balance scale with a rigid metric belt. Measurements were taken by asking children to position themselves backwards on a wall, making sure the back of their feet touched the wall, thus a straight angle was formed between the wall and the floor. A straight surface was placed over the child´s head and a mark was drawn on the wall, representing the initial point. Weights and heights were used in order to calculate body mass index (BMI). Children were considered to be overweight/obese with a BMI ≥85th and underweight with a BMI <5th, according to CDC growth standards (37, 38)
Brand Awareness
Another questionnaire to assess children’s brand awareness, the IBAI inventory (39), was adopted for this study. The tool consisted of 12 images of both international and country-specific brand marks. The kids were asked to recognize the brand, to recall it, and to match it to an image to be chosen out of 4 different image options (see Figure 1). Finally, the researcher asked the child for the specific name of the product. Brand Awareness Scores (IBAI-score) could range from a minimum of 0 to a maximum of 36, with a cut-off set at 16 points, defining two groups: low-brand awareness children (<16) and high brand awareness ones (> 16) (39).

Study conduction
Children were first evaluated to assess BMI and basic characteristics. Afterwards, the IBAI questionnaire was administered to children by the interviewer. When the IBAI assessment was fully completed, the interviewer explained the progression of the study to the child. The snack offered for the study consisted in a sweet aliment composed by two shapes of chocolate containing a small gadget. The snack, which is a commonly commercialized product within Mexican stores and markets, has been selected for two reasons: (i) pointing out the eventual influence of the gadget, which has to be a toy easy to handle then combined to the snack, sold as one, single product, and (ii) the commercial version of the snack must permit a precise weighting of the content before the beginning of the experiment, in order to assess the starting points, and also after the session, offering in this way an accurate estimate of the amount of calories eaten by each kid. The part containing the chocolate was previously weighed and then offered alone to the children randomized to the NoTOY group, while it was given combined with the part containing the gadget to the TOY group. At the time of the first administration of the snack, if the child was assigned to a TV exposed group, the movie started without any interruption.
After the first snack-intake, the researcher could show the next one (having first waited for the child’s request). Each kid could eat ad libitum up to a maximum of 12 portions. Administration of the snack was performed adopting a pre-developed protocol, in order to control, as much as possible, the investigator’s influence on the children’s behavior.
Once the experimental session ended, the experimenter weighed the remaining chocolate of each product. All sessions were digitally recorded for subsequent examination and data quality assurance.
]]> Statistical analysis
Basic exploratory data analysis was performed on the sample and reported using median (I-III quartile) for continuous variables and percentages (absolute numbers) for categorical variables, whenever appropriate. Main analysis was based on a linear model where blocking factors, Gadget, FilmSpot and interaction between FilmSpot and Gadget were inserted in the model. This is the base model used in the analysis, where specific investigations on single factor-level effects were conducted using appropriate linear contrasts.
To further check for additional confounding factors, six models were developed. In each model, variables have been added to the base model:
1. Base: Nation+Age+Gender+Gadget+Film Spot+ToyFilmSpot
2. M1: BMI + Breast Feed + Hours/Week TV + Physical activity (hours/week)
3. M2: BMI Father + BMI Mother + number Brothers/Sisters
4. BA: IBAI-Score ]]> 5. M3: Number of rooms in the house + number of TV in the house + Educational level mother
6. M4: breakfast in the morning + fruit portions/day + vegetables portions/day
Each model was estimated and for the selected variables, the AIC criterion in the backward fashion was used for the selected variables. For each model, significance of the main experimental factors (Toy - FilmSpot and Toy - FilmSpot interaction) was assessed. Children were classified as “high consumers” if their energetic intake during the sessions exceeded the III quartile of the distribution.
Variables associated to the cluster of “high consumer” were modeled using a logistic regression and selected via the AIC criterion in a backward fashion. Analyses were performed using the R System (40).
RESULTS
Sample characteristics ]]>
Children enrolled in the study presented a median BMI of 16.40, while parents’ BMI showed a median of 24.65 for the mothers and 25.47 for the fathers. Children with no brothers and sisters represented respectively 57% and 68% of the sample. Parents stated that children had breakfast every day before school in 79% of cases, consuming a daily a portion of fruit (42%) and a portion of vegetables (41%).
When interviewed on TV watching, the median of total hours per week of TV exposure amounted to about 11 hours. The IBAI score showed a median value of 16.50 (Figure 1). All data are presented in Table 1.
TABLE 1. Description of the sample. Summaries for categorical variables are expressed as percentage (absolute numbers in parenthesis) and for continuous variables as median (I and III quartile).

Overall energy intake of children ]]>
The energy intake and glycemic load registered respectively a median value of 214.19 kcal and 11.67 g% Gl, which corresponds to a median of 2 snacks per kid.
Effect of gadget per se and combined with TV viewing and advertising Data on energy intake according to the specific study factors determined for each subgroup are presented in Table 2. No significant association between energy intake and gadget (Figure 2, left side) was found (p= 0.807). Conversely, a significant association was found according to movie and advertising exposure (Figure 2, right side) (p= 0.006).
The interdependence between Toys and TV was assessed, too. The highest score of caloric intake was revealed for the No TOY- Film High Spot group, meanwhile their interaction was not overall significant. The lowest value, instead, was recorded in the NoTOY- Film Medium Spot group (Figure 3, left side). The
influence of the gadget principally emerged within the No Film No Spot group, where no significant difference among the two clusters, however, could be revealed (Figure 3, right side).Once adjusted the confounding factors, when considering energy intake in the groups of children exposed to TV without gadget. All data are presented in Table 3.
High consumer
The third quartile of caloric intake showed an amount of 328.64 Kcal. Such measure constituted the cut-off points, in order to identify those children, presenting higher energy intake levels during the experimental session. In table 4 the main characteristics of such “high consumer” kids have been evidenced. In this cluster, made up of 34 children, a significant association was found in comparison with the TV exposure groups (p= 0.012) and after evaluation of IBAI scores (p= 0.008).
]]>


FIGURE 3. On the left side. Energy intake (kcal) trends related to TV and advertisement in a gadget TOY/no gadget NoTOY status. On the right side, energy intake related to gadget exposure in No Film Tv No Spot group.
]]>

TABLE 3. Significance of the Gadget, TV, advertising and their interaction after adjustment for several potential confounding factors. Cells are p-values related to the variables indicated in the columns. p is considered as significant when p <0.05.

TABLE 4. Characterization of the High Consumers according to the main study variables. Summaries for categorical variables are expressed as percentage (absolute numbers in parenthesis) and for continuous variables as median (I and III quartile).

The expansion of children’s obesity is linked to several factors, influencing their behaviour.Genetic predisposition, environment and social factors may play a fundamental role when studying both the prevention and the development of obesity. The obesogenic environment, constituted by cultural and social factors, is of paramount importance for the research, given the role it plays for children’s decision making. In the present ad libitum experiment the subjects’ self-regulated intake according to personal choices and behavior was investigated (41). This methodology, particularly indicated for nutritional studies assessing behavioral characteristics linked to increased caloric intake (42), aimed at analyzing spontaneous behavior within an experimental setting, considering a set of potential confounding factors (42). This research represents therefore the first ad libitum study on snacking and related factors (like gadget and snack advertisement) focused on the potential variation of the energy gap associated to consumption of snacks in different environmental settings. Self-regulation has already been advocated as an efficient and preventive treatment for childhood obesity (43, 44). Among various co-causing variables responsible for increased caloric intake, no association emerged when adding gadgets to the snack, namely the overall quantity of snacks eaten by the child in this ad libitum study.
Interaction with TV and advertising
In this study, the effects of TV watching and advertising on children’s consumption were investigated. The evaluation was carried out in order to compare children who were shown the short movie while eating, with those who were not selected to be shown any TV, so as to show different consumption behaviors within various experimentally reproduced situations.
Out of the results, both the presence and the absence of TV showed an increase of energy intake in children. This study, although located within an experimental setting, was intended to verify the maximum effect of a specific advertising spot promoting the snack eaten by the children. The main goal, therefore, consisted in establishing some kind of relation between the presence or the absence of commercial exposure.
Within the research, differences in terms of energy intake among the HighSpot group and the NoFilmNoSpot group turned out to be not significant, while the children randomized in the MediumSpot group ate markedly less. Investigating the interaction between the presence of the gadget, as well as TV watching and exposure to advertisements, no significant association emerged, and even in the case of the only subgroup not selected for TV viewing (NoFilmNoSpot) -which represented the control group-, levels of consumption in terms of calories could not be related to the gadget. ]]>
Study Limitations
Although all results were confirmed also after adjustment, which shows a strong consistency within the study, several limitations can be mentioned. First of all, these results refer to an experimental setting, which needs to be validated in natural situated contexts. Nonetheless, the choice of an experimental setting allowed us to eliminate the wide variety of biases that could distort the depend variables. Second, the children may have possibly been aware of the artificial context created for the study as well as of the researcher’s presence. All of these factors may have potentially distorted their behaviour. Still, for no a priori reason it could be supposed that such bias would have acted selectively on one group more than on the other. Thus, if a bias occurred, it would have most likely been spread on all groups equally. Third, there was no possibility for children to choose between different types of snack, given the a priori decision to use a single product which was adequate to the research goals and experimental procedures. Children enrolled in the study might have been limited by the lack of choice in the ad libitum snacking setting. Further research involving a broader choice of products will offer a more representative analysis on children’s consumption behavior.
CONClUSIONS
Even if in the Film Spot group several differences among the five subgroups were identified, findings showed that food advertising does not encourage children to eat more. At this proposal, for a full understanding of the association between energy intake and food advertising, different investigative procedures have been performed. Furthermore, the study revealed that the presence of a toy commercialized along with a snack, does not alter the amount of the item consumed by children in a Mexican context. However, from a perspective of public health, effective and preventive interventions should be promoted in order to improve health and nutritional status and they need to be culture-specific and implemented at all levels: from single individuals to society at large.
SOURCE Of FUNDING ]]>
The work has been partially supported by an unrestricted grant from the Italian Ministry of Foreign Affairs under the programs “Programmi di alta rilevanza scientifica e tecnologica” Italia-Messico and Italia-Argentina, and from Prochild ONLUS (Italy).
ACKNOWLEDGMENTS
The study group gratefully acknowledges Ferrero Inc. for having provided all the experimental food and toys free to the experimenters. All authors declare to not have any conflict of interest.
REFERENCES
1. Gregori D, Ballali S, Gafare CE, Casella A, Stefanini G, de Sousa Alves R, et al. Investigating the obesogenic effects of marketing snacks with toys: an experimental study in Latin America. Nutr J. 2013;12(1):95. Epub 2013/07/12. [ Links ]
]]>
2. Abbott RA, Lee AJ, Stubbs CO, Davies PS. Accuracy of weight status perception in contemporary Australian children and adolescents. J Paediatr Child Health. 2010;46(6):343-8. Epub 2010/04/24. [ Links ]
3. Brewis A. Biocultural aspects of obesity in young Mexican schoolchildren. Am J Hum Biol.2003;15(3):446–60.
4. Cartwright M, Wardle J, Steggles N. Stress and dietary practices in adolescents. Health Psychol.2003;22(4):362–9.
5. Joshi SR, Mohan V, Joshi SS, Mechanick JI, Marchetti A. Transcultural diabetes nutrition therapy algorithm: the Asian Indian application. Curr Diab Rep. 2012;12(2):204-12. Epub 2012/02/23. [ Links ]
6. Gupta R, Gupta KD. Coronary heart disease in low socioeconomic status subjects in India: “an evolving epidemic”. Indian Heart J. 2009;61(4):358-67. Epub2010/07/20.
]]>
7. Misra A, Singhal N, Sivakumar B, Bhagat N, Jaiswal A, Khurana L. Nutrition transition in India: secular trends in dietary intake and their relationship to diet-related non-communicable diseases. J Diabetes.2011;3(4):278-92. Epub 2011/06/09. [ Links ]
8. Haffner SM. Relationship of metabolic risk factors and development of cardiovascular disease and diabetes. Obesity (Silver Spring). 2006;14(3):121S-7S. [ Links ]
9. Bray GA, Macdiarmid J. The epidemic of obesity. West J Med. 2000;172(2):78-9. [ Links ]
10. WHO. Global status report on noncommunicable diseases 2010. 2011. [ Links ]
11. Loos RJ. Genetic determinants of common obesity and their value in prediction. Best practice & research Clinical endocrinology & metabolism. 2012;26(2):211-26. [ Links ]
]]>
12. Hill JO, Wyatt HR, Melanson EL. Genetic and environmental contributions to obesity. Med Clin North Am. 2000;84(2):333-46. Epub 2000/05/04. [ Links ]
13. Borradaile KE, Sherman S, Vander Veur SS, McCoy T, Sandoval B, Nachmani J, et al. Snacking in children: the role of urban corner stores. Pediatrics. 2009;124(5):1293-8. Epub 2009/10/14. [ Links ]
14. Wang Y, Zhang Q. Are American children and adolescents of low socioeconomic status at increased risk of obesity? Changes in the association between overweight and family income between 1971 and 2002. Am J Clin Nutr. 2006;84(4):707-16. Epub 2006/10/07. [ Links ]
15. Martorell R, Khan LK, Hughes ML, Grummer-Strawn LM. Obesity in Latin American women and children. J Nutr. 1998;128(9):1464-73. Epub 1998/09/10. [ Links ]
16. Huybrechts I, De Bourdeaudhuij I, De Henauw S, 2010;. Environmental factors: opportunities and barriers for physical activity, and healthy eating among children and adolescents. Verh K Acad Geneeskd Belg. 2010;72(5-6):277-93. [ Links ]
]]>
17. Kremers SP, Brug J, de Vries H, Engels RC. Parenting style and adolescent fruit consumption. Appetite. 2003;41:43-50. [ Links ]
18. Ambler T. Does the UK promotion of food and drink to children contribute to their obesity? International Journal of Advertising. 2006;25:137–56.
19. Bleich SN, Ku R, Wang YC. Relative contribution of energy intake and energy expenditure to childhood obesity: a review of the literature and directions for future research. Int J Obes (Lond). Epub 2010/12/02. [ Links ]
20. Halford JC, Gillespie J, Brown V, Pontin EE, Dovey TM. Effect of television advertisements for foods on food consumption in children. Appetite. 2004;42:221-5. [ Links ]
21. Buijzen M, Schuurman J, Bomhof E. Associations between children’s television advertising exposure and their food consumption patterns: a household diary-survey study. Appetite. 2008;50(2-3):231-9.Epub 2007/09/07.
]]>
22. Halford JC, Boyland EJ, Hughes GM, Stacey L, McKean S, Dovey TM. Beyond-brand effect of television food advertisements on food choice in children: the effects of weight status. Public Health Nutr. 2008;11(897-904). [ Links ]
23. Harris JL, Bargh JA, Brownell KD. Priming effects of television food advertising on eating behavior. Health Psychol. 2009;28: 404-13. [ Links ]
24. Vaz M, Bharathi AV, Kurpad AV. ‘Exercising’ but not active: implications for physical activity counselling. Natl Med J India. 2006;19(6):345.Epub 2007/03/09.
25. Brownell K.D. Fast food and obesity in children. Pediatrics. 2004;113(1 Pt 1):132. [ Links ]
26. Powell LM, Szczypka G, Chaloupka FJ, Braunschweig CL. Nutritional content of television food advertisements seen by children and adolescents in the United States. Pediatrics.2007;120(3):576-83. [ Links ]
]]>
27. Utter J, Scragg R, Schaaf D. Associations between television viewing and consumption of commonly advertised foods among New Zealand children and young adolescents. Public Health Nutr. 2006;9:606-12. [ Links ]
28. Wiecha JL, Peterson KE, Ludwig DS, Kim J, Sobol A, Gortmaker SL. When children eat what they watch: impact of television viewing on dietary intake in youth. Arch Pediatr Adolesc Med. 2006;160(4):436-42. Epub 2006/04/06. [ Links ]
29. Epstein LH, Roemmich JN, Robinson JL, Paluch RA, Winiewicz DD, Fuerch JH, et al. A randomized trial of the effects of reducing television viewing and computer use on body mass index in young children. Arch Pediatr Adolesc Med. 2008;162:239-45. [ Links ]
30. Barr-Anderson DJ, Larson NI, Nelson MC, Neumark-Sztainer D, Story M. Does television viewing predict dietary intake five years later in high school students and young adults? Int J Behav Nutr Phys Act. 2009;6:7. [ Links ]
31. Harris JL, Pomeranz JL, Lobstein T, Brownell KD. A crisis in the marketplace: how food marketing contributes to childhood obesity and what can be done. Annu Rev Public Health. 2009;30:211-25.Epub 2008/11/04. [ Links ]
]]> 32. Desrocher DM, DJ H. Children’s exposure to television advertising: implications for childhood obesity. Am Market Assoc. 2007: 182-201.
33. Goris JM, Petersen S, Stamatakis E, Veerman JL.Television food advertising and the prevalence of childhood overweight and obesity: a multicountry comparison. Public Health Nutr.13(7):1003-12.Epub 2009/12/19. [ Links ]
34. Agostoni C, Braegger C, Decsi T, Kolacek S, Koletzko B, Mihatsch W, et al. Role of dietary factors and food habits in the development of childhood obesity: a commentary by the ESPGHAN Committee on Nutrition. J Pediatr Gastroenterol Nutr.52(6):662-9. Epub 2011/05/20. [ Links ]
35. Borradaile KE, Sherman S, Vander Veur SS, McCoy T, Sandoval B, Nachmani J, et al. Snacking in children: the role of urban corner stores. Pediatrics. 2009;124: 1293-8. [ Links ]
36. APA. Ethical principles of psychologists and code of conduct. Washington DC: American Psychological Association; 2002; Available from: http://www.apa.org/ethics/code/principles.pdf. [ Links ]
]]>
37. Kuczmarski RJ, Ogden CL, Grummer Strawn LM,Flegal KM, Guo SS, Wei R, et al. CDC growth charts: United States. Adv Data. 2000(314):1-27. [ Links ]
38. Kuczmarski RJ, Ogden CL, Guo SS, Grummer-Strawn LM, Flegal KM, Mei Z, et al. 2000 CDC Growth Charts for the United States: methods and development. Vital Health Stat 2002;11(246):1-190. [ Links ]
39. Franchin L, Zobec F, Ghidina M, Stefanini G, Berchialla P, Gregori D. Measuring Brand Awareness in as a Component of Eating Habits in Children: the Development of the IBAI (Italian Brand Awareness Instrument). Progress in Nutrition. 2011;in press. [ Links ]
40. R Development Core Team. R: A language and environment for statistical computing. Vienna, Austria 2008. [ Links ]
41. Anschutz DJ, Engels RC, Van Strien T Seotfcocnssfiiyc. Side effects of television food commercials on concurrent nonadvertised sweet snack food intakes in young childrenAm J Clin Nutr 2009;89: 1328-33. [ Links ]
]]>
42. Mirch MC, McDuffie JR, Yanovski SZ, Schollnberger M, Tanofsky-Kraff M, Theim KR KJ, et al. Effects of binge eating on satiation, satiety, and energy intake of overweight children. Am J Clin Nutr. 2006;84(4):732-8. [ Links ]
43. Israel AC, Guile CA, Baker JE, Silverman WK. An evaluation of enhanced self-regulation training in the treatment of childhood obesity. J Pediatr Psychol. 1994; 19(6):737-49. [ Links ]
44. Dishion TJ, J.M. Tipsord. Peer contagion in child and adolescent social and emotional development. Annu Rev Psychol,. 2011;62:189-214. [ Links ]^rND^sGregori^nD^rND^sBallali^nS^rND^sGafare^nCE^rND^sCasella^nA^rND^sStefanini^nG^rND^sde Sousa Alves^nR^rND^sAbbott^nRA^rND^sLee^nAJ^rND^sStubbs^nCO^rND^sDavies^nPS^rND^sBrewis^nA^rND^sCartwright^nM^rND^sWardle^nJ^rND^sSteggles^nN^rND^sJoshi^nSR^rND^sMohan^nV^rND^sJoshi^nSS^rND^sMechanick^nJI^rND^sMarchetti^nA^rND^sGupta^nR^rND^sGupta^nKD^rND^sMisra^nA^rND^sSinghal^nN^rND^sSivakumar^nB^rND^sBhagat^nN^rND^sJaiswal^nA^rND^sKhurana^nL^rND^sHaffner^nSM^rND^sBray^nGA^rND^sMacdiarmid^nJ]]> ^rND^sLoos^nRJ^rND^sHill^nJO^rND^sWyatt^nHR^rND^sMelanson^nEL^rND^sBorradaile^nKE^rND^sSherman^nS^rND^sVander Veur^nSS^rND^sMcCoy^nT^rND^sSandoval^nB^rND^sNachmani^nJ^rND^sWang^nY^rND^sZhang^nQ^rND^sMartorell^nR^rND^sKhan^nLK^rND^sHughes^nML^rND^sGrummer-Strawn^nLM^rND^sHuybrechts^nI^rND^sDe Bourdeaudhuij^nI^rND^sDe Henauw^nS]]> ^rND^sBuijzen^nM^rND^sSchuurman^nJ^rND^sBomhof^nE^rND^sHalford^nJC^rND^sBoyland^nEJ^rND^sHughes^nGM^rND^sStacey^nL^rND^sMcKean^nS^rND^sDovey^nTM^rND^sVaz^nM^rND^sBharathi^nAV^rND^sKurpad^nAV^rND^sBrownell^nK.D.^rND^sPowell^nLM^rND^sSzczypka^nG^rND^sChaloupka^nFJ^rND^sBraunschweig^nCL^rND^sWiecha^nJL^rND^sPeterson^nKE^rND^sLudwig^nDS^rND^sKim^nJ^rND^sSobol^nA^rND^sGortmaker^nSL]]> ^rND^sGoris^nJM^rND^sPetersen^nS^rND^sStamatakis^nE^rND^sVeerman^nJL^rND^sAgostoni^nC^rND^sBraegger^nC^rND^sDecsi^nT^rND^sKolacek^nS^rND^sKoletzko^nB^rND^sMihatsch^nW^rND^sKuczmarski^nRJ^rND^sOgden^nCL^rND^sGrummer Strawn^nLM^rND^sFlegal^nKM^rND^sGuo^nSS^rND^sWei^nR^rND^sKuczmarski^nRJ^rND^sOgden^nCL^rND^sGuo^nSS^rND^sGrummer-Strawn^nLM^rND^sFlegal^nKM^rND^sMei^nZ]]> ^rND^sMirch^nMC^rND^sMcDuffie^nJR^rND^sYanovski^nSZ^rND^sSchollnberger^nM^rND^sTanofsky-Kraff^nM^rND^sTheim KR^nKJ^rND^sIsrael^nAC^rND^sGuile^nCA^rND^sBaker^nJE^rND^sSilverman^nWK^rND^nGiulia^sLorenzoni^rND^nSlavica^sZec^rND^nLouis^sFlores Farias^rND^nClaudia^sElena Gafare^rND^nPietro^sVassallo^rND^nGalvarino Jofré^sAraya^rND^nDario^sGregori^rND^nGiulia^sLorenzoni^rND^nSlavica^sZec^rND^nLouis^sFlores Farias^rND^nClaudia^sElena Gafare^rND^nPietro^sVassallo^rND^nGalvarino Jofré^sAraya^rND^nDario^sGregori^rND^nGiulia^sLorenzoni^rND^nSlavica^sZec^rND^nLouis^sFlores Farias^rND^nClaudia^sElena Gafare^rND^nPietro^sVassallo^rND^nGalvarino Jofré^sAraya^rND^nDario^sGregori
Giulia Lorenzoni, Slavica Zec, Louis Flores Farias, Claudia Elena Gafare, Pietro Vassallo,Galvarino Jofré Araya, Dario Gregori, and the OBEY-AD Study Consortium.
Unit of Biostatistics, Epidemiology and Public Health, Department of Cardiac, Thoracic and Vascular Sciences, University of Padova, Italy. Don Bosco Congregación Salesiana, Concepción Chile.
Department of Nutrition, University of Buenos Aires and Food and Diet Therapy Service, Acute General Hospital Juan A. Fernàndez, Buenos Aires, Argentina. Education department, Conferencia Episcopal de Chile. Faculty of Medicine, Imperial College London, United Kingdom.
SUMMARY: The present study aimed at assessing the impact of food advertising on snack consumption in Chilean children using an experimental, ad libitum, design. Forty children were enrolled in urban, middle class, school setting. They underwent anthropometric assessment, brand awareness evaluation, and their lifestyle and habits were recorded through a validated questionnaire administered to their parents. A 5-arm design was adopted, consisting in the exposure to five different levels of TV spots and advertising. No significant differences were identified in caloric intake among children randomized to different levels of TV spots and commercials exposure. No significant effects on caloric intake, caloric intake per BMI, and or glycemic load were detected, even after adjustment for confounding factors. This study suggests the need for a better analysis of the contribution of non-traditional factors to obesity onset in children, which can provide high-quality evidence in order to develop effective public health strategies to face childhood obesity epidemic.
]]> Key words: Children, food advertising, television, snack consumption, Chile.
RESUMEN. ¿Influye la publicidad de alimentos en el consumo de colaciones en los niños chilenos? Resultados de un estudio experimental ad libitum. El presente estudio tuvo como objetivo evaluar el impacto de la publicidad de alimentos en el consumo colaciones en los niños chilenos mediante la utilización de un diseño experimental basado en la voluntad de los participantes (ad libitum). Se realizó la inscripción de cuarenta niños en el contexto de una escuela urbana de clase media. Se les realizó una evaluación antropométrica, un examen de reconocimiento de marca y se procedió a registrar información sobre su estilo de vida y hábitos mediante un cuestionario validado que fue entregado a los padres y firmado por los mismos. Se adoptó un diseño de 5 grupos, que consistía en evaluar la
exposición a cinco niveles diferentes de publicidad y clips televisivos. No se identificaron diferencias significativas en cuanto a la ingesta calórica entre los niños asignados aleatoriamente a diferentes niveles de exposición a clips televisivos y a anuncios publicitarios. No se detectaron efectos significativos en tanto a la ingesta calórica, ingesta calórica por IMC, o la carga glucémica, incluso después de realizar el ajuste por factores de confusión. El presente estudio sugiere la necesidad de un mayor análisis respecto de la incidencia de factores no tradicionales en la aparición de la obesidad en los niños, que proporcione evidencia de alta calidad con el fin de desarrollar estrategias eficaces en materia de salud pública ante la epidemia de obesidad infantil.
Palabras clave: Niños, publicidad de alimentos, televisión, consumo de colaciones, Chile.
INTRODUCTION
Obesity prevalence in childhood has been rising worldwide (1, 2), both in developed and in newly industrialized countries. Childhood obesity represents a severe public health burden given its well-known association with metabolic and cardiovascular impairments. Understanding factors associated with obesity in children is crucial, in order to implement public health policies addressing obesity contributors, reducing obesity (and its comorbidities) burden.
]]> Several predictors have been identified, and they are distinguished usually in modifiable and non-modifiable. Among non-modifiable ones, genetics play an important role in predicting obesity onset (3). Among modifiable predictors, different contributors have been identified, including: dietary patterns (4); behavioral factors (physical activity levels, sedentary behaviors (5), daily sleep hours (6)); perinatal characteristics (7) (mother’s body mass index (BMI), birth weight, smoking during pregnancy, gestational diabetes); non-traditional risk factors (8) (food advertising, marketing of snacks with gadgets); and psychological ones (parents’ perception of child body shape (9), stressful events, quality of family relationship).
Recently, researches on obesity predictors have concentrated especially on non-traditional factors. It has been suggested that TV viewing and exposure to unhealthy food and beverages advertising are associated with increased caloric intake, and, consequently, to increased obesity likelihood (10, 11). However, when looking at the association between marketing of snacks with gadgets (in order to capture children’s attention) results are controversial. Experimental studies failed to identify a significant relationship between the exposure to food packaged with come-ons (e.g., toys) and increased caloric intake (12, 13), while observational ones seemed to suggest that the restriction in the use of gadgets for the promotion of energy-dense food results in healthier food choices (14).
Several governments worldwide have implemented interventions for obesity prevention by regulating advertisement aimed to children, and the marketing of food with come-ons, even if evidence from literature are controversial. Some examples of such regulations are represented by the Santa Clara County CA Ordinance (the first U.S. jurisdiction to prohibit the marketing of toys and other incentives with foods that do not meet nutritional recommendations), and the recent Chilean law on food labelling and advertising.
The recent Chilean regulation has prohibited the advertisement of food and beverages (high in sodium, total sugar, satured fat, and energy) and the use of come-ons, such as toys, stickers etc., in the promotion of such products to children under the age of 14. The adoption of such measures is motivated by the concerning high prevalence of childhood obesity, especially in Chile, where a recent report of the Chilean Health Ministry has shown that about 30% of preschoolers are overweight/obese (15).
Considering such framework, characterized by the urgent need to deal with childhood obesity epidemic, but the lack of evidence available on non-traditional obesity predictors, the aim of this study is to assess the impact of food advertising on snack consumption in Chilean children using an experimental, ad libitum, design.
]]> METHODS
The present experimental study was a spin-off of the OBEY-AD (OBEsogeneicitY of gADgets marketed with snacks) study, aimed at assessing the contribution of non-traditional factors on obesity development in children. Children aged 6-12 years were recruited from an urban, middle-class, school setting in the city of Santiago (Chile). Children suffering of allergies, cognitive disorders or metabolic diseases were excluded. Parents’ informed consent was obtained prior to children participation to the study. Subjects’ treatment was consistent with the guidelines of the American Psychological Association (APA) (16). Appropriate permissions
were obtained by the Institutional Review Board. A detailed description of the study is given elsewhere (12).
Experimental design and procedure
The experimental study was 5-arm ad libitum eating design (study procedure is reported in Figure 1). Children were exposed to ten different snacks (Table 1) that could be eaten ad libitum during the experimental session. The experimental factor was represented by the exposure to TV and advertising, organized in five levels: “no exposure to TV” (NoFilmNoSpot), “exposure to TV without advertising” (FilmNoSpot), “exposure to TV and one advertisement” (FilmLowSpot), “exposure to TV and two advertisements” (FilmMediumSpot), and “exposure to TV and three advertisements” (FilmHighSpot).
The film was a non-spoken cartoon lasting 22 minutes. It consisted of a set of episodes with Disney Pluto © as main character. The experimental session took place in a quiet room of the school facility during the afternoon break. Children participating to the study received the same meal and had consistent physical activity patterns. They were sitting at a table in front of a monitor (except to those randomized to the NoFilmNoSpot level), while the investigator was in a back-screen position to not interfere with children performance, but to be easily reachable from their requests. The session was videotaped using two hidden HD cameras. Parents were asked to not attend the experimental session; if they refused, they were asked to sit at the back of the room without being seen by the child. ]]>
Once enrolled in the study, children underwent anthropometric assessment and lifestyle habits recording (through a validated questionnaire). After baseline assessment, kids were randomized. Randomization was blocked by age and gender, and was performed using an ad hoc software integrated with data collection
and study conduction system. Subsequently, the investigator administered the International Brand Awareness Inventory (IBAI) (17) to children, and explained the next study’s steps.
Ten different snacks were presented to children (Table 1), and at the same time it was started the cartoon movie (when applicable, according to participants’ allocation). The snacks were placed on a tray, with their branded packages directed upwards. All children were asked to choose the snacks they preferred and to eat ad libitum. In order to calculate the amount of snacks eaten by each child, the residuals were weighed at the end of the experimental session and data were entered in the study software (each snack was identified with a code reported in the study’s system program together with its weight, assessed at the beginning of the study).

]]> TABLE 1. Nutritional facts of snacks presented to children in the experimental session.

Anthropometric measurements
Children’s were weighed and measured barefoot and wearing light clothes. Weight and height were assessed using a balance scale and a body meter with a wall stop. BMI was calculated as weight divided by height squared. Children were considered to be overweight/obese with a BMI ≥85th and underweight with a BMI <5th, according to CDC growth standards (18).
Study questionnaire
A cultural-specific questionnaire was administered to children’s parents in order to assess their son/daughter habits and lifestyles. The tool was made of different parts. The first one aimed at assessing family characteristics (number of siblings, age/weight/height/physical activity levels of parents and siblings, with whom the child lived); socio-economic status (parents’ working status and educational level, number of rooms in the house); time spent watching TV/videogames (hours the child spent each day watching TV and playing with videogames, number of TVs in the house, presence of the TV in the child room). The second section assessed child’s eating habits (food frequency, if the child usually had breakfast/snacks/lunch/dinner) and feeding practices in early childhood (if the child was breastfed and how long). The third part consisted on a projective test investigating mother’s perception of child’s body size, and the ]]> last one assessed child’s physical activity levels.
Brand awareness
Children’s brand awareness was evaluated by administering the IBAI questionnaire. It is a validated instrument, consisting on 12 images of food products (both international and country-specific). Children were asked to: recognize the brand, match the brand with the corresponding food product and name the product. Details of the instrument are given elsewhere (17, 19).
Power calculation
Basic assumptions for powering the study were a consumption in the baseline groups (NoFilmNoSpot) of 200 Kcal, roughly corresponding to the consumption of a snack during the experimental session. Standard deviation of the regression errors has been set to 100 Kcal based on previous pilot observations. If the true slope of the line obtained by regressing Kcal consumption against experimental arm levels is 5.5 (trend analysis), 32 subjects were needed to be able to reject the null hypothesis that this slope equals zero with probability (power) 0.8. The Type I error probability associated with this test of this null hypothesis is 0.05. Sample size has been increased to 8 for accounting for non-experimental variations in the study subjects.Sample size has been estimated using PS (20).
]]> Statistical analysis
Basic descriptive data analysis has been performed on the sample and reported using median (I-III quartile) for continuous variables and percentages (absolute numbers) for categorical variables, whenever appropriate. Further exploratory data analysis has been conducted to highlight the differences in the co-primary endpoints (Kcal and Kcal/BMI and Glycemic Load) across the study regimes, reporting the median and the interquartile range for both, stratified by NoFilmNoSpot, FilmNoSpot, FilmLowSpot, FilmMediumSpot and FilmHighSpot. These results can be further visualized graphically in the corresponding boxplot. (see Figure 2, Figure 3 and Figure 4).
Main analysis has been based on a linear model where blocking factors (sex and age) and FilmSpot have been inserted in the model. This is the base model used in the analysis, where specific investigations on single factor-level effects have been conducted using appropriate linear contrasts.
To further check for additional confounding factors, adjusted model has been developed, using the AIC criterion in the backward fashion. For each model, significance of the main experimental factor (exposure to TV or spot) has been assessed. Children were classified as “high consumers” if their energetic intake during the sessions exceeded the III quartile of the distribution. Basic descriptive data analysis has been performed on the stratified sample and reported using median (I-III quartile) for continuous variables and percentages (absolute numbers) for categorical variables, were reported. Also, accordingly association tests
were conducted between the probability to be a high-end consumer and selected variables (Fisher exact test for the categorical variables and t test for the continuous). Analyses has been conducted using the R System (21).
RESULTS ]]>
Forty children, balanced by gender, were enrolled. Children’s age ranged from 6 to 12 years (median age 9.5 years). More than an half of them was found to be overweight/obese according to the CDC growth charts (18), and to never do physical activity (22%) or to do it rarely (45% of children did physical activity only half an hour or an hour per week). Despite the fact that most of children were found to be physically inactive, most of them were reported to do not play with videogames (42.5%) or to play with videogames no more than an hour per week (50%), even if they spent a median time of 18 hours per week watching TV (roughly at least 2 hours per day). Median IBAI score was found to be 19 (15, 22 I-III quartile), corresponding to a medium-low/medium-high brand awareness. Sample characteristics are summarized in Table 2.

During the experimental session, children were found to eat a median of 453.7 kcal, corresponding to a median glycemic load of 24.725. Table 3 shows caloric intake (rough and per BMI) and glycemic load according to exposure to TV and advertising, and the differences in the intake of children randomized to different levels of TV/advertising exposure compared to those randomized to the NoFilmNoSpot level. Despite the fact that children allocated in the FilmMediumSpot and in the FilmHighSpot levels were reported to have higher caloric intake (rough and per BMI), and glycemic load compared to the other children (as it is depicted in Figure 2, 3, and 4), no significant differences were identified. No significant effects on caloric intake, caloric intake per BMI, and glycemic load were
detected, even after adjustment for potential confounding factors using both single comparisons to the reference level NoFilmNoSpot (Table 4) and multiple comparisons between different treatment regimens (Table 5).
]]> Looking at the characteristics of children classified as “low consumers” and “high consumers” (according to the III quartile of the distribution of the energy intake), higher consumers were found to be more likely to be obese compared to the “low consumers”. However, referring to the study factors, no significant differences were identified according to treatment allocation.

FIGURE 2. Energy intake (Kcal) according to TV/advertising exposure.

FIGURE 3. Energy intake (Kcal/BMI) according to TV/advertising exposure.

FIGURE 4. Glycemic load according to TV/advertising exposure. ]]>

TABLE 4. Significance of the TV and spot regimes in comparison to the reference level (NoFilmNoSpot) after adjustment for several potential confounding factors.

TABLE 5. Multiple comparison of different treatment regimes. Last column reports the results of the comparison between Treatment (pooled exposure to TV with or without advertising (FilmNoSpot + FilmLowSpot + FilmMediumSpot + FilmHighSpot)) vs No treatment (no TV exposure (NoFilmNoSpot)).


The aim of the present study was to assess if an association existed between TV advertising and snack consumption in Chilean children. Understanding factors associated to obesity onset is relevant among kids living in Chile, given the concerning high prevalence of childhood obesity. In recent years, this country goes through a rapid economic improvement. Along with such economic improvement, a social and cultural transition has taken place, resulting in substantial changes in living conditions (e.g., adoption of better hygiene practices and food habits, but also of sedentary lifestyles and of energy-dense food consumption, instead of fruits, vegetables, and whole grains) (22). Referring specifically to nutrition transition, these changes contribute to a progressive reduction of undernutrition, but result in a dramatic growth of obesity (and its comorbidities) prevalence, especially among children and adolescents (15). Reflecting this concerning scenario, more than a half of children enrolled in the study were found to be overweight or obese, and to be scarcely physically active, which is consistent with previous research in the field (23).
The hypothesis of the existence of an association between commercials and snack consumption has been motivated by previous research suggesting that food advertising might influence food behaviors regardless subjects’ awareness (24). The analysis of data from the experimental session showed no significant association between TV/food advertising exposure and energy intake. These findings differed from those reported in previous studies, which generally have demonstrated that exposure to food advertising results in higher energy intake (25, 26). However, it has been suggested the existence of an inter-regional variability influencing the association between food advertising and snack consumption (12, 13). Moreover, a recent review on clinical trials analyzing the relationship between TV/advertising exposure and caloric intake has shown that first-quality evidence in this field are lacking. This is because generally studies have focused on children’s choice and preferences and not on their actual intake of food, even if it could not be directly translated children’s preferences to their actual consumption (27).
Results of this study show that the association between advertising and caloric intake is not obvious and possibly depending from the actual context where it is evaluated. Recent regulatory activities might be important steps in limiting consumption of specific food items. In this sense, it is essential to strictly monitor both the short and long-term effects of such regulation, carefully evaluating any changes in food choices and in overweight/obesity (and their comorbidities) prevalence among Chilean population, in order to evaluate the actual effectiveness of such public health strategies against childhood obesity epidemic. ]]>
SOURCE Of FUNDING
The work has been partially supported by an unrestricted grant from the Italian Ministry of Foreign Affairs under the programs “Programmi di alta rilevanza scientifica e tecnologica” Italia-Messico and Italia-Argentina, and from Prochild ONLUS (Italy).
REFERENCES
1. Ahrens W, Pigeot I, Pohlabeln H, De Henauw S, Lissner L, Molnár D, et al. Prevalence of overweight and obesity in European children below the age of 10. International Journal of Obesity. 2014;38:S99-S107. [ Links ]
2. Ogden CL, Carroll MD, Kit BK, Flegal KM.Prevalence of obesity and trends in body mass index among US children and adolescents, 1999-2010.Jama. 2012;307(5):483-90. [ Links ]
3. Herrera BM, Lindgren CM. The genetics of obesity. Current diabetes reports. 2010;10(6):498-505. [ Links ]
4. Ambrosini GL. Childhood dietary patterns and later obesity: a review of the evidence. Proceedings of the Nutrition Society. 2014;73(01):137-46. [ Links ]
5. Tremblay MS, LeBlanc AG, Kho ME, Saunders TJ, Larouche R, Colley RC, et al. Systematic review of sedentary behaviour and health indicators in school-aged children and youth. International Journal of Behavioral Nutrition and Physical Activity. 2011;8(1):1. [ Links ]
6. Touchette E, Petit D, Tremblay RE, Boivin M, Falissard B, Genolini C, et al. Associations between sleep duration patterns and overweight/obesity at age. Sleep. 2008;31(11):1507-14. [ Links ]
7. Catalano PM, Farrell K, Thomas A, Huston-Presley L, Mencin P, de Mouzon SH, et al. Perinatal risk factors for childhood obesity and metabolic dysregulation. ]]> The American journal of clinical nutrition. 2009:ajcn.27416.
8. Lobstein T, Dibb S. Evidence of a possible link between obesogenic food advertising and child overweight. Obesity reviews. 2005;6(3):203-8. [ Links ]
9. Hochdorn A, Baldi I, Paramesh EC, Kumar M, Gulati A, Gregori D. Is My Kid Out of Size? Indian Mothers’ Desirability Bias in Evaluation of Their Children’s Weight. The Indian Journal of Pediatrics.2014;81(1):39-46.
10. Boulos R, Vikre EK, Oppenheimer S, Chang H,Kanarek RB. ObesiTV: how television is influencing the obesity epidemic. Physiology & behavior.2012;107(1):146-53. [ Links ]
11. Boyland EJ, Nolan S, Kelly B, Tudur-Smith C, Jones A, Halford JC, et al. Advertising as a cue to consume:a systematic review and meta-analysis of the effects of acute exposure to unhealthy food and nonalcoholic beverage advertising on intake in children and adults. The American journal of clinical nutrition.2016:ajcn120022. [ Links ]
]]>
12. Gregori D, Ballali S, Gafare CE, Casella A, Stefanini G, de Sousa Alves R, et al. Investigating the obesogenic effects of marketing snacks with toys: an experimental study in Latin America. Nutrition journal. 2013;12(1):1. [ Links ]
13. Gregori D, Gulati A, Hochdorn A, Ballali S, Paramesh H, Kumar M, et al. Food packaged with toys: an investigation on potential obesogenic effects in Indian children. The Indian Journal of Pediatrics. 2014;81(1):30-8. [ Links ]
14. Otten JJ, Hekler EB, Krukowski RA, Buman MP, Saelens BE, Gardner CD, et al. Food marketing to children through toys: response of restaurants to the first US toy ordinance. American journal of preventive medicine. 2012;42(1):56-60. [ Links ]
15. Ministerio de Salud, Subsecretaria de Salud Pública, División Políticas Públicas Saludables y Promoción,Depto. Nutrición y Alimentos. Diagnóstico del estado nutricional de menores de 6 años, gestantes, nodrizas y adultos mayores, bajo control en el sistema público de salud. Fuente: DEIS (Datos: diciembre, 2013).Agosto, 2014. [ Links ]
16. Association AP. American Psychological Association ethical principles of psychologists and code of conduct. 2002. [ Links ]
]]>
17. Vecchio MG, Berchialla P, Didier N, Cayul O, Valdenegro D, Ghidina M, et al. The IBAI instrument to assess brand awareness toward food in children:the Chile adaptation. The Open Obesity Journal.2013;5(1). [ Links ]
18. Kuczmarski RJ, Ogden CL, Grummer Strawn LM, Flegal KM, Guo SS, Wei R, et al. CDC growth charts:United States. Adv Data. 2000(314):1-27. [ Links ]
19. Vecchio MG, Ghidina M, Gulati A, Berchialla P, Paramesh EC, Gregori D. Measuring brand awareness as a component of eating habits in Indian children:The development of the IBAI questionnaire. The Indian Journal of Pediatrics. 2014;81(1):23-9. [ Links ]
20. Dupont WD, Plummer WD. PS power and sample size program available for free on the Internet. Controlled clinical trials. 1997;18(3):274. [ Links ]
21. Team RC. R: A language and environment for statistical computing. R Foundation for Statistical Computing, Vienna, Austria. 2013. ISBN 3-900051-07-0; 2014. [ Links ]
]]>
22. Albala C, Vio F, Kain J, Uauy R. Nutrition transition in Chile: determinants and consequences. Public health nutrition. 2002;5(1a):123-8. [ Links ]
23. Liberona Y, Castillo O, Engler V, Villarroel L, Rozowski J. Nutritional profile of schoolchildren from different socio-economic levels in Santiago, Chile.Public Health Nutrition. 2011;14(01):142-9. [ Links ]
24. Bargh JA, Morsella E. The unconscious mind. Perspectives on psychological science. 2008;3(1):73-9. [ Links ]
25. Sadeghirad B, Duhaney T, Motaghipisheh S, Campbell N, Johnston B. Influence of unhealthy food and beverage marketing on children’s dietary intake and preference: a systematic review and meta-analysis of randomized trials. Obesity Reviews.2016;17(10):945-59.
26. Boyland EJ, Whalen R. Food advertising to children and its effects on diet: review of recent prevalence and impact data. Pediatric diabetes. 2015;16(5):331-7. [ Links ]
]]>
27. Gregori D, Ballali S, Vecchio MG, Sciré AS, Foltran F, Berchialla P. Randomized Controlled Trials Evaluating Effect of Television Advertising on Food Intake in Children: Why Such a Sensitive Topic is Lacking Top-Level Evidence? Ecology of food and nutrition. 2014;53(5):562-77. [ Links ]
Dario Gregori, Giulia Lorenzoni, Simonetta Ballali, Maria Gabriella Vecchio,Elvira Verduci, Paola Berchialla.
Unit of Biostatistics, Epidemiology and Public Health, Department of Cardiac, Thoracic and Vascular Sciences, University of Padova, Italy. ZETA Research Ltd, Trieste, Italy. Department of Health Sciences, San Paolo Hospital, Pediatric Clinic, University of Milano, Italy. Department of Clinical and Biological Sciences, University of Torino, Torino, Italy.
SUMMARY: The aims of the study were to assess the effects of the brand when snacking in children 6-11 years old and to evaluate the effect of different levels of brand awareness on children’s intake. A 3x2 factorial design was adopted, and 96 children were randomized based on their brand awareness scores, assessed using the IBAI instrument and the study was conducted over two experimental sessions. First, 11 snacks were presented to the half of children laying on their own branded packages, whilst to the other half unbranded. In a second afternoon break, on a different day, the condition of branded/unbranded was crossed-over. Children were randomized in three groups based on combinations of concomitant TV and advertising exposure. Caloric intake (Kcal) of snacks eaten during sessions was taken as the main study outcome. No significant differences in energy intake were recorded according to brand visibility, both in children with high and low brand awareness. Exposure to TV and advertising showed no significant association with energy intake in the different groups and with the likelihood of being a high consumer. The present study suggested that brand visibility did not promote a higher caloric intake in 6-11 years old children during a snacking occasion.
Key words: Food brand, snacking, advertising, ad libitum, brand awareness, caloric intake.
RESUMEN. ¿La visibilidad de la marca en el empaque afecta el consumo en los niños? Resultados de un estudio experimental ad libitum. Los objetivos del estudio fueron el evaluar los efectos de las marcas comerciales durante una merienda en niños de entre 6 y 11 años de edad, así como analizar el efecto de diferentes niveles de conciencia de marca en el consumo de los niños. Se utilizó un diseño factorial 3x2, y se asignó al azar a 96 niños según sus puntuaciones de conciencia de marca, que fueron evaluados mediante el instrumento IBAI. El estudio se realizó en dos sesiones experimentales. En primer lugar, se presentaron 11 bocadillos (alimentos), a la mitad de los niños colocando en sus propios paquetes de marca, mientras que a la otra mitad sin marca. En un segundo recreo de la tarde, otro día, se realizó un cruce en la condición de bocadillos de marca y sin marca. Los niños fueron asignados al azar en tres grupos, según combinaciones concomitantes de exposición a la televisión y a pautas publicitarias. La ingesta calórica (Kcal) de bocadillos consumidos durante las sesiones se adoptó como principal resultado del estudio.No se registraron diferencias significativas en el consumo de energía dependiendo de la visibilidad de la marca, ni en
los niños con un alto o bajo reconocimiento de marcas. La exposición a la televisión y a la publicidad no mostró una asociación significativa con el consumo de energía en los diferentes grupos y ni con la probabilidad de ser un gran consumidor. El presente estudio sugiere que la visibilidad de las marcas no promueve una mayor ingesta calórica en niños de entre 6 y 11 años de edad en el contexto de una merienda. ]]>
Palabras clave: Marca de alimentos, refrigerio-colación, publicidad, a gusto, conocimiento de la marca, ingesta calórica.
INTRODUCTION
The growing prevalence of overweight and obesity in children has gathered an extensive interest from the scientific community (1), shifting from an initial analysis dedicated to assess the present situation and its outcomes toward a broader research targeting potential risk factors involved in its development and maintenance. The increase in childhood and adolescent obesity is leading to adverse health outcomes in the short and in the long term (2, 3), since it is deleterious to individual health, and it also results in a rising cost for the public sector. The multifactorial network characterizing obesity determinants has frequently been mentioned, in order to broaden research towards a complex scenario taking into account mutual influences and relationships (4, 5). Each node of
this net is characterized by different factors, that are modified, switched, and triggered by several macro structures, like genetics, behavior, built and social environment.
Among various factors identified as possible causes for the increase of children’s obesity, television viewing and advertising aimed at children are among the most important factors that have been linked to a reduction in physical activity and an overconsumption of food high in fat and sugar (6, 7). The mechanism is etiologically grounded on the lower caloric expenditure associated with TV viewing and the increased caloric intake due to TV-generated distraction and snack advertisements. In addition, recent studies have pointed out that, especially in overweight and obese children, preference for high carbohydrate and high fat foods is enhanced in children who are exposed to the greatest amounts of televisual media (8). Experimental studies in adults suggest that focusing attention on watching TV or listening to music while eating may disrupt the ability to regulate energy intake and promote overeating (9, 10). Similar associations were found in children, showing a positive association between TV viewing and childhood obesity (11,12), but they failed to describe the mechanisms underlying these results. Costa showed the inverse association between screen time and daily consumption of fruits, concluding that the number of television in a household is positively related to BMI in children and adolescents (13).
Literature provides such heterogeneous results referring to the impact of food advertising on children’s food consumption (14). The effect of advertising and its interaction with brand visibility during afternoon snack time has not been yet jointly investigated. Indeed, afternoon snacking has not been very much studied, and its effects, both in terms of nutrient composition and caloric intake, on dinner eating habits or its impact on after-school physical activity are still not entirely known (15). ]]>
The primary aim of the present study was to assess the effect of having brands displayed in food packaging on children’s eating behavior during an afternoon snack time. The secondary objective is to evaluate the effect of different levels of brand awareness on children’s intake. By design, TV viewing and brand advertising (displayed both on food package and on TV commercials) were taken into account as potentially intervening factors and balanced during randomization.
MATERIALS AND METHODS
Design
The present study was a randomized, 3x2 factorial experimental study. For logistic purposes, the study was organized in three steps: assessment of brand awareness (Step 0), evaluation of brand visibility on children’s caloric intake (Step 1), repetition of Step 1 by crossing over the condition of branded/unbranded visibility (Step 2).
In Step 0 children were selected by means of the score reported from a modified version of the original IBAI questionnaire (16), assessing brand awareness. The total sample was then divided into two groups, one included high brand awareness (characterized by a total scoring ≥40 points) subjects, and the other, a low brand awareness (< 40 points) ones. Furthermore, each group was further assigned to one of three different conditions of TV exposure (No TV, TV, TV + advertising), resulting in 6 factorial combinations. In each category, the resulting 12 children were stratified for brand awareness, age, and gender (Table 1) and finally randomized to brand visibility. In summary, the experimental study developed in Step 1 had a 2x3 (Brand Visibility x TV and advertising exposure) full factorial design, blocked by age (two groups 6-8 and 9-11 years old), by gender (male and female) and by brand awareness. Specifically, the first factor was TV exposure, organized in 3 different levels: no TV exposure, exposure to cartoons, and exposure to cartoons and advertisements.
The second factor was the presence of the brand on the snacks given to children, and was organized in two levels: presence of the brand (branded), absence of the brand (unbranded). Step 2 was carried out equally to Step 1, but inverting the brand level in the two groups (branded snack were given to the subsample that had received an unbranded snack in Step 1, and vice versa). ]]>
Participants
Ninety-six children between 6 and 11 years of age were selected to have high and low level of brand awareness. Children were recruited as equally distributed by gender and age: forty-eight 6-8-year-olds (24 female) and forty-eight 9-11-year-olds (24 female). Children with cognitive disorders or metabolic diseases or allergies to the products offered during the experimental session were excluded. Parent informed consent was obtained for all children prior to each child’s participation in the study.Children’s participation followed the guidelines and ethics issued by APA (17). Parents were asked not to provide snacks to children in the hours before the experimental sessions.

]]> The sample size of 96 children was computed with reference to an alpha equal to 0.05 and a power of 0.90, which aimed at detecting at least a difference of 20 Kcal of caloric intake (assuming an equal standard deviation in the two groups of approximately 30 Kcal) between the two groups of Brand Visibility in each of the 8 randomization cells (Age x Gender x Brand Awareness).
Experimental procedure
The preliminary phase of this study (Step 0) involved sample recruitment and stratification. The sample consisted of children between 6-11 years (children attending primary school). Children were selected on the basis of their level of brand awareness assessed by means of the IBAI (Italian Brand Awareness Instrument (16); a logo-matching exercise, consisting of 30 pictures representative of food brand logos) and they were equally divided into high and low brand awareness groups.
The experiment was characterized by two experimental sessions separated by a 2-week period (Step 1 and Step 2), in which parents were asked to bring their children to the laboratory during two afternoon breaks. The project flow is presented in Figure 1. In Step 1, 11 snacks were placed on a tray, laying on their own branded packages, for half of the sample, whilst the other half of the children received a neutral tray (unbranded). After 2 weeks period, Step 2 was performed and the condition of branded/unbranded was inverted for the same two subgroups of the sample. The snacks utilized in the experiment were Kinder Frutti©, Ferrero Brioss Albicocca©, Kinder Brioss Latte©, Kinder Delice©, Mulino Bianco Flauti Latte©, Mulino Bianco Flauti Albicocca©, Mulino Bianco Pan Goccioli©,Mulino Bianco Saccottino Albicocca©, Mulino Bianco Pan di Stelle©, Kinder Yogo Brioss©, Mulino Bianco Plum Cake©. Snacks included: cocoa biscuits (Mulino Bianco Pan di Stelle©); individually packaged soft pastries with apricot jam (Kinder Frutti©, Ferrero Brioss Albicocca©, Mulino Bianco Flauti Albicocca©, Mulino Bianco Saccottino Albicocca©, Kinder Yogo Brioss©), milk cream (Kinder Brioss Latte©, Mulino Bianco Flauti Latte©) and chocolate chips (Mulino Bianco Pan Goccioli©); individually packaged soft sponge with cocoa cream topping and filled with milk cream (Kinder Delice©); individually packaged mini-plum cakes made with yogurt (Mulino Bianco Plum Cake©). Children’s preferences towards these snacks were not investigated.

The two groups of children characterized by different brand awareness (high and low brand awareness) were randomized into 3 groups based on TV and advertising exposure: No TV, TV, TV and advertising. Within the “TV” subgroup, younger children watched a 16 min. episode of Disney© Lion King, while the older ones watched a 16 min. episode of Marvel© Spiderman. The advertising utilized in the third subgroup was embedded within the movies and consisted in 7 spots lasting for 3 minutes, referred to the products that children had on the tray they were facing.
All children were asked to eat ad libitum and to choose the snacks they preferred, being given 16 minutes from their first bite. All the snacks were weighed with a high-precision balance before and after each session, in order to quantify the amount of snack not eaten, therefore estimating energy intake of each child.
Measures
Socio-Demographic variables
Before the starting of the experimental session, parents were interviewed by the investigators in order to assess demographic parameters, children’s health status, behaviors, frequency of food consumption, food habits, physical activity,daily lifestyle (sleep, TV viewing, after- school care, etc.). ]]>
IBAI questionnaire
Food images represented in the 30 flash-cards of the IBAI were shown to the children (16), interviewing them on food images’ brand and product names and subsequently on the correct matching of each logo with the right food, between four choices of foods.
At the end, the interviewer asked the child on the specific name of the product. Brand Awareness Scores (IBAI-score) could range from a minimum of 0 to a maximum of 90, with a cut-off set at 40 points which was used to define the two groups: low brand awareness children (<40) and high brand awareness (≥ 40) (16).
Snacks weighing
At the beginning of the study, every snack was assigned with a specific code and was weighed in order to record these data in the software used for the study. At the end of every session, each snack the child had had was weighed once again in order to calculate the difference in terms of eaten products. All weights were collected by means of an Acculab© precision weighing scale with the capacity of 510g of and 0.1g readability. ]]>
Statistical analysis
A basic exploratory data analysis was performed on the sample and it was reported using the median (I-III quartile) for continuous variables and the percentages (absolute numbers) for categorical variables, as appropriate. The main analysis has been based on a linear model for caloric intake where the blocking factors (i.e., Gender, Age in two classes according to the randomization procedure, and Brand Awareness) have been forced to stay in the models. Repeated measurements were taken into account using the sandwich estimator of Huber-White (18, 19).
Specific investigations on single factor-level effects have been conducted using appropriate linear contrasts. To check for additional confounding factors, a further model, in addition to the base one has been developed, performing a selection among the candidate variables using the AIC criterion in the backward fashion, still forcing the inclusion of the design variables in the model.In addition, children were identified as “high consumers” if their caloric intake during the experimental session exceeded the top quartile of the observed distribution. The variables related to the probability of being a high consumer were modelled using a logistic regression model, again using the Huber-White estimator for accounting for repeated measurements, and selected via the AIC criterion in a backward fashion.The analyses have been performed using the R System (20).
RESULTS
Ninety-six children were assessed using the IBAI questionnaire and were selected to participate to the following phases, equally divided by age (6-8 and 9-11 years), gender, (male and females) and brand awareness score. They were unselected for overweight or obesity. The highest median brand awareness score was retrieved in older males (47.00), while the lowest was measured in the younger female group (26.58). ]]>
Sample characteristics (assessed by children questionnaire), in accordance to brand visibility and also to TV exposure (no TV, only TV, TV+advertising) are summarized in Table 1 along with their main characteristics in Table 2.Comparing the caloric intake of the three groups of children (no TV exposure, only TV exposure, TV+advertising exposure) when both snacks were branded and unbranded, no significant differences were recorded (Table 3), neither in Step 1 and Step 2. Despite no significant differences, we found out that, in the group of non-visible brand (Step 1), children not exposed to TV presented an intake of 100
kcal higher than those exposed to TV+spot.
Referring to the multivariable model, even after adjustment for potential confounders, we showed no significant association between increased caloric intake and Brand visibility (Table 4).
TABLE 2. Description of the sample. Summaries for categorical variables are expressed as percentage (absolute numbers in parenthesis) and for continuous variables as I quartile / median / III quartile.
]]>

Continuación...


]]> TABLE 4. Multivariable model to assess the association between caloric intake and other parameters recorded with children questionnaires.


]]> FIGURE 3. Trends of energy intake among children of the low brand awareness group, exposed or not exposed to TV viewing and package’s brand.

High consumer
The top quartile of energy intake corresponded to 319 Kcal. This value has been chosen as the cut-off to identify the subgroup of 21 children with higher energy intakes during the experimental session in order to investigate factors associated to higher energy intake in this snacking occasion. Table 5 shows the main characteristics of these “high consumer” children. At the multivariable analysis, no significant association was found for the experimental factor TV (p-value 0.251), Brand Visibility (p-value 0.328) or their interaction (p-value 0.177) with the “high consumer” status. The only variable associated with this status turned out to be the age group of the child. Taking the 6-8 year-old age group as reference, the Odds Ratio (OR) of being a “high consumer” was 0.45 (95% C.I. 0.23-0.89) for older children in the age group 9-11 years.
TABLE 5. Characterization of the High Consumers according to the main study variables. Values for the categorical variables are expressed as a percentage (absolute numbers in parenthesis) and those for the continuous variables as the median (I quartile / median / III quartile).
]]>

Continuación...

]]> This study was conducted among a sample of Italian children, where TV advertising it is demonstrated to be similar to those in other countries and in particularly in US. A study published in 2010 (21), comparing food advertising in children’s TV channels of Europe, America, Australia and Asia, demonstrated that food is one
of the most advertised products in all the countries involved in the study. However, regarding the type of food advertised, it found differences among Italian and US advertising, showing that fast food and chocolate/confectionary are the most common marketed products in US and Italy respectively. These results are consistent with a study (22) conducted on Italian food advertising for children which revealed that sweets were the products most frequently advertised.
The existence of an association between TV, advertising and risk of being overweight or obese has been evaluated in numerous studies(23-25), obtaining contrasting results. This study aimed at understanding the association between food consumption during snacking times, brand visibility and TV viewing. With respect to the primary objective of the study, the assessment of the effect of TV viewing and brand advertising, the present study showed no significant effect on total energy intake. The secondary objective was to evaluate the effect of different levels of brand awareness on children’s intake. Similarly to the previous results, no significant association of increased intake was recorded in any of the two brand awareness groups, showing similar trends also for brand and TV exposure.
The results of the present study disagreed with previous research studies, where a positive association was found between advertising and TV viewing and increased energy intake. Halford and colleagues showed that 9-11-year-old (26) and 5-7 year-old (27) children increased their intake of most food types after viewing food adverts, and that the ability to correctly recognize these food adverts was significantly associated with higher food intake following food advert exposure. Similar conclusions were found by Lobstein, that in 2004 stated that the overall findings justified the need for taking precautionary measures to reduce children’s exposure to obesogenic marketing practices (11).
In our study, no significant association between brand visibility and increased caloric intake was found, neither in children with high brand-awareness nor in those with low brand-awareness.Children showed a somewhat homogeneous overall intake with a median of 3 snacks per child. When considering solely the effect of a brand on children’s snack intake, it resulted that if the packages were unbranded, children (in particular, males) tended to consume a higher number of grams of snacks, therefore increasing their caloric intake. These findings were consistent with those in Anschutz’s research, which highlighted in boys an increased susceptibility to food cues in food commercials (28).
As suggested also from the research of Francis, TV viewing could either increase or decrease children’s food intakes (25). Specifically, our study showed that in low awareness children, both TV groups experienced a decreased intake of snack when switching from unbranded towards branded packages. Additionally, children not exposed to TV showed an increased intake with branded snacks in comparison with unbranded snacks. Results were nonetheless not significant. Children seemed to be more prone to eat when they weren’t distracted from any other factor, while TV viewing and brand presence didn’t modify their eating behavior towards a larger request of snacks. These findings were not in line with previous ones, which associated increased snacking behavior with screen time ]]> (29).
A multivariable model was used to assess the association between increased caloric intake and other parameters recorded with children questionnaires. In the present sample, confectionery’s habitual consumption appeared to be a protective factor, showing a decreasing effect on overall caloric intake, while being a male and belonging to an older group showed a boosting effect on energy intake.
As a study limitation, it must be taken into consideration that this body of evidence emerges from an experimental study whose results can be extrapolated in the real life with caution. Nevertheless, all efforts were made to minimize biases. All the participating children attended the same school, attending the same meal supply chain and were brought in to the experimental area by their parents, not having eaten any other item before the study. In addition, the ad libitum method allowed us to focus our attention on the children’s satiety point, giving them complete freedom while they were eating the chosen snacks, without any intervention of the interviewer in terms of neither limiting their choices nor highlighting the presence of the brand on the children’s trays. Finally, we did not investigate children’s preferences towards the snacks presented in the study and consequently we could not evaluate the effect of children’s attitudes on energy intake.
Implications for Research and Practice The present study failed to prove, in an after-noon snacking occasion, an effect of TV viewing and advertising in children, even when considering the high brand awareness subgroup. While breakfast habits and their effects have been largely investigated, the role of afternoon snacking has been less studied, both from nutritional and from behavioral point of view. However, it’s crucial to widely study this snacking occasion in children, because afternoon snack presents unique characteristics that differentiate it from morning snack, especially in Italian context. While in the morning children have snack at school (which could also provide snacks, such as fruits or yogurt, as in some Italian school facilities implementing project for healthy nutrition), in the
afternoon children have snacks usually outside school so they could be exposed to TV viewing (and consequently to TV spot).
Our results might indicate that children’s attitudes to food during afternoon snacking is less modified by exposure to known and common factors like television and advertising. Further research is needed in order to guide health policies aimed at fighting childhood obesity epidemic. ]]>
SOURCE OF FUNDING
The work has been partially supported by an unrestricted grant from the Italian Ministry of Foreign Affairs under the programs “Programmi di alta rilevanza scientifica e tecnologica” Italia-Messico and Italia-Argentina, and from Prochild ONLUS (Italy).
ACKNOWLEDGMENTS
The study group gratefully acknowledges Ferrero Inc. and Barilla S.p.A. for having provided all the experimental food. All authors declare to not have any conflict of interest.
CONFTICTS OF INTEREST ]]>
The authors have no competing interests
REFERENCES
1. Bray GA. Obesity: historical development of scientific and cultural ideas. Int J Obes. 1990 Nov;14(11):909-26. PubMed PMID: 2276853. Epub 1990/11/01. eng. [ Links ]
2. Nadeau KJ, Maahs DM, Daniels SR, Eckel RH. Childhood obesity and cardiovascular disease: links and prevention strategies. Nat Rev Cardiol. 2011 Jun 14. PubMed PMID: 21670745. Epub 2011/06/15. Eng. [ Links ]
3. LaRosa C, Meyers K. Epidemiology of hypertension in children and adolescents. J Med Liban. 2010 Jul-Sep;58(3):132-6. PubMed PMID: 21462840. Epub2011/04/06. eng. [ Links ]
4. Spruijt-Metz D. Etiology, Treatment and Prevention of Obesity in Childhood and Adolescence: A Decade in Review. J Res Adolesc. Mar;21(1):129-52. PubMed
PMID: 21625328. Epub 2011/06/01. Eng.
5. Monasta L, Batty GD, Cattaneo A, Lutje V, Ronfani L, Van Lenthe FJ, et al. Early-life determinants of overweight and obesity: a review of systematic reviews. Obesity reviews : an official journal of the International Association for the Study of Obesity.2010 Oct;11(10):695-708. PubMed PMID: 20331509. [ Links ]
6. Caroli M., Argentieri L., Cardone M., Masi A. Role of television in childhood obesity prevention. International Journal of Obesity. 2004;28:104-8. [ Links ]
7. Mcginnis J.M., Gootman J., Kraak V.I. National Academy of Sciences, Committee on Food Marketing and the Diets of Children and Youth. Food Marketing to Children and Youth: Threat or Opportunity? Press NA, editor. Washington, DC: Institute of Medicine;2006. [ Links ]
]]>
8. Boyland EJ, Halford JC. Television advertising and branding. Effects on eating behaviour and food preferences in children. Appetite. 2013 Mar;62:236-41. PubMed PMID: 22421053. [ Links ]
9. Stroebele N., de Castro J. M. Television viewing is associated with an increase in meal frequency in humans. Appetite. 2004;42:111-3. [ Links ]
10. Jeffery R.W., French S.A. Epidemic obesity in the United States: Are fast foods and television viewing contributing? American Journal of Public Health. 1998;88:227-80. [ Links ]
11. Lobstein T, Dibb S. Evidence of a possible link between obesogenic food advertising and child overweight. Obesity reviews : an official journal of the International Association for the Study of Obesity.2005 Aug;6(3):203-8. PubMed PMID: 16045635. [ Links ]
12. Epstein LH, Roemmich JN, Robinson JL, Paluch RA, Winiewicz DD, Fuerch JH, et al. A randomized trial of the effects of reducing television viewing and computer use on body mass index in young children. Arch Pediatr Adolesc Med. 2008 Mar;162(3):239-45.PubMed PMID: 18316661. Epub 2008/03/05. eng. [ Links ]
]]>
13. Costa SM, Horta PM, dos Santos LC. Food advertising and television exposure: influence on eating behavior and nutritional status of children and adolescents. Archivos latinoamericanos de nutricion. 2012 Mar;62(1):53-9. PubMed PMID: 23477208. [ Links ]
14. Ashton D. Food advertising and childhood obesity. Journal of the Royal Society of Medicine. 2004 Feb;97(2):51-2. PubMed PMID: 14749396. Pubmed Central PMCID: 1079287. [ Links ]
15. Roininen K, Tuorila H, Zandstra EH, de Graaf C, Vehkalahti K, Stubenitsky K, et al. Differences in health and taste attitudes and reported behaviour among Finnish, Dutch and British consumers: a cross-national validation of the Health and Taste Attitude Scales (HTAS). Appetite. 2001 Aug;37(1):33-45.PubMed PMID: 11562156.
16. Franchin L, Zobec F, Ghidina M, Stefanini G,Berchialla P, Gregori D. Measuring Brand Awareness in as a Component of Eating Habits in Children: the Development of the IBAI (Italian Brand Awareness Instrument). Progress in Nutrition. 2012;14(2):10.
17. APA. American Psychological Association ethical principles of psychologists and code of conduct 2002 [Retrieved February 9, 2009]. Available from: http://
www.apa.org/ethics/code2002.html. ]]>
18. Zeger SL, Liang KY, Albert PS. Models for longitudinal data: a generalized estimating equation approach.Biometrics. 1988;44:1049-66.
19. Zeger SL, Liang KY. An overview of method for the analysis of longitudinal data. 1992;11:1825-39.
20. R Development Core Team. R: A language and environment for statistical computing. 2008.
21. Kelly B, Halford JC, Boyland EJ, Chapman K,Bautista-Castaño I, Berg C, et al. Television food advertising to children: a global perspective. American Journal of Public Health. 2010;100(9):1730-6.
22. Pellai A, Vetrano S, Nobile M, Luti C. The reverse pyramid: a quali-quantitative study about food advertising inside children’s television programmes. Minerva pediatrica. 2012;64(1):15-26. ]]>
23. Miller SA, Taveras EM, Rifas-Shiman SL, Gillman MW. Association between television viewing and poor diet quality in young children. Int J Pediatr Obes. 2008;3(3):168-76. PubMed PMID: 19086298. Epub 2008/12/17. eng.
24. Hare-Bruun H, Nielsen BM, Kristensen PL, Moller NC, Togo P, Heitmann BL. Television viewing, food preferences, and food habits among children: A prospective epidemiological study. BMC Public Health. 2011;11:311. PubMed PMID: 21569476. Epub 2011/05/17. eng.
25. Francis LA, Birch LL. Does eating during television viewing affect preschool children’s intake? Journal of the American Dietetic Association. 2006 Apr;106(4):598-600. PubMed PMID: 16567158. Pubmed Central PMCID: 2596580. Epub 2006/03/29.eng.
26. Halford JC, Gillespie J, Brown V, Pontin EE, Dovey TM. Effect of television advertisements for foods on food consumption in children. Appetite. 2004 Apr;42(2):221-5. PubMed PMID: 15010186.
27. Halford JC, Boyland EJ, Hughes G, Oliveira LP, Dovey TM. Beyond-brand effect of television (TV) food advertisements/commercials on caloric intake and food choice of 5-7-year-old children. Appetite. 2007 Jul;49(1):263-7. PubMed PMID: 17258351.Epub 2007/01/30. eng. ]]>
28. Anschutz DJ, Engels RC, Van Strien T. Side effects of television food commercials on concurrent nonadvertised sweet snack food intakes in young children. The American journal of clinical nutrition. 2009 May;89(5):1328-33. PubMed PMID: 19321557.
29. Ford C, Ward D, White M. Television viewing associated with adverse dietary outcomes in children ages 2-6. Obesity reviews : an official journal of the International Association for the Study of Obesity. 2012 Dec;13(12):1139-47. PubMed PMID: 22958789. ^rND^sBray^nGA^rND^sLaRosa^nC^rND^sMeyers^nK^rND^sSpruijt-Metz^nD]]> ^rND^sLobstein^nT^rND^sDibb^nS^rND^sEpstein^nLH^rND^sRoemmich^nJN^rND^sRobinson^nJL^rND^sPaluch^nRA^rND^sWiniewicz^nDD^rND^sFuerch^nJH^rND^sCosta^nSM^rND^sHorta^nPM^rND^sdos Santos^nLC^rND^sAshton^nD^rND^nGiulia^sLorenzoni^rND^nNicola^sSoriani^rND^nClaudia Elena^sGafare^rND^nDario^sGregori^rND^nElena^sAcosta^rND^nGiulia^sLorenzoni^rND^nNicola^sSoriani^rND^nClaudia Elena^sGafare^rND^nDario^sGregori^rND^nElena^sAcosta^rND^nGiulia^sLorenzoni^rND^nNicola^sSoriani^rND^nClaudia Elena^sGafare^rND^nDario^sGregori^rND^nElena^sAcosta
Giulia Lorenzoni, Nicola Soriani, Claudia Elena Gafare, Dario Gregori, Elena Acosta
Unit of Biostatistics, Epidemiology and Public Health, Department of Cardiac, Thoracic and Vascular Sciences, University of Padova, Italy. Department of Nutrition, University of Buenos Aires and Food and Diet Therapy Service, Acute General Hospital Juan A. Fernàndez, Buenos Aires, Argentina. Centro de Investigación e Intervenciones en Nutrición Comunitaria (CIINC), Escuela de Nutrición de la Facultad de Ciencias de la Salud, University of Montemorelos, Montemorelos, Nuevo León, Mexico.
SUMMARY: This cross-sectional study aims to investigate food habits, socio-economic status and blood lipids profile in schoolchildren (10-11 years of age) living in a low-income area of Mexico (the city of Montemorelos), characterizing lipid concentrations among children obese and evaluating the impact of socio-economic factors and dietary habits on blood lipids profile of these children. Complete data were available for 156 children (78 boys and 78 girls), food habits and socio economic status were assessed using a questionnaire developed from the one previously used from the enKid study conducted on Spanish children. Food reported in the questionnaire was classified in four food groups (animal source food/legumes, grains/tubers, fruits/vegetables, fats/sweets), beverages were classified separately. Blood samples were analyzed to determine concentrations of: total cholesterol, LDL-cholesterol, HDL-cholesterol, triglycerides, glucose. Children were found to eat fats and sweets more frequently than other food groups. The 59 children, found to be obese and overweight, presented significant higher blood lipid levels (except to glucose levels) than normal weight kids. Using random forests, we found out that food and beverage consumption plays a key role in influencing blood lipids profile in children overweight and obese. Given these observations, it’s crucial to develop health care policies promoting healthy eating habits among schoolchildren taking into account the specific characteristics of this geographical area in Mexico.
Key words: Lipid profile, children, obesity, overweight, meal pattern.
RESUMEN. Los patrones dietéticos en México y la obesidad en los niños. Este estudio transversal tiene como objetivo investigar los hábitos alimentarios, el nivel ]]> socioeconómico y el perfil de lípidos sanguíneos en niños en edad escolar que viven en una zona de bajos recursos en México, caracterizando las concentraciones de lípidos en niños obesos/sobrepeso y evaluar el impacto de los factores socioeconómicos y hábitos dietéticos en el perfil de lípidos de estos niños. Mediante un cuestionario utilizado previamente en el estudio enKid realizado con niños españoles lo realizaron en forma completa 156 niños (78 niños y 78 niñas), se evaluó los hábitos alimentarios y el estado socioeconómico. Los alimentos reportados en el cuestionario se clasifica en cuatro grupos de alimentos (alimentos fuente animal / legumbres, granos / tubérculos, frutas / verduras, grasas / dulces), las bebidas fueron clasificadas por separado. Se analizaron muestras de sangre para determinar las concentraciones de: colesterol total, LDL-colesterol, HDL-colesterol, triglicéridos, glucosa. Los 59 niños, obesos/sobrepeso, presentaron niveles de lípidos en sangre significativamente más altos que los niños de peso normal. Usando Selvas Aleatorias nos enteramos de que los alimentos y el consumo de bebidas juegan un rol clave para influir en el perfil de lípidos en la sangre en niños obesos/sobrepeso. Teniendo en cuenta estas observaciones, es crucial desarrollar políticas de salud que promueven hábitos alimenticios saludables entre los escolares, teniendo en cuenta las características específicas de esta área geográfica en México.
Palabras clave: Perfil lipídico, niños, obesidad, sobre-peso, modelo de comidas.
INTRODUCTION
Investigating factors that influence blood lipid concentrations is of great interest, referring especially to the impact of food habits on biochemical profile. Meal frequency appears to be associated to lipid concentrations: both adults (1, 2) and children (3) who have daily higher meal frequency seem to present better biochemical profile (low levels of total cholesterol and LDL). Breakfast particularly seems to play a key role in influencing blood lipids: adults (4) and children (5) who report to eat breakfast regularly show better biochemical profiles than those who skip breakfast. Referring, more specifically, to the effect of food consumption on lipid profile, junk food consumption among adults is related to higher lipids concentrations (6). In addition, it is demonstrated (7, 8) that children who eat processed food and food containing saturated fat present higher blood lipids concentrations.
Understanding the impact of food habits on blood lipids profile is important, especially in the context of childhood obesity, because several studies (9-12), investigating blood lipid profile among school children, find out higher lipid concentrations among overweight and obese children compared to normal weight ones. Biochemical impairments in children (especially in those overweight/obese) could lead to the early onset of atherosclerotic process and metabolic alterations (impaired glucose tolerance, high concentrations of inflammatory biomarkers) resulting in higher risk of developing cardiovascular and endocrine diseases in early adulthood. Given the increased risk of cardiovascular and metabolic diseases, biochemical alterations in obese children represent a concerning public health burden, worsened by the high prevalence of overweight and obesity in both industrialized and emerging countries: the NHANES investigation (13), conducted between 2011 and 2012 among US population, shows that 34.2% of children (6-11 years of age) were overweight or obese in accordance to CDC growth standards (14) . Similar rates are reported from the ENSANUT survey (15) (conducted among Mexican population in 2012), showing a prevalence of overweight and obesity among Mexican school children (5-11 years of age) of 34.4%.
]]> Therefore it’s crucial to characterize blood lipid profiles among overweight/obese children (especially among Latino ones who seem to be more prone to metabolic impairments compared to other ethnic groups (16)), investigating factors that play a key role in determining lipid concentrations in order to orientate health care
policies.
This study aims to investigate socio-economic characteristics, food habits and blood lipid profile among school children in the city of Montemorelos (a low income living area located in Mexico), characterizing lipid concentrations among overweight/obese children and evaluating the impact of socio-economic features and food habits in influencing lipid profile among these children.
MATERIALS AND METHODS
This cross sectional study is based on data from a survey conducted in school children of 19 school facilities in the city of Montemorelos (Nuovo Leon, Mexico). The aim of the study was to investigate socio-economic characteristics, eating habits, anthropometric data and blood’s lipid profile of the enrolled children. Children were eligible for the study if they attended the fifth school grade (10-11 years of age). Their parents were asked to complete an informed consent document before the enrollment. Complete data were available for 156 children (78 boys and 78 girls). The instrument used for data collection was adapted from the one previously used in the enKid study (17) on Spanish children. Mothers were asked to fill the questionnaire.
Socio-economic characteristics ]]>
Socio-economic characteristics regarded parents’ working status (worker and housewife for mothers, intellectual and manual worker for fathers), educational level (considered as low, referring to primary education, and medium-high, referring to secondary and post-secondary education) and living conditions (house of
property, house for rent or council house)
Eating habits
Eating habits are represented by weekly food consumption, meal frequency, breakfast consumption and mealtime characteristics (distractions at mealtime, with whom children have meals, where children have meals outside home). Food consumption was classified using the three food groups (grains and tubers, fruits and vegetables, animal source food and legumes) indicated from “el Plato del Bien Comer” (established from the official Mexican norm NOM 043-SSA2-2005 (18)).
In order to classify all the food types reported in the questionnaire, we considered a further food group including fats and sweets. The classification is based on the nutritional values of the food included in every food group: fruits and vegetables are a source of vitamins and minerals, diary and animal food source content
proteins, grains and tubers bring carbohydrates and vitamins. Beverages were classified separately from food, including milk, soft drinks, fruit juices, coffee and tea and licuados (a traditional Latin American beverage made of milk and fruit, sometimes added with sugar, honey, oat or ice).
]]> Anthropometric measurements and blood lipid profile
Anthropometric measurements were performed by trained researchers in a room provided by every school facility involved in the study. Height and weight were measured while children were barefoot and wearing light clothes. BMI (Kg/m 2 ) was calculated as weight (kg) divided by height (m) squared. Children were classified to be overweight/obese with a BMI ≥85 percentiles, as recommended by CDC growth standards (14).
Venous blood samples were collected after an overnight fast. The collection of blood samples was performed by three trained laboratory technicians from 7:00 a.m. to 8:00 a.m. in a dedicated room of the same school facilities attended from children enrolled in the study. Blood samples were stored in special containers to maintain proper conditions until the analysis and transported to the laboratory of the “La Carlota” hospital where the biochemical analyses were performed.Glucose, total cholesterol, HDL cholesterol and TAG concentrations were determined using the Reagent Set, Pointe Scientific, Inc. Michigan, U.S.A.
Statistical analyses
Descriptive statistics report continuous data as median [I and III quartiles] and categorical data as percentages (absolute number). The role played by each factor potential influencing the concentration of total cholesterol, HDL, LDL, triglycerides and glucose was estimated using Random Forest, consisting in 500 bootstrap replication of the classification and regression tree. Statistical analyses were performed using R system (19) and random forest library (20).
]]> RESULTS
Sample characteristics are summarized in Table 1. Children attend the fifth school grade (10-11 years of age). Most of children watch television more than 3 hours every day. Regarding eating habits, the number of fats and sweets’ servings per week is higher than the number of servings of animal source food and legumes, grains and tubers, fruits and vegetables. Additionally, children drink the same number of weekly servings of milk and soft drinks. Referring to meal frequency, despite the fact that the majority of children have breakfast every day, most of them are reported to have only 2 meals per day. This could be related to the fact that enrolled children do not have lunch or dinner, but we could also hypothesize that this result depends on a misunderstood meal definition (indicating as an occasion of food consumption) conducting mothers to do not consider breakfast as a meal occasion and counting only lunch and dinner.

However, we do not investigate specifically if children have lunch and dinner every day.In accordance to the CDC growth standards (14), 37.8% of children are overweight or obese. Comparing normal weight and overweight/ obese children (Table 2), we find out significant higher concentrations of total cholesterol, HDL, LDL and triglycerides in children overweight/obese. However, glucose concentration was higher in normal weight children, this probably because blood sugar concentration could depend on other factors above body weight. ]]>
Figures from 1 to 5 show the role played from socio-economic factors and eating habits (sorted from the highest to the lowest score) in influencing concentrations of total cholesterol, HDL, LDL, triglycerides and glucose. Results demonstrate that eating habits, referring to food and beverage consumption particularly,influence blood’s lipid profile the most.

FIGURE 1. Distribution of factors associated with total cholesterol in overweight/obese children.

Animal source food influences both glucose and triglycerides, while the latter is influenced also by fruits and vegetables consumption. The impact of breakfast consumption, meal characteristics and socio-economic factors is less important than food consumption among all the investigated lipid concentrations.

FIGURE 3. Distribution of factors associated with LDL in overweight/obese children.
 ]]>
]]>
FIGURE 4. Distribution of factors associated with triglycerides in overweight/obese children.

FIGURE 5. Distribution of factors associated with glucose in overweight/obese children.

This study is based on a survey conducted in schoolchildren of Montemorelos (a geographical area located in the north of Mexico). It aimed to investigate eating habits, socio-economic status and blood lipid profiles of children living in the city of Montemorelos, characterizing lipid concentrations among normal weight and overweight/obese children and assessing the impact of socio-economic factors and food habits in influencing blood lipid concentrations (total cholesterol, HDL, LDL, triglycerides, glucose) of overweight/obese kids.
Consistently with other studies conducted in US (22) and in Mexican population (23), we found out higher weekly consumption of fats and sweets compared to fruit/vegetables, animal source food/legumes, grains/tubers, despite the efforts of Mexican government to promote an healthy diet based on the consumption of the three food groups recommended from “el Plato del Bien Comer” (10). Additionally, in accordance to CDC growth standards (14), the prevalence of children overweight or obese is 37.8%, which is barely higher than the prevalence of overweight and obesity in Mexican schoolchildren (15) (34.4% among boys and girls from 5 to 11 years old). This higher prevalence of obesity and overweight is probably related to the fact that the living area of Montemorelos presents unique characteristics: the population living in this area is reported from the local health units to be at high risk of chronic and infectious diseases due to low socio-economic status, inadequate eating habits and living conditions. ]]>
Referring to blood lipid concentrations, we found out higher lipid concentrations in children overweight or obese. These results were reported also from other studies (9-12) which demonstrated that obese children present higher lipid concentrations that could lead to early development of atherosclerotic process and of metabolic abnormalities with consequently higher risk of developing complications in early adulthood (cardiovascular and metabolic diseases particularly), highlighting the need of public policies preventing overweight and obesity in childhood.
Investigating the impact of eating habits and socio-economic factors on blood lipid concentrations, we demonstrated the key role of food and beverage consumption in influencing the lipid profile. Other studies (7, 8) showed the importance of food intake in determining high lipid concentrations, founding out especially a significant correlation of processed food and saturated fat consumption with lipoprotein concentrations. Additionally, we found out that also daily meal frequency play a key role in impacting lipoprotein concentrations, especially regarding HDL-cholesterol, in accordance to other studies demonstrating that higher meal frequency is related to better lipid profiles (1-3). However random forest does not specify the type of relationship (positive or negative) between the
influencing factors (eating habits and socio-economic characteristics) and the outcomes (lipid concentrations), this approach shows only the weight of each factor in influencing the outcomes.
CONCLUSIONS
Our study demonstrated a higher prevalence of children overweight or obese compared to Mexican schoolchildren general population, additionally we reported higher blood lipid concentrations among these children, founding out that food and beverage consumption play a key role in influencing lipids profile. From these observations evolved the need of developing health care policies promoting healthy eating habits and physical activity among schoolchildren and their families taking into account the unique characteristics of the population living in this specific geographical area of Mexico.
]]> SOURCE OF FUNDING
The work has been partially supported by an unrestricted grant from the Italian Ministry of Foreign Affairs under the programs “Programmi di alta rilevanza scientifica e tecnologica” Italia-Messico and Italia-Argentina, and from Prochild ONLUS (Italy).
REFERENCES
1. Titan SM, Bingham S, Welch A, Luben R, Oakes S, Day N, et al. Frequency of eating and concentrations of serum cholesterol in the Norfolk population of the European prospective investigation into cancer (EPIC-Norfolk): cross sectional study. BMJ. 2001;323(7324):1286. [ Links ]
2. Smith KJ, Blizzard L, McNaughton SA, Gall SL, Dwyer T, Venn AJ. Daily eating frequency and cardiometabolic risk factors in young Australian adults: cross-sectional analyses. Br J Nutr. 2012;108(6):1086. [ Links ]
]]>
3. Murakami K, Livingstone MBE. Associations of eating frequency with adiposity measures, blood lipid profiles and blood pressure in British children and adolescents. Br J Nutr. 2014;111(12):2176-83. [ Links ]
4. Farshchi HR, Taylor MA, Macdonald IA. Deleterious effects of omitting breakfast on insulin sensitivity and fasting lipid profiles in healthy lean women. Amer J Clin Nutr 2005;81(2):388-96. [ Links ]
5. Freitas Júnior IF, Christofaro DG, Codogno JS, Monteiro PA, Silveira LS, Fernandes RA. The association between skipping breakfast and biochemical variables in sedentary obese children and adolescents. The Journal of pediatrics. 2012;161(5):871-4. [ Links ]
6. Bogl L, Pietiläinen K, Rissanen A, Kangas A, Soininen P, Rose R, et al. Association between habitual dietary intake and lipoprotein subclass profile in healthy young adults. Nutr Metab Cardiovasc Dis. 2013;23(11):1071-8. [ Links ]
7. Rauber F, Campagnolo P, Hoffman D, Vitolo M. Consumption of ultra-processed food products and its effects on children’s lipid profiles: A longitudinal study.Nutr Metab Cardiovasc Dis. 2014.
]]> 8. Rinaldi AEM, de Oliveira EP, Moreto F, Gabriel GFCP, Corrente JE, Burini RC. Dietary intake and blood lipid profile in overweight and obese schoolchildren. BMC
Res Notes. 2012;5(1):598.
9. Friedland O, Nemet D, Gorodnitsky N, Wolach B, Eliakim A. Obesity and lipid profiles in children and adolescents. J Pediatr Endocrinol Metab. 2002;15(7):1011-6. [ Links ]
10. Garcés C, Gutierrez-Guisado J, Benavente M, Cano B, Viturro E, Ortega H, et al. Obesity in Spanish schoolchildren: relationship with lipid profile and insulin resistance. Obes Res. 2005;13(6):959-63. [ Links ]
11. Lima SC, Arrais RF, Almeida MG, Souza ZM, Pedrosa LF. Plasma lipid profile and lipid peroxidation in overweight or obese children and adolescents. J Pediatr
(Rio J). 2004;80(1):23-8.
]]> 12. Maximova K, Kuhle S, Davidson Z, Fung C, Veugelers PJ. Cardiovascular Risk-Factor Profiles of Normal and Overweight Children and Adolescents: Insights
From the Canadian Health Measures Survey. Can J Cardiol. 2013;29(8):976-82.
13. Ogden CL, Carroll MD, Kit BK, Flegal KM. Prevalence of childhood and adult obesity in the United States, 2011-2012. JAMA. 2014;311(8):806-14. [ Links ]
14. Kuczmarski RJ, Ogden CL, Grummer-Strawn LM, Flegal KM, Guo SS, Wei R, et al. CDC growth charts: United States. Adv Data. 2000(314):1-27. [ Links ]
15. Gutierrez JP, Rivera-Dommarco J, Shamah-Levy T, Villalpando-Hernández S, Franco A, Cuevas-Nasu L, et al. Encuesta nacional de salud y nutrición 2012. Resultados Nacionales Cuernavaca, México: Instituto Nacional de Salud Pública. 2012. [ Links ]
16. Davis JN, Ventura EE, Weigensberg MJ, Ball GD, Cruz ML, Shaibi GQ, et al. The relation of sugar intake to β cell function in overweight Latino children.Amer J Clin Nutr. 2005;82(5):1004-10. ]]>
17. Serra-Majem L, García-Closas R, Ribas L, Pérez-Rodrigo C, Aranceta J. Food patterns of Spanish schoolchildren and adolescents: The enKid Study.Public Health Nutr. 2001;4(6a):1433-8. [ Links ]
18. Norma Oficial Mexicana: NOM-043-SSA2-2005, Servicios básicos de salud. Promoción y educación para la salud en materia alimentaria. Criterios para brindar orientación. [ Links ]
19. Team RC. R: A language and environment for statistical computing. R Foundation for Statistical Computing, Vienna, Austria. 2013. ISBN 3-900051-07-0; 2014. [ Links ]
20. Liaw A, Wiener M. Classification and Regression by randomForest. R news. 2002;2(3):18-22. [ Links ]
21. Rivera JA, Muñoz-Hernández O, Rosas-Peralta M, Aguilar-Salinas CA, Popkin BM, Willett WC. Consumo de bebidas para una vida saludable: recomendaciones para la población mexicana. Bol Med Hosp Infant Mex. 2008;65(3):208-37. [ Links ]
22. Munoz KA, Krebs-Smith SM, Ballard-Barbash R, Cleveland LE. Food intakes of US children and adolescents compared with recommendations. Pediatrics. 1997;100(3):323-9. [ Links ]
23. Jiménez-Cruz A, Bacardı́-Gascón M, Jones EG. Consumption of fruits, vegetables, soft drinks, and high-fat-containing snacks among Mexican children on the Mexico-US border. Arch Med Res. 2002;33(1):74-80.
Tatjana Brankov, Slavica Zec, Claudia Elena Gafare, Dario Gregori, Koviljko Lovre
Faculty of Economics Subotica, University of Novi Sad (Serbia). Unit of Biostatistics, Epidemiology and Public Health, Department of Cardiac, Thoracic and Vascular Sciences, University of Padova (Italy). Department of Nutrition, University of Buenos Aires and Food and Diet Therapy Service, Acute General
Hospital Juan A. Fernàndez, Buenos Aires, Argentina.
SUMMARY: The objective of this study was to evaluate the relationship between dietary pattern and incidence of nutrition-related non-communicable diseases in Serbia, a country which has experienced a significant shift in nutrition and lifestyle habits, guided by its particular historical background and its rapid transition to liberal economy. Data was collected from annual reports published by the Statistical Office of the Republic of Serbia and the Institute of Public Health. It provides a focus on the timeframe of 1997-2014, in order to capture any changing pattern after the year 2000, in which the process of complete trade liberalization started.The results have shown a striking growing trend in both disease incidence on the one hand and processed food items such as processed meat, fruit juices, chocolate and biscuits and on the other hand. Granger causality test suggests that there exists causality that goes beyond spurious relationship between the disease of blood and blood-forming organs and immune system disorders and average per capita consumption of fruit and vegetables, poultry, processed meat, chocolates and biscuits and fruit juices. Also, we find evidence of long-term relationship between fish consumption and endocrine, metabolic and digestive diseases.
Key words: Food pattern, disease incidence, economy liberalization, processed food.
]]> RESUMEN. La interacción a largo plazo entre los hábitos alimentarios y la incidencia de enfermedades: La evidencia de Serbia. El objetivo de este estudio fue evaluar la relación entre los patrones de dieta y la incidencia de las enfermedades no transmisibles relacionadas con la nutrición en Serbia, un país que ha experimentado un cambio significativo en los hábitos de nutrición y estilo de vida, guiado por sus antecedentes históricos particulares y su rápida transición hacia una economía liberal. Se recogieron datos de los informes anuales publicados por la Oficina de Estadística de la República de Serbia y el Instituto de Salud Pública. Se hizo foco en el período de 1997 a 2014, con el fin de poder detectar cualquier cambio en los patrones a partir del año 2000, cuando comenzó el proceso de liberalización total del comercio. Los resultados han mostrado llamativamente una tendencia creciente tanto en la incidencia de enfermedades como en la proliferación de alimentos procesados, tales como carne procesada, jugos de frutas, chocolate y galletas. La prueba de causalidad de Granger sugiere que existe una relación de causalidad que va más allá de la relación espuria entre las enfermedades hematológicas, las afecciones de los órganos hematopoyéticos y del sistema inmunológico y el consumo promedio per cápita de frutas y hortalizas, productos avícolas, carne procesada, chocolates, galletas y jugos de frutas. Parece evidente también la existencia de una relación a largo plazo entre la aparición de enfermedades endocrinas, metabólicas y digestivas y el consumo de pescado.
Palabras clave: Patrones alimentarios, incidencia de la enfermedad, liberalización de la economía, alimentos procesados.
INTRODUCTION
Nutritional pattern, commonly defined as a “Western diet”, is typically characterized by high intake of refined carbohydrates, added sugars, fats and animal-source foods on the one hand and low intake of legumes and coarse grains, on the other (1). It strongly influenced many traditional food and cuisine (1), and become a feature of modern dietary patterns in many low and middle-income countries (2). Food pattern modifications rose with new technology development and diffusion, income growth and retail globalization (1,3).
Commercial interactions between nations affect food chain through leveraging the importance of import, allow a global spread of supermarkets (thanks to the Foreign Direct Investments) and contribute to evolution of preferences and cultural expectations of population via commercial promotion of food (4). New technologies, among other things, contributed to a worldwide increase in use of caloric sweeteners and vegetable oils such as soybean, sunflower, rapeseed, palm and groundnut oil (2–5). Individual intake of inexpensive vegetable oils increased threefold to six fold throughout the developing world (1).Furthermore, the increase in per-capita income,together with population growth and progressive urbanization is highly correlated with “livestock revolution”, resulting in an unprecedented growth in demand for food of animal origin in developing countries (6) as well as consumption of a more processed food (1,7). Retailing globalization, with an enormous impact on the market structure in transition and developing countries (8,9), provides access to many new empty calorie foods and beverages and reduces the intake of fresh food, which represents an important source of nutrition.
]]> Different studies have discussed potential adverse effect of the penetration of transnational food and drink companies on public health in developing and developed countries (10, 11). A displacement of traditional food systems has the potential to undermine public health more in low and middle income countries than in high-income countries, which already industrialized their dietary patterns (3). The dietary changes are very rapid and most probably will continue to evolve without suitable policy intervention (12–15). “Nutrition transition” occurs concomitantly with two remarkable processes: demographic transition and epidemiological transition related to urban-industrial lifestyles. This results in an increased prevalence of obesity and contributes to the incidence of chronic and degenerative diseases (2). Now, nutrition-related non-communicable diseases (NCDs), most particularly cardiovascular disease (CVD) and some types of cancer, replaced previously dominant transmissible diseases in low and middle income countries.CVDs constitute the largest cause of mortality,representing 31% of all global deaths in 2012 (16). Over three quarters of CVD deaths take place in low and middle income countries affecting a nation’s economic development through
loss of income and the high cost of medical care (17).“Western diet” nutritional patterns,as well as frequent consumption of processed and ultra-processed food,promote obesity, metabolic syndrome, CVDs and, most probably, favor autoimmune diseases (18).
However, Serbia is a very particular case of middle-income country: it is one of the transition economies in Central and Southeastern Europe (CEEs), whose system rapidly switched from planned to market economy after the 1990’s. In pre-transitional era only a limited range of food items were available, but due to low food prices and significant state agriculture subsidies, the typical diet found in these countries had features of high-income diets: a significant consumption
of livestock products (19). Since the grain production was highly subsidized, bread was often used to feed livestock in small farms (20).Also, public health expenditures (as a percentage of GDP), was significantly higher in socialist countries than in most middle-income countries (20).
The biggest hyperinflation after World War II that has hit Serbia in the 1990s, gray economy, civil war, an influx of about one million refugees, international economic sanction – are all factors that contributed halving the size of the Serbian economy with respect to the early 1990s. (21). Despite severe economic difficulties, Serbia has preserved its strong agricultural basis as it has historically been an important agricultural producer for both domestic and export market (19). Furthermore, there is a strong culinary tradition and efforts to preserve traditional food products and food cuisine (22).
Taking into account abrupt changes which occurred upon opening of the borders for competitive import, reduction of agricultural subsidies and shrinking of value added in agriculture, deterioration of social safety nets, (20) it is no wonder that important changes were experienced in terms of prevalent dietary patterns. It is interesting to notice that the evolution in food consumption did not concern the expansion of food quantity in a measure in which it concerned the diversification of available food items (20).
]]> It is believed that Serbian population has been heavily affected by wars, disintegration and political crisis, resulting in an increased mortality from cancer and ischemic heart disease during the past two decades (23, 24). Since the 1990s, NCDs have represented a major cause of death, where cardiovascular diseases are the top ranked, followed by cancers (25). Dietary risk, along with tobacco smoking and high blood pressure, account for the most of the disease burden (26). Aging population and high burden of NCD mortality resulted in a continuously increasing crude death rate, which reached 13.97% in 2008. According to the national health survey in 2006, 54.5% of adult population were overweight and 18% children aged 7–18 were at least moderately obese. Only 23% of adult population reported undertaking physical activity on daily basis, with 67% of adults being physically inactive (27). The aim of this paper is to provide consistent evidence about the long term relationship between dietary pattern and incidence of NCDs, in a very particular setting of Serbia which has undergone one of the most unstable transition experience in the CEEs.
Our literature review did not show many articles interested in the in analyses of long-term relationship between dietary pattern and disease incidents (28–30) To the best of our knowledge, this study is the first to document a significant shift in dietary pattern, and addresses the relationship between food consumption and incidence of broad categories of non-communicable diseases.
MATERIALS AND METHODS
Data collection
Time series data about average per-capita food consumption is taken from the Statistical Office of the Republic of Serbia (31). Yearly data on diagnosed disease incidence was taken from the Institute of Public Health of Serbia “Dr Milan Jovanovic Batut” (32). Diseases, conditions and injuries in primary health service, provided by state-owned primary health centers are presented in uniform lists in accordance with the International Classification of Diseases – 10th Revisions (33). We have analyzed four groups of diseases: diseases of the blood and blood-forming organs and certain disorders involving the immune mechanism (D50-D89), diseases of the circulatory system (I00-I99), endocrine, nutritional and metabolic diseases (E00-E90) and diseases of the digestive system (K00-K93) (Table 1).
We have selected relevant food categories that constitute a typical household diet, aggregating over certain food items. The categories are bread and paste products, fresh fruit and vegetables, milk products (fresh and fermented), red meat (beef, pork and goat), processed meat (dried bacon, dried meat boneless, dried meat with bones, salami and sausages all kinds, hot dogs, etc.), fish, poultry, fruit juices, processed snack food (sweets and biscuits) and total fat. The data refers to the time frame of 1997-2014. We chose this period to evaluate the changes after the year 2000, the year of economy “opening”, which can be considered as the year when the process of complete trade liberalization started.
]]>

The conclusion relates to the “opening” of the economy since 2000 relating to the completely closed economy until then. After parliamentary elections in December 2000, the EU lifts tariffs on import of goods from Federal Republic Yugoslavia (The Republics of Serbia and Montenegro together established a federation in 1992) and the prospect of a Stabilization and Association Process was settled, in accordance with decisions of the EU Council (34). This has exposed agricultural producers to the increasing international trade competition. Besides this, Serbia has the signed Central European Free Trade Agreement (CEFTA)- agreements on free trade with the CEFTA countries, as well as free trade agreements with Russia, Turkey and Belarus. As a consequence, the aggregate supply of agricultural and food products has exceeded the demand in the period after the 2000 (35).
Statistical analysis
Multivariate time series analysis was conducted using as a reference standard cointegration approach. Pearson correlation coefficient and generalized regression modeling were used as a starting point, to underline problem of spurious relationship between the time series. Dickey- Fuller test was used to confirm level non- stationarity of the series, which can be visualized through graphical inspection (see Figure 1 and Figure 2). The order of the integration was determined using Kwiatkowski–Phillips–Schmidt–Shin (KPSS) tests, where the null hypothesis was that an observable time series is trend stationary against the alternative of a unit root (36). Since we have found that most series are of order 1, we have used a bivariate multivariate time series approach to establish long run relationship between the food pattern and disease. In particular, Granger causality test was used determine whether the lagged dietary pattern provide statistically significant information about the current values of outcomes (37). ]]>
RESULTS
There is an evident growing trend in both disease incidence and food items such as processed meat, fruit juices and chocolate and biscuits in the observed period (see Figure 1 and Figure 2). Most notably, endocrine, nutritional and metabolic diseases (E00-E90) incidence rates have almost quintupled from 0.02 in 1997 to more than 0.09 in 2014. Circulatory diseases (I00-I99) have doubled from 0.15 to more than 0.30. Prevalence of blood forming and autoimmune diseases (D50-D89) and diseases of the digestive system (K00-K93) has also increased for 58% and 26%, respectively. In relation to food consumption, the highest growth can be observed in the consumption of fruit juices, and chocolate and biscuits, 9.3 and 6.6 times, respectively. Processed meat consumption has increased almost 2.5 times.
Regarding fresh meat, the largest increase in total consumption is recorded for chicken (about 45%). The consumption of individual edible oil, fresh fruits and vegetables and total fish had also increased for 38%, 18%, and 32%, respectively. In the same period of time, consumption of fresh milk and yogurt has decreased by 23%. Similar declining trend can be noticed in consumption of bakery and paste
products.

FIGURE 2.Serbian trends in dietary patterns (average quantity consumed annually per household member on y axis)

Preliminary descriptive (graphically represented Pearson coefficient) suggest that there is strong interdependency between the dietary patterns and the annual incidence of non-communicable diseases (see Figure 3). Bread and paste products and milk products and fermented derivatives seem to have a risk-protective relationship with all the four disease groups. Fruit juices, processed snack good (defined as sweets and biscuits) and processed meat seems to be strongly positively correlated with the disease incidence.However, since unit root test confirms that the series are not stationary, the assumptions behind standard linear modeling can be violated, hence the correlations shown in Figure 3 might be misleading.
In order to investigate the nature of stationarity of the series, we have performed KPSS tests on each series (see Table 2). Non-significant p-value (with p>0.05) means that the series is stationary around a deterministic (increasing or decreasing) trend. The lag order refers to the order of integration of the series.
]]> FIGURE 3. Pearson Correlation coefficient between the diseases and food pattern.

What we find is that, among all, only several time series (bread and pastry products, fish and red meat) are trend stationary. This means that they remain stable around the deterministic trend and are hardly influenced by external shocks. All other series are “shock sensitive”, meaning that any external shock (an event that has impact on the time series) permanently affects the series. In each case (trend stationary or integrated time series), standard assumptions for linear modeling fail, hence an alternative approach for testing the association between the dietary pattern and disease incidence is necessary.
Table 3 presents a more rigorous statistical testing using Granger causality test for long run relationship between the variables. Significant p-value means that the past values of the independent variable (diet) are significant in predicting dependent variable (disease) up to the lag indicated in the brackets. This test suggests that there exists causality between the disease of blood and blood-forming organs and certain disorders involving the immune mechanism (D50-D89) and average consumption of fruit and vegetables (p= 0.03), poultry (p=0.02), processed meat (p=0.02) sweets and biscuits (p=0.04) and fruit juices (p=0.03). The same test suggests causality between both endocrine, nutritional and metabolic diseases (E00-E90) and diseases of the digestive system (K00-K93) (p=0.05 and p=0.04, respectively) and fish consumption. We found no significant relation between diseases of the circulatory system (I00-I99) and specified food items.
 ]]>
]]>
TABLE 3. Bivariate Granger causality (significant p-value and lag in the parenthesis)

DISCUSSION
Serbian background
Road border changes, wars, coexistence of different nations resulted in very heterogeneous cuisine. Traditional Serbian cuisine is based on Slavic traditions with strong Mediterranean (Byzantine/Greek), Oriental (Turkish) and Hungarian influences (38). Many food items such as relish from bell peppers or eggplant, jams, jellies, pickled food, sausages, clotted cream, yogurts, syrupy fruit conserve as well as fruit brandy are homemade. The Serbian diet is traditionally heavy on grilled meat, sausages, local cheeses and bread. There are a number of local dishes which highlight this, such as pljeskavica (mixture of lamb or pork and beef, grilled with onions and served hot on fresh bread) and rostilj (various unseasoned grilled meat and can include chicken wrapped in bacon and stuffed with cheese). In recent years, bakeries can be found everywhere in Serbia and cater to the food to go aspect of life (39).
After the Second World War, new Yugoslavian agricultural policy (development of social farms, new approach to cooperatives, stimulation of personal labor, price investments) has resulted in a very rapid growth of agricultural production. In the period 1957-1980 the group activities, directly dependent on the production of raw materials have recorded extremely rapid development. The food industry (meat, fruit and vegetables processing as well as milk preserving and drink production) overshadowed the food processing in households. Rapid supply growth was registered for bread grains, fats, fruits, sugar, ready to eat meals and drink (40). The share of the agricultural population, total and active, decreased in the period 1948 -1980 from 67 or 73% to only 29 or 38% (41). These very fast socio-economic changes in Yugoslavia had a significant impact on food patterns causing consumption growth of finished and semi-finished products(38). ]]>
After a period of economic and political uncertainty (1990-2000) Serbia started new era of “democratic changes”, the process of complete trade liberalization started, the growth of GDP began and urbanization brought changes in lifestyle. All these elements resulted in changes in food habits of the population. One theory states that a key constituent is penetration of modern supermarkets (42). After the privatization of the retail sector and the establishing of the first supermarket chains, this region faced an inflow of foreign supermarket chains: Belgian Delhaize Group, German Metro Group, French Intermarché, Slovenian Mercator and the Croatian Agrokor. Slovenian chain Mercator as well as Veropulus Super Market Group (Super Vero) opened its first hypermarket in Belgrade in 2002. Intermarché has been present in Serbia through local brand Interex since 2004 when it opened its first supermarket. Idea (Agrokor Group) and Metro Cash&Carry are retails chain with a constant market share growth since 2005, when the first store was opened in Belgrade.Socio-economic conditions and population health are inextricably linked, and strongly interdependent(32) and Serbia has been a rather good example to confirm this theory. In parallel with ‘westernization’ process of food habits (43) Serbia has experienced the general deterioration of public health (44). Adulthood obesity prevalence forecasts (2010–2030) predict that in 2020, 44% of men and 31% of women will be obese (45). Top three causes of death in the period 2000-2012 were CVDs: stroke, cardiomyopathy- myocarditis and ischaemic heart disease (31,46). One study has shown the markedly increasing trends in mortality rates from ischemic heart disease in man during 1991-2010 periods (30).
Public Health Nutrition Implications
Disease yearly incidence rate trend graphs (Figure 1) show some striking evidence about the increase in all the considered groups of diseases. While circulatory diseases incidence rates have doubled, metabolic and endocrine diseases have almost quintupled. Even digestive and blood forming and immune diseases show an upward trend, although less systematic and more disperse around the mean. The evolution of cardiovascular disease trends in Serbia is in line with several eastern European countries, notably Russian federation, where CVDs mortality remains high (47). Trends regarding endocrine, metabolic and nutritional diseases are coherent with trends in many countries, especially if we consider overweight, obesity and diabetes which become a global health challenge (48).
Like in the developing world, where diets are shifting rapidly and going to high consumption of fat, sweets, animal source food and processed food (2,14), similar trend is observed in Serbia. The evolution of dietary patterns in general is also in accordance with Mediterranean countries, such as Greece where consumption of animal fats and high-calorie foods is increasing(49). In the 18 period time frames it appears that the Serbian population has evolved its preferences (on average) towards certain food items: there is an important increase in consumption of poultry, processed meat, chocolate and biscuits, fruit juices and edible oils. This means that despite the efforts to preserve culinary heritage (majority of consumers eat at home and like cooking) and traditional food as a response to modernization processes (22,50) Serbia did not resist changes that are happening in the rest of the world.
From 2002 to 2003 there has been a structural break, driven by opening new hypermarket stores (Mercator, Super Vero and Univerexport) in 2002 and huge increase in per capita gross national income (GNI) from USD 1.590 in 2002 to USD 2.130 in 2003 (51). This has fostered a significant shift in consumption of these goods, and can be observed in our data (see Figure 2). Upward trends are present, although less striking, in red meat, fish, eggs and fruit and vegetable ]]> consumption. On the contrary, downward trend brought milk products from 95 l per capita to 75 l per capita. Similar trend occurred in bakery and paste products consumption.
Since the dietary pattern and disease incidence rate move together in parallel, descriptive evidence does suggest that there is strong relationship between the consumption of certain food items and disease insurgence. However, claiming causality in these type of studies is overly ambitious tasks, especially for the fact that in the multivariate time series context, testing for linear relationship between the variables might lead to erroneous results due to spurious relationship problem. However, long-term causality test has confirmed causality between the certain diseases, especially blood forming diseases, and a range of food items (processed meat, junk food, fruit and vegetable, etc.). However, these results should be interpreted overall, as a descriptive evidence of a trend in dietary pattern which had both strong trend and structural break and lead to non-ignorable consequences in disease incidence.
Most probably, dietary modifications should form the ground for action for all four group diseases prevention. To find ways to push people to change their dietary habits into more a healthy diet is the challenge for coming years for national competent authorities (52). This going to be particularly difficult in Serbia since there is an insufficient involvement of the state regarding adoption of national dietary guidelines (53).
CONClUSIONS
National statistical data provides striking evidence about the ”Nutrition transition”, in particular the shift in consumption of processed food items such as processed meat, fruit juices, chocolate and biscuits. Our results indicate that this dietary transition represents one strong potential driver of chronic conditions. The analysis shows strong evidence of correlation between consumption of certain food items and blood forming disease, although a more detailed data would probably allow for a clearer identification of causal patterns and long-run interactions.
]]> Although this represents a rather descriptive study of a very complex phenomena, to the extent of our knowledge, it is the first study to address the issue of long-term associations between the shift in diet orientation and chronical conditions in Serbia. As described, Serbia represents a very unusual context where it would be particularly relevant to broaden the knowledge in the field of nutrition-related morbidity. Lack of consistant academic programs in nutrition and national
dietary guidelines represent important obstacles to building an efficient food and health system, which would ensure strengthening the population resilience to nutritional risks.
Monitoring of the situation is extremely important, since it represents the stepping stone for evidence-based action, necessary to tackle the burden in terms of public health cost. Longitudinal country-level data allows for general monitoring of the evolution of dietary habits and disease epidemiology, however only individual level data would allow for further inspection of the mechanisms through which policy action and nutrition yields health effects.
REFERENCES
1. Popkin BM, Adair LS, Ng SW, Popkin B, Drewnowski A, Popkin B, et al. Global nutrition transition and the pandemic of obesity in developing countries. Nutr Rev
[Internet]. The Oxford University Press; 2012 Jan.
]]>
2. Popkin BM, Gordon-Larsen P. The nutrition transition:worldwide obesity dynamics and their determinants.Int J Obes [Internet]. Nature Publishing Group; 2004 Nov. [ Links ]
3. Monteiro CA, Cannon G, Castells M, Yach D, Feldman Z, Bradley D, et al. The Impact of Transnational “Big Food” Companies on the South: A View from Brazil.
PLoS Med [Internet]. Public Library of Science; 2012 Jul 3.
4. Rayner G, Hawkes C, Lang T, Bello W. Trade liberalization and the diet transition: a public health response. Health Promot Int [Internet]. Oxford University Press; 2006 Dec 1. [ Links ]
5. Popkin BM, Nielsen SJ. The Sweetening of the World’s Diet. Obes Res [Internet]. Blackwell Publishing Ltd;2003 Nov.
6. Pica-Ciamarra U, Otte J. The “Livestock Revolution”:rhetoric and reality. IP Publishing Ltd;7. Delgado CL. Rising consumption of meat and milk in developing countries has created a new food revolution. J Nutr [Internet]. American Society for Nutrition; 2003 Nov. ]]>
8. Currah A, Wrigley N. Networks of organizational learning and adaptation in retail TNCs. Glob Networks [Internet]. Blackwell Publishing Ltd.; 2004 Jan. [ Links ]
9. Wrigley N, Coe NM, Currah A. Globalizing retail: conceptualizing the distribution-based transnational corporation (TNC). Prog Hum Geogr [Internet]. SAGE Publications; 2005 Aug 1. [ Links ]
10. Monteiro CA, Gomes FS, Cannon G. The Snack Attack. Am J Public Health [Internet]. American Public Health Association; 2010 Jun. [ Links ]
11. Monteiro CA. The big issue is ultra-processing. In praise of the shared meal.[Commentary]. J World Public Heal Nutr Assoc. 2011;5:235–46.
12. Popkin BM. The shift in stages of the nutrition transition in the developing world differs from past experiences!. [ Links ]
13. Stuckler D, McKee M, Ebrahim S, Basu S. Manufacturing epidemics: the role of global producers in increased consumption of unhealthy commodities including processed foods, alcohol, and tobacco. PLoS Med. Public Library of Science; 2012;9(6):e1001235. [ Links ]
14. Monteiro CA, Moubarac J, Cannon G, Ng SW, Popkin B. Ultra-processed products are becoming dominant in the global food system. Obes Rev. Wiley Online
Library; 2013;14(S2):21–8.
15. Baker P, Friel S. Processed foods and the nutrition transition: evidence from Asia. Obes Rev. Wiley Online Library; 2014;15(7):564–77.
16. WHO. Fact Sheets, Cardiovascular Diseases [Internet]. Available from: http://www.who.int/mediacentre/factsheets/fs317/en/ [ Links ]
]]> 17. Strong K, Mathers C, Epping-Jordan J, Beaglehole R. Preventing chronic disease: a priority for global health. Int J Epidemiol. IEA; 2006;35(2):492–4.
18. Manzel A, Muller DN, Hafler DA, Erdman SE, Linker RA, Kleinewietfeld M. Role of “Western diet” in inflammatory autoimmune diseases. Curr Allergy Asthma Rep. Springer; 2014;14(1):1–8.
19. Rask K, Rask N. Reaching Turning Points in Economic Transition: Adjustments to Distortions in the Supply and Demand for Food. 2002. [ Links ]
20. Wehrheim P, Wiesmann D. Food security analysis and policies for transition countries. Electron J Agric Dev Econ. 2006;3(2):112–43.
21. Lovre K, Brankov T. Multiple sustainability dimensions of retail sector in Serbia until 2013. Industrija. 2016;44(1):133–49.
]]> 22. Giraud G, Amblard C, Thiel E, Zaouche-Laniau M, Stojanović Ž, Pohar J, et al. A cross-cultural segmentation of western Balkan consumers: focus on preferences toward traditional fresh cow cheese. J Sci Food Agric. Wiley Online Library; 2013;93(14):3464–72.
23. Marković-Denić L, Vlajinac H, Zivković S, Miljus D. Cancer mortality among men in Central Serbia: 1985-2006 survey study. Croat Med J [Internet]. Medicinska Naklada; 2008 Dec. [ Links ]
24. Vujcic IS, Sipetic SB, Dubljanin ES, Vlajinac HD, Bajekal M, Scholes S, et al. Trends in mortality rates from coronary heart disease in Belgrade (Serbia) during the period 1990–2010: a joinpoint regression analysis. BMC Cardiovasc Disord [Internet]. BioMed Central; 2013 Dec 9.
25. WHO. Open Health for All Database (HFA database) [Internet]. 2015. Available from: http://data.euro.who.int/hfadb/. [ Links ]
27. HPI. Serbia: Brief health system review [Internet]. Analyses. 2014. Available from: http://www.hpi.sk/en/2014/01/serbia-brief-health-system-review/. [ Links ]
28. Menotti A, Kromhout D, Blackburn H, Fidanza F,Buzina R, Nissinen A. Food intake patterns and 25-year mortality from coronary heart disease: cross-cultural correlations in the Seven Countries Study. Eur J Epidemiol. Springer; 1999;15(6):507–15.
29. Papandreou C, Tuomilehto H. Coronary heart disease mortality in relation to dietary, lifestyle and biochemical risk factors in the countries of the Seven
Countries Study: a secondary dataset analysis. J Hum Nutr Diet. Wiley Online Library; 2014;27(2):168–75.
30. Ilic M, Ilic I, Stojanovic G, Zivanovic-Macuzic I. Association of the consumption of common food groups and beverages with mortality from cancer, ischaemic ]]> heart disease and diabetes mellitus in Serbia, 1991–2010: an ecological study. BMJ Open. British Medical Journal Publishing Group; 2016;6(1):e008742.
31. Serbia. SO of the R of. Demographic Yearbook in the Republic of Serbia, 1991–2010. 2011.
32. Batut. Rezultati istrazivanja zdravlja stanovnistva Srbije 2013. godina. 2014. [ Links ]
33. WHO. International Classification of Diseases and Related Health Problems 10th revision [Internet]. p. 1997–2014. Available from: http://apps.who.int/classifications/apps/icd/icd10online2006/
34. Ioniţă D. Serbia’S Eu Path: Beyond The Complexity Of An Institutional Process. Europolity. 2015;9(2):47–81.
]]> 35. Lovre K. Policy of support to agriculture and rural development. Agri-food Sect Serbia state challenges. Serbian Association of Agricultural Economics;2013;233–58.
36. Kwiatkowski D, Phillips PCB, Schmidt P, Shin Y. Testing the null hypothesis of stationarity against the alternative of a unit root: How sure are we that economic time series have a unit root? J Econom. Elsevier; 1992;54(1–3):159–78.
37. Gujarati DN. Basic econometrics, Causality in Economics: The Granger Causality Test. Tata McGraw-Hill Education; 2009. 652–658 p.
38. Muhi B, Jovanovic D V, Ostojic G. Historical Flows as the Most Significant Influence of Evolution of Serbian Gastronomy. БНТУ; 2015. [ Links ]
39. Bord Bia. Serbian Market Overview [Internet].2002. Available from: http://www.bordbia.ie/industry/events/SpeakerPresentations/2008/FoodDrinksIndustryDayCountryOverviews/SerbiaMarket Overview.pdf. [ Links ]
]]>
40. Dunđerov M, Trkulja M, Gajić M, Lovre K. Agrarna politika Jugoslavije i razvoj agroindustrijskog kompleksa. Ekonomski fakultet, Poljoprivredni fakultet, Subotica, Novi Sad; 1983. [ Links ]
41. SZS. Trideset godina samoupravnog razvoja Jugoslavije 1950-1980. Beograd; 1981. [ Links ]
42. Lovre K, Brankov TP. The Supermarket Revolution in the Balkan Countries: The Case of Serbia. Agroecon Croat. Croatian Society of Agricultural Economists; 2015;5(1). [ Links ]
43. Vareiro D, Bach-Faig A, Quintana BR, Bertomeu I, Buckland G, de Almeida MDV, et al. Availability of Mediterranean and non-Mediterranean foods during the last four decades: comparison of several geographical areas. Public Health Nutr. Cambridge Univ Press; 2009;12(9A):1667–75.
44. Kunitz SJ. The making and breaking of Yugoslavia and its impact on health. Am J Public Health. American Public Health Association; 2004;94(11):1894–904.
]]>
45. WHO. Nutrition, Physical Activity and Obesity Serbia [Internet]. 2013. Available from: http://www.euro.who.int/__data/assets/pdf_file/0017/243323/Serbia-WHO-Country-Profile.pdf?ua=1. [ Links ]
46. WHO. European Health for All Database (HFA-DB) [Internet]. 2015. Available from: http://data.euro.who.int/hfadb/. [ Links ]
47. Levi F, Chatenoud L, Bertuccio P, Lucchini F, Negri E, La Vecchia C. Mortality from cardiovascular and cerebrovascular diseases in Europe and other areas of
the world: an update. Eur J Cardiovasc Prev Rehabil. SAGE Publications; 2009;16(3):333–50.
48. Danaei G, Finucane MM, Lu Y, Singh GM, Cowan MJ, Paciorek CJ, et al. National, regional, and global trends in fasting plasma glucose and diabetes prevalence since 1980: systematic analysis of health examination surveys and epidemiological studies with 370 country-years and 2• 7 million participants. Lancet. Elsevier; 2011;378(9785):31–40.
49. Ezzati M, Riboli E. Behavioral and dietary risk factors for non communicable diseases. N Engl J Med. Mass Medical Soc; 2013;369(10):954–64. ]]>
50. Barjolle D, Brecic R, Cerjak M, Giraud G. Traditional Food in Western Balkan Countries Consumers’ Perceptions and Habits. In: European Association of Agricultural Economists. 2015.
51. FAO. Food retail. Agribusiness Handbook [Internet]. 2009. Available from: http://www.fao.org/fileadmin/user_upload/tci/docs/AH4-Food/ [ Links ]
52. Perk J, De Backer G, Gohlke H, Graham I, Reiner Ž, Verschuren M, et al. European Guidelines on cardiovascular disease prevention in clinical practice (version 2012). Eur Heart J. Eur Soc Cardiology; 2012;33(13):1635–701.
53. Brankov TP, Milovanovic M. Measuring food security in the republic of Serbia 1 2. Ekon Poljopr. Balkan Scientific Association of Agricultural Economists; 2015;62(3):801. [ Links ]^rND^sPopkin^nBM^rND^sGordon-Larsen^nP^rND^sPica-Ciamarra^nU^rND^sOtte^nJ]]> ^rND^sStuckler^nD^rND^sMcKee^nM^rND^sEbrahim^nS^rND^sBasu^nS^rND^sMonteiro^nCA^rND^sMoubarac^nJ^rND^sCannon^nG^rND^sNg^nSW^rND^sPopkin^nB^rND^sBaker^nP^rND^sFriel^nS^rND^sStrong^nK^rND^sMathers^nC^rND^sEpping-Jordan^nJ^rND^sBeaglehole^nR^rND^sManzel^nA^rND^sMuller^nDN^rND^sHafler^nDA^rND^sErdman^nSE^rND^sLinker^nRA^rND^sKleinewietfeld^nM^rND^sWehrheim^nP^rND^sWiesmann^nD^rND^sLovre^nK^rND^sBrankov^nT^rND^sGiraud^nG^rND^sAmblard^nC^rND^sThiel^nE^rND^sZaouche-Laniau^nM^rND^sStojanovi^nŽ^rND^sPohar^nJ^rND^sMenotti^nA^rND^sKromhout^nD^rND^sBlackburn^nH^rND^sFidanza^nF^rND^sBuzina^nR^rND^sNissinen^nA^rND^sPapandreou^nC^rND^sTuomilehto^nH^rND^sIlic^nM^rND^sIlic^nI^rND^sStojanovic^nG^rND^sZivanovic-Macuzic^nI]]> ^rND^sIoni^nD^rND^sKwiatkowski^nD^rND^sPhillips^nPCB^rND^sSchmidt^nP]]> ^rND^sLovre^nK^rND^sBrankov^nTP^rND^sVareiro^nD^rND^sBach-Faig^nA^rND^sQuintana^nBR^rND^sBertomeu^nI^rND^sBuckland^nG^rND^sde Almeida^nMDV^rND^sKunitz^nSJ^rND^sLevi^nF^rND^sChatenoud^nL^rND^sBertuccio^nP^rND^sLucchini^nF^rND^sNegri^nE^rND^sLa Vecchia^nC^rND^sDanaei^nG^rND^sFinucane^nMM^rND^sLu^nY^rND^sSingh^nGM^rND^sCowan^nMJ^rND^sPaciorek^nCJ^rND^sEzzati^nM^rND^sRiboli^nE]]> ^rND^sPerk^nJ^rND^sDe Backer^nG^rND^sGohlke^nH^rND^sGraham^nI^rND^sReiner^nŽ^rND^sVerschuren^nM^rND^sBrankov^nTP^rND^sMilovanovic^nM^rND^nDario^sGregori^rND^nNicola^sSoriani^rND^nClaudia Elena^sGafare^rND^nGiulia^sLorenzoni^rND^nDario^sGregori^rND^nNicola^sSoriani^rND^nClaudia Elena^sGafare^rND^nGiulia^sLorenzoni^rND^nDario^sGregori^rND^nNicola^sSoriani^rND^nClaudia Elena^sGafare^rND^nGiulia^sLorenzoni
Dario Gregori, Nicola Soriani, Claudia Elena Gafare, Giulia Lorenzoni
Unit of Biostatistics, Epidemiology and Public Health, Department of Cardiac,Thoracic and Vascular Sciences, University of Padova, Italy. Department of Nutrition,
University of Buenos Aires and Food and Diet Therapy Service, Acute General Hospital Juan A. Fernàndez, Buenos Aires, Argentina
SUMMARY: In order to face with the concerning rising prevalence of overweight and obesity in childhood, Mexican government has implemented Nutritional Indications (NI) for preschool and schoolchildren. The aim of our study is to investigate what Mexican children have for breakfast and if they meet NI, which recommends that daily breakfast should include one food from each of the three recommended food groups (grains and tubers, animal source food and legumes, fruits and vegetables). We considered a sample of 120 male children aged 3-14 years, their mothers were asked to complete a questionnaire and to fill a breakfast diary for one week. Food was grouped in the three recommended food groups and a further group including fats and sweets was considered. Only 32 children met NI at least once a week (compliant children) and nobody followed NI throug-hout the week. The analysis on breakfast records showed a low intake of the fruits and vegetables food group. Children were more likely to follow NI when they had breakfast with family members. We show that children do not meet
breakfast’s NI, but further researches are needed to investigate the long-term impact of NI on Mexican children eating patterns.
Key words: Breakfast, children, Mexico, nutritional recommendations. ]]>
RESUMEN. ¿Qué es un desayuno para los niños mexicanos? Para hacer frente al aumento de la prevalencia de sobrepeso y obesidad en la infancia, el Gobierno Mexicano ha implementado las indicaciones nutricionales (IN) para niños en etapas preescolar y escolar. El objetivo de nuestro estudio es investigar los componentes del desayuno en la dieta de niños Mexicanos, además del cumplimiento con las IN, que recomiendan que el desayuno diario debe incluir un alimento de cada uno de los tres grupos alimenticios recomendados (granos y tubérculos, alimentos de origen animal, y legumbres, frutas y verduras). Se consideró una muestra de 120 niños (de género masculino) con edades entre 3 y 14 años. Se solicitó a sus madres completar un cuestionario y realizar un registro diario de los componentes del desayuno durante una semana. Los alimentos se agruparon según dictan las IN; además, un grupo que incluye grasas y dulces fue también considerado. Sólo 32 niños cumplieron con las IN al menos una vez a la semana (los niños que cumplen) y ninguno siguió las IN durante toda la semana. El análisis sobre los registros diarios mostró un bajo consumo del grupo de alimentos compuesto por frutas y verduras. El justo seguimiento de las IN ha sido más probable cuando el desayuno se ha realizado con miembros de la familia. Se demuestra que los niños no cumplen el IN del desayuno, pero se necesitan más investigaciones para investigar el impacto a largo plazo de IN sobre los hábitos alimenticios de los niños mexicanos.
Palabras clave: Desayuno, niños, México, recomendaciones nutricionales.
INTRODUCTION
The rising prevalence of pediatric overweight and obesity, especially among Latino children and adolescents, represents a worryingly health care burden (1). The Encuesta Nacional de Salud y Nutrición (2) (ENSANUT) shows that the prevalence of overweight and obesity in Mexican children under 5 years was increased from 8.8% in 1999 to 9.7% in 2012. Regarding children between 5 and 11 years the prevalence of overweight and obesity was increased from 26.9% in 1999 to 34.4% in 2012 and the prevalence of obesity is higher among boys than girls.
The risk of developing cardiovascular (coronary artery disease, hypertension) and metabolic (type 2 diabetes) diseases in early adulthood is higher among children and adolescents who are obese (3). Additionally, it has been demonstrated that Latino children are at higher risk (than non-Latino ones) of suffering from impaired glucose tolerance due to beta-cell dysfunction, which represents the preliminary stage of type 2 diabetes (4). Thus, the need for preventive policies promoting healthy lifestyle and nutrition. ]]>
In order to face with overweight and obesity epidemic and its consequences, especially among children and adolescents, Mexican government provides the “Estrategia contra el sobrepeso y la obesidad” (5) which promotes a specific action program that takes place in preschools, primary schools and secondary schools, starting from 2010-2011 academic year. It aims to promote physical activity and healthy eating habits (reduction of fat and sugar intake, increasing consumption of fruits, vegetables and cereals). To implement the project, Mexican government carries out an educational program that involves Mexican families in order to improve eating habits of children also outside school: it suggests what type of food children should take in different eating occasions (breakfast, lunch, dinner and snacks), taking into account that dietary habits play a key role in influencing the risk of childhood obesity. More specifically, it has been shown that breakfast patterns are related to weight gain and nutrient intake of children and adolescents: several studies (6-9) demonstrate that breakfast skipping is associated with increased risk of overweight and obesity among children (10). Additionally, subjects who skip breakfast are reported to present a lack of many nutrients (particularly of vitamins, minerals and dietary fiber) (11). Not only breakfast skipping, but also breakfast composition is important: having a balanced breakfast appears to be associated with children’s better food habits and nutrient intake (12).
Given the importance of breakfast consumption and composition in children’s weight gain, dietary patterns and nutrient intake, in this study we aim to investigate what Mexican children have for breakfast and if they follow the Nutritional Indications (NI) provided by the “Estrategia contra el sobrepeso y la obesidad”.
MATERIALS AND METHODS
Study design
The present study was based on data from a market survey conducted in three Mexico’s cities (Mexico D.F., Monterrey, Guadalajara) between 27th March and 21st June 2011. The aim of the market survey was to have a complete picture of what people had for breakfast. Participants (3-55 years of age) were selected using a stratified sampling technique. A questionnaire was administered to the participants. It investigated socio-economic characteristics of the enrolled subjects, their breakfast habits (where they usually have breakfast, what they usually do while having breakfast), their attitudes towards breakfast and towards the types of food they choose for breakfast. They were also asked to fill a breakfast diary every day for one week in which they recorded what food they had for breakfast. Mothers filled the questionnaire and breakfast diaries for their children until 14 years of age.
We considered data from 120 male children (3-13 years of age). Socio-economic characteristics regarded child’s age, household size,mother’s age, working status and educational level. Mother’s attitude towards children’s breakfast was assessed using a 17 items questionnaire. Regarding breakfast diaries, we collected 437 breakfast records among 120 children. Every breakfast record reported what children had for breakfast, what they did while they were having breakfast, with whom they had breakfast and how long did it take. ]]>
Nutritional indications (NI)
The aim of our study is to investigate if children follow the NI for breakfast recommended by the “Estrategia contra el sobrepeso y la obesidad” (13). The project, in order to face with obesity epidemic, provides an educational program towards Mexican families recommending what type of food children should take in different eating occasions (breakfast, lunch, dinner and snacks). The NI are based on “el Plato del Bien Comer”: it shows the classification of food groups (fruits and vegetables, grains and tubers, legumes and animal source food) and in what proportion should take them, considering the specific features of Mexican
population (it is established from the official Mexican norm NOM 043-SSA2-2005 (13)).
Regarding breakfast, the NI provided by the “Estrategia contra el sobrepeso y la obesidad” recommends that children should take one food from every food group (fruits and vegetables, grains and tubers, legumes and animal source food). In order to investigate if children follow these NI, we classify food reported in breakfast records into the three recommended food groups using the Sistema Mexicano de Alimentos Equivalentes (14). To classify all the food children have for breakfast, we consider a further food group (not suggested from the NI) including fats and sweets.
Beverages are classified separately from food. We classify beverages using the “Recomendaciones sobre el consumo de bebidas para la población mexicana” (15): the first level includes water, the second one is represented by skim or low fat (1%) milk and sugar free soy beverages, the third consists of coffee and tea which are not recommended for children due to caffeine. The fourth level includes non-caloric beverages containing artificial sweeteners, while beverages
corresponding to the fifth level provide a high caloric intake but do not contribute to better health status (e.g. fruit juices, whole milk, alcoholic and sports drinks). Finally, the sixth level is represented by beverages that are high in sugar but provide low nutrient intake (soft drinks and other beverages high in sugar such as flavored waters, sweetened coffee and tea).
]]> The classification is inversely proportional to the suggested consumption: from the less recommended (Level 6, which should be drink rarely) to the most recommended (Level 1: water, which should be the first source of hydration).
Compliance with Nutritional Indications (NI)
The analysis of compliance with NI was conducted both on breakfast records and on individual basis. For the analysis on individual basis, we considered compliant children when they follow NI at least once a week. Following NI means that breakfast composition includes one food from each of the three recommended food groups (3/3 NI). Not following NI means that breakfast composition:
• includes food from only two or one of the recommended food groups (2/3 NI, 1/3 NI)
• includes food from only the fats and sweets group (which is not recommended from the NI) and not from the three recommended food groups
• in addition to the recommended food groups, includes food from also the fats and sweets group (3/3 NI + fats and sweets, 2/3 NI + fats and sweets, 1/3 NI + fats and sweets).
]]> Statistical Analysis
Descriptive data analysis of the compliance with NI has been performed and reported using percentages (absolute numbers). The 95% confidence intervals (C.I.) were obtained by bootstrap method (1,000 sample replications).
Basic exploratory data analysis has been performed and reported using percentages (absolute numbers), and Chi-square is used to test variations across compliance with NI groups. Analyses were performed using the R System.
RESULTS
Table 1 shows that only 26.66% (26.56; 27.07 95% C.I.) of children followed NI (3/3 NI) at least once a week (compliant children), corresponding to 7.35% (7.30; 7.42 95% C.I.) of the breakfast records. Nobody followed NI throughout the week, and most of compliant children followed NI only once a week (Figure 1).
]]> The majority of breakfast records didn’t follow NI because breakfast composition included food from only two (2/3 NI) of the recommended food groups (44.41%, 44.40; 44.63 95% C.I.) or one (1/3 NI) of the recommended food groups (31.88%, 31.71; 31.92 95% C.I.). When only two food groups were included in breakfast composition, the less represented food and vegetables (1.08%, 1.04; 1.09 95% C.I.).
When only two food groups were included in breakfast composition, the less represented food groups combination was legumes and animal source food + fruits and vegetables (1.08%, 1.07; 1.12 95% C.I.). When breakfast composition included only one of the recommended food groups, the less represented food group was fruits and vegetables (1.08%, 1.04; 1.09 95% C.I.).
Regarding the classification of beverages consumption, the most represented were: Level 5 (58.44%, 58.31; 58.53 95% C.I.), this is because children took whole milk more often than skim or low fat (1%) milk (Level 2), and Level 6 (16.07%, 15.99; 16.16 95% C.I.), because of the consumption of soft drinks and atole.Table 2 and Table 3 show respectively socio-economic characteristics of children and their mother’s attitude towards breakfast: there were no significant differences between compliant and noncompliant children.
Table 4 shows the characteristics of breakfast records which followed and didn’t follow NI: children who had breakfast with family members are more likely to follow NI than children who had breakfast alone or with others (p-value 0.007).

TABLE 2. Socio-economical characteristics of children and their mothers according to children’s compliance with NI. Data are percentages (absolute number).

FIGURE 1. Number of days in which children follow NI.
 ]]>
]]>
TABLE 3. Mother’s attitude towards breakfast according to children’s compliance with NI.

This analysis of what children had for breakfast was conducted on a sample of 120 male Mexican children and aimed to investigate if children meet the NI for breakfast provided by the “Estrategia contra el sobrepeso en la obesidad”. Only 32 children followed NI at least once a week. Similar results were obtained from other studies (16, 17) demonstrating that children and adolescents did not follow the nutritional indication for breakfast. In addition to breakfast, other studies (18, 19) evaluated if children meet daily recommended food groups intake (referring not only to breakfast consumption), showing a poor compliance. Despite the fact that we did not consider the nutrient intake but only the food group consumption and little differences in the recommendation used for the analysis of compliance, these studies, consistently with ours, reveal a low intake of fruits and vegetables compared to other food groups.

Another study (20) evaluates the impact of school action program of the “Estrategia contra el sobrepeso en la obesidad” (for the 2011-2012 academic year) on eating pattern of Mexican children, especially on school lunch. Consistently with our results, it demonstrated that the majority of lunch packages of primary schoolchildren do not follow national recommendation. Additionally, the amount of lunch packs not following guidelines further increase when the recommendations include water. Also in our study, the analysis of beverages consumption shows a low intake of water (Level 1). We found a high intake of whole milk (Level 5, which is recommended for children under 2 years of age or for children who live in geographical area with a high prevalence of malnutrition) and of beverages high in sugar and with low nutritional value, especially soft drinks (Level 6). Our findings are consistent with the results of other studies on Mexican children’s beverages consumption (21, 22), showing a high intake of caloric beverages (especially whole milk and soft drinks) and on US children (23) (particularly referring to a higher consumption of whole milk compared to skim ones).
Differently from other studies that evaluate if children meet breakfast guidelines, we found out no significant association with socio-economic characteristics and mother’s attitude towards breakfast. Thus probably because most of compliant children meet NI only once a week and in any case nobody meet NI throughout the week,consequently there is no significant difference between compliant and noncompliant children by both socio-economic characteristics and mother’s attitude towards breakfast. Particularly the assessment of beliefs on breakfast showed how mothers’ attitude of compliant and noncompliant children were similar to each other and how they both not were fully aware on the importance of breakfast: despite they both thought that breakfast is the most important meal of the day, they did not express complete agreement regard the fact that children should have a balanced breakfast which helps to make them ready for the day and to do all their physical and mental activities.
Regarding breakfast records’ characteristics, we showed that children are more likely to meet NI when they have breakfast with family members, consistently with other studies which demonstrated that children who have meals with parents present significant better dietary habits (24).
CONClUSIONS ]]>
Our study investigated if children meet NI for breakfast provided by the “Estrategia contra el sobrepeso en la obesidad”. We found out that only 32 children meet NI at least once a week and most of compliant children follow NI only once a week. Additionally, we showed a low intake of fruit and vegetables and water and a high intake of caloric beverages (whole milk and soft drinks). Further studies are needed to evaluate the longterm impact of the program on Mexican children’s eating patterns.
SOURCE Of FUNDING
The work has been partially supported by an unrestricted grant from the Italian Ministry of Foreign Affairs under the programs “Programmi di alta rilevanza scientifica e tecnologica” Italia-Messico and Italia-Argentina, and from Prochild ONLUS (Italy).
REFERENCES
1. Ogden CL, Carroll MD, Kit BK, Flegal KM. Prevalence of obesity and trends in body mass index among US children and adolescents, 1999-2010. JAMA, 2012;307(5):483-90. [ Links ]
2. Gutiérrez JP, Rivera-Dommarco J, Shamah-Levy T, Villalpando-Hernández S, Franco A, L. C-N, et al. Encuesta Nacional de Salud y Nutrición 2012. Resultados Nacionales. Cuernavaca, México: Instituto Nacional de Salud Pública (Mx). 2012. [ Links ]
3. Dietz WH. Health consequences of obesity in youth: childhood predictors of adult disease. Pediatrics. 1998;101(3 Pt 2):518-25. [ Links ]
4. Davis JN, Ventura EE, Weigensberg MJ, Ball GD, Cruz ML, Shaibi GQ, et al. The relation of sugar intake to beta cell function in overweight Latino children. Amer J Clin Nutr, 2005;82(5):1004-10. [ Links ]
5. Barquera Cervera S, Rivera Dommarco J, Campos Nonato I, Hernández Barrera L, Santos-Burgoa Zarnecki C, Durán Vidaurri E, et al. Acuerdo nacional para la salud alimentaria: estrategia contra el sobrepeso y la obesidad. Mexico DF: Sub-Secretaría de Prevención y Promoción de la Salud de la Secretaría de Salud 2010. [ Links ]
6. Utter J, Scragg R, Mhurchu CN, Schaaf D. At-home breakfast consumption among New Zealand children: associations with body mass index and related nutrition behaviors. Journal of the American Dietetic Association. 2007;107(4):570-6. [ Links ]
7. Timlin MT, Pereira MA, Story M, Neumark-Sztainer D. Breakfast eating and weight change in a 5-year prospective analysis of adolescents: Project EAT (Eating Among Teens). Pediatrics. 2008;121(3):e638-45. [ Links ]
8. Dubois L, Girard M, Potvin Kent M, Farmer A, Tatone-Tokuda F. Breakfast skipping is associated with differences in meal patterns, macronutrient intakes and
overweight among pre-school children. Public health nutrition. 2009;12(1):19-28.
9. Albertson AM, Franko DL, Thompson D, Eldridge AL, Holschuh N, Affenito SG, et al. Longitudinal patterns of breakfast eating in black and white adolescent girls. Obesity. 2007;15(9):2282-92. [ Links ]
10. Nicklas TA, Yang SJ, Baranowski T, Zakeri I, Berenson G. Eating patterns and obesity in children. The Bogalusa Heart Study. American journal of preventive
medicine. 2003;25(1):9-16. ]]>
11. Nicklas TA, Reger C, Myers L, O’Neil C. Breakfast consumption with and without vitamin-mineral supplement use favorably impacts daily nutrient intake of ninth-grade students. The Journal of adolescent health: official publication of the Society for Adolescent Medicine. 2000;27(5):314-21.
12. Matthys C, De Henauw S, Bellemans M, De Maeyer M, De Backer G. Breakfast habits affect overall nutrient profiles in adolescents. Public health nutrition. 2007;10(4):413-21. [ Links ]
13. Norma Oficial Mexicana: NOM-043-SSA2-2005, Servicios básicos de salud. Promoción y educación para la salud en materia alimentaria. Criterios para brindar orientación. [ Links ]
14. Pérez Lizaur AB, Palacios González B, Castro Becerra AL. Sistema Mexicano de Alimentos equivalentes. Fomento de Nutrición y Salud AC. 2008; 3ª ed. [ Links ]
15. Rivera JA, Muñoz-Hernández O, Rosas-Peralta M, Aguilar-Salinas CA, Popkin BM, Willett WC. Consumo de bebidas para una vida saludable: recomendaciones ]]> para la población mexicana. Boletín médico del Hospital Infantil de México. 2008;65(3):208-37.
16. Raaijmakers LG, Bessems KM, Kremers SP, van Assema P. Breakfast consumption among children and adolescents in the Netherlands. European journal of public health. 2010;20(3):318-24. [ Links ]
17. Alexy U, Wicher M, Kersting M. Breakfast trends in children and adolescents: frequency and quality. Public health nutrition. 2010;13(11):1795-802. [ Links ]
18. Munoz KA, Krebs-Smith SM, Ballard-Barbash R, WHAT IS BREAKFAST FOR MExICAN CHILDREN ? Cleveland LE. Food intakes of US children and adolescents compared with recommendations. Pediatrics. 1997;100(3 Pt 1):323-9. [ Links ]
19. Jimenez-Cruz A, Bacardi-Gascon M, Jones EG. Consumption of fruits, vegetables, soft drinks, and high-fat-containing snacks among Mexican children on the Mexico-U.S. border. Archives of medical research. 2002;33(1):74-80. [ Links ]
]]>
20. Vargas L, Jimenez-Cruz A, Bacardi-Gascon M. Unhealthy and healthy food consumption inside and outside of the school by pre-school and elementary school Mexican children in Tijuana, Mexico. Journal of community health. 2013;38(6):1166-74. [ Links ]
21. Barquera S, Campirano F, Bonvecchio A, Hernandez-Barrera L, Rivera JA, Popkin BM. Caloric beverage consumption patterns in Mexican children. Nutr J. 2010;9:47. [ Links ]
22. Stern D, Piernas C, Barquera S, Rivera JA, Popkin BM. Caloric Beverages Were Major Sources of Energy among Children and Adults in Mexico, 1999-2012. JN.
2014.
23. O’Connor TM, Yang SJ, Nicklas TA. Beverage intake among preschool children and its effect on weight status. Pediatrics. 2006;118(4):e1010-8.
24. Patrick H, Nicklas TA. A review of family and social determinants of children’s eating patterns and diet quality. Journal of the American College of Nutrition. 2005;24(2):83-92.