<?xml version="1.0" encoding="ISO-8859-1"?><article xmlns:mml="http://www.w3.org/1998/Math/MathML" xmlns:xlink="http://www.w3.org/1999/xlink" xmlns:xsi="http://www.w3.org/2001/XMLSchema-instance">
<front>
<journal-meta>
<journal-id>0376-723X</journal-id>
<journal-title><![CDATA[Boletín Técnico ]]></journal-title>
<abbrev-journal-title><![CDATA[IMME]]></abbrev-journal-title>
<issn>0376-723X</issn>
<publisher>
<publisher-name><![CDATA[Instituto de Materiales y Modelos Estructurales.Facultad de Ingenieria. Universidad Central de Venezuela.]]></publisher-name>
</publisher>
</journal-meta>
<article-meta>
<article-id>S0376-723X2002000300001</article-id>
<title-group>
<article-title xml:lang="es"><![CDATA[EVALUACIÓN DE LAS REGLAS DE COMBINACIÓN ANTES DOS COMPONENTES SÍSMICOS HORIZONTALES Y VERTICAL]]></article-title>
<article-title xml:lang="en"><![CDATA[EVALUATION OF COMBINATION RULES WITH TWO HORIZONTAL AND ONE VERTICAL SEISMIC COMPONENTS]]></article-title>
</title-group>
<contrib-group>
<contrib contrib-type="author">
<name>
<surname><![CDATA[Hernández]]></surname>
<given-names><![CDATA[Julio J.]]></given-names>
</name>
<xref ref-type="aff" rid="A01"/>
</contrib>
<contrib contrib-type="author">
<name>
<surname><![CDATA[López]]></surname>
<given-names><![CDATA[Oscar A.]]></given-names>
</name>
<xref ref-type="aff" rid="A02"/>
</contrib>
</contrib-group>
<aff id="A01">
<institution><![CDATA[,Universidad Central de Venezuela Facultad de Ingenieria IMME]]></institution>
<addr-line><![CDATA[ ]]></addr-line>
</aff>
<aff id="A02">
<institution><![CDATA[,Universidad Central de Venezuela Facultad de Ingenieria IMME]]></institution>
<addr-line><![CDATA[ ]]></addr-line>
</aff>
<pub-date pub-type="pub">
<day>00</day>
<month>11</month>
<year>2002</year>
</pub-date>
<pub-date pub-type="epub">
<day>00</day>
<month>11</month>
<year>2002</year>
</pub-date>
<volume>40</volume>
<numero>3</numero>
<fpage>1</fpage>
<lpage>18</lpage>
<copyright-statement/>
<copyright-year/>
<self-uri xlink:href="http://ve.scielo.org/scielo.php?script=sci_arttext&amp;pid=S0376-723X2002000300001&amp;lng=en&amp;nrm=iso"></self-uri><self-uri xlink:href="http://ve.scielo.org/scielo.php?script=sci_abstract&amp;pid=S0376-723X2002000300001&amp;lng=en&amp;nrm=iso"></self-uri><self-uri xlink:href="http://ve.scielo.org/scielo.php?script=sci_pdf&amp;pid=S0376-723X2002000300001&amp;lng=en&amp;nrm=iso"></self-uri><abstract abstract-type="short" xml:lang="es"><p><![CDATA[RESUMEN Se evalúan las respuestas r e, dadas por diversas reglas normativas de combinación a sismos multicomponentes, para el caso cuando una componente sísmica principal es vertical y las componentes horizontales principales pueden tener cualquier dirección. Las acciones sísmicas se expresan mediante espectros normativos de pseudoaceleraciones. Las reglas examinadas son la de la RCSC, la del 30%, la del 40% y una de las reglas del IBC. La respuesta crítica r cr, la máxima obtenida para todos los ángulos de incidencia de las componentes sísmicas, se obtiene mediante la regla CQC3. Las cotas superior e inferior de la relación r e/r cr se presentan en función de la intensidad espectral entre las componentes principales horizontales y de las respuestas a una componente sísmica actuando según cada eje estructural. Se desarrollan expresiones analíticas para los valores extremos de r e/r cr, dada una determinada intensidad espectral.]]></p></abstract>
<abstract abstract-type="short" xml:lang="en"><p><![CDATA[ABSTRACT Responses r e, given by several multicomponent combination rules used in seismic codes, are evaluated for the case when one principal seismic component is vertical and two horizontal principal components can act along any direction. Seismic motions are described by code pseudoacceleration spectra. The SRSS-, 30%-, 40%- and one of the IBC- rules are examined. Critical response r cr, the largest one for all possible incident angles of the seismic components, is obtained by means of the CQC3-rule. The upper and lower bounds of ratio r e/r cr are presented as a function of the spectral intensity ratio of the horizontal principal components and of the responses to one seismic component acting along each structural axis. Analytical expressions are developed for the extreme bounds of the ratio r e/r cr, given a fixed spectral intensity ratio.]]></p></abstract>
<kwd-group>
<kwd lng="es"><![CDATA[reglas de combinación]]></kwd>
<kwd lng="es"><![CDATA[sismos multicomponentes]]></kwd>
<kwd lng="es"><![CDATA[normas sísmicas]]></kwd>
<kwd lng="es"><![CDATA[respuesta crítica]]></kwd>
<kwd lng="es"><![CDATA[CQC3]]></kwd>
<kwd lng="es"><![CDATA[componente sísmica vertical]]></kwd>
<kwd lng="en"><![CDATA[combination rules]]></kwd>
<kwd lng="en"><![CDATA[multicomponent ground motions]]></kwd>
<kwd lng="en"><![CDATA[seismic codes]]></kwd>
<kwd lng="en"><![CDATA[critical response]]></kwd>
<kwd lng="en"><![CDATA[CQC3]]></kwd>
<kwd lng="en"><![CDATA[vertical seismic component]]></kwd>
</kwd-group>
</article-meta>
</front><body><![CDATA[   <B><FONT SIZE=4>    <P ALIGN="CENTER">EVALUACI&Oacute;N DE LAS REGLAS DE COMBINACI&Oacute;N ANTES DOS COMPONENTES S&Iacute;SMICOS HORIZONTALES Y VERTICAL</P> </FONT><I>    <P ALIGN="CENTER">Julio J. Hern&aacute;ndez<SUP>1</SUP>&nbsp; Oscar A. L&oacute;pez<SUP>2</I></SUP>&nbsp;</P> </B>    <P ALIGN="CENTER">1. Investigador Asociado, IMME, Facultad de Ingenier&iacute;a, Universidad Central de Venezuela; correo-e: julher@cantv.net</P>     <P ALIGN="CENTER">2. IMME, Facultad de Ingenier&iacute;a, Universidad Central de Venezuela; correo-e: oslopez@reacciun.ve</P>     <P ALIGN="CENTER">&nbsp;</P> <B>    <P ALIGN="JUSTIFY">RESUMEN </P> </B>    <P ALIGN="JUSTIFY">&nbsp;&nbsp;&nbsp; Se eval&uacute;an las respuestas <IMG SRC="/img/fbpe/imme/v40n3/art01gtvo3.gif" WIDTH=21 HEIGHT=36>, dadas por diversas reglas normativas de combinaci&oacute;n a sismos multicomponentes, para el caso cuando una componente s&iacute;smica principal es vertical y las componentes horizontales principales pueden tener cualquier direcci&oacute;n. Las acciones s&iacute;smicas se expresan mediante espectros normativos de pseudoaceleraciones. Las reglas examinadas son la de la RCSC, la del 30%, la del 40% y una de las reglas del IBC.</P>     
<P ALIGN="JUSTIFY">&nbsp;&nbsp;&nbsp; La respuesta cr&iacute;tica <IMG SRC="/img/fbpe/imme/v40n3/art01gtvo4.gif" WIDTH=25 HEIGHT=33>, la m&aacute;xima obtenida para todos los &aacute;ngulos de incidencia de las componentes s&iacute;smicas, se obtiene mediante la regla CQC3. Las cotas superior e inferior de la relaci&oacute;n&nbsp; <img border="0" src="/img/fbpe/imme/v40n3/art01gtvo1.gif" width="37" height="24">se presentan en funci&oacute;n de la intensidad espectral entre las componentes principales horizontales y de las respuestas a una componente s&iacute;smica actuando seg&uacute;n cada eje estructural. Se desarrollan expresiones anal&iacute;ticas para los valores extremos de <img border="0" src="/img/fbpe/imme/v40n3/art01gtvo2.gif" width="37" height="24">, dada una determinada intensidad espectral.</P> <B>    
<P ALIGN="JUSTIFY">Palabras clave:</B> reglas de combinaci&oacute;n, sismos multicomponentes, normas s&iacute;smicas, respuesta cr&iacute;tica, CQC3, componente s&iacute;smica vertical. </P> <B>    ]]></body>
<body><![CDATA[<P ALIGN="CENTER">EVALUATION OF COMBINATION RULES WITH TWO HORIZONTAL AND ONE VERTICAL SEISMIC COMPONENTS</P>     <P ALIGN="JUSTIFY">ABSTRACT</P> </B>    <P ALIGN="JUSTIFY">&nbsp;&nbsp;&nbsp; Responses <img border="0" src="/img/fbpe/imme/v40n3/art01gtvo3.gif" width="21" height="25">, given by several multicomponent combination rules used in seismic codes, are evaluated for the case when one principal seismic component is vertical and two horizontal principal components can act along any direction. Seismic motions are described by code pseudoacceleration spectra. The SRSS-, 30%-, 40%- and one of the IBC- rules are examined.</P>     
<P ALIGN="JUSTIFY">&nbsp;&nbsp;&nbsp; Critical response <img border="0" src="/img/fbpe/imme/v40n3/art01gtvo4.gif" width="25" height="25">, the largest one for all possible incident angles of the seismic components, is obtained by means of the CQC3-rule. The upper and lower bounds of ratio <IMG SRC="/img/fbpe/imme/v40n3/art01mr1.gif" WIDTH=33 HEIGHT=21>are presented as a function of the spectral intensity ratio of the horizontal principal components and of the responses to one seismic component acting along each structural axis. Analytical expressions are developed for the extreme bounds of the ratio <IMG SRC="/img/fbpe/imme/v40n3/art01mr1.gif" WIDTH=33 HEIGHT=21>, given a fixed spectral intensity ratio.</P> <B>    
<P ALIGN="JUSTIFY">Key words:</B> combination rules, multicomponent ground motions, seismic codes, critical response, CQC3, vertical seismic component.</P> <B>    <P ALIGN="JUSTIFY">INTRODUCCI&Oacute;N</P> </B>    <P ALIGN="JUSTIFY">&nbsp;&nbsp;&nbsp; Las normas de dise&ntilde;o sismorresistente, tanto la venezolana [COVENIN, 2001] como las extranjeras, por ejemplo el 1997 UBC [ICBO, 1997], el 2000 IBC [ICC, 2000] y el Euroc&oacute;digo-8 [CEN, 1998], requieren la consideraci&oacute;n de la acci&oacute;n simult&aacute;nea de las tres componentes s&iacute;smicas de movimiento de traslaci&oacute;n del terreno. En el marco del m&eacute;todo de an&aacute;lisis espectral las respuestas m&aacute;ximas probables suelen calcularse seg&uacute;n diversas reglas de combinaci&oacute;n a sismos multicomponentes, tales como la regla de la Ra&iacute;z Cuadrada de la Suma de Cuadrados (RCSC), o las reglas del 30% y del 40%.</P>     <P ALIGN="JUSTIFY">&nbsp;&nbsp;&nbsp; Las reglas RCSC y del 30% son estipuladas por COVENIN y el Euroc&oacute;digo-8, mientras que en el 1997-UBC y el 2000-IBC estas reglas se aplican a las 2 componentes horizontales y el efecto de la componente vertical se incorpora aparte mediante un t&eacute;rmino lineal en las combinaciones de dise&ntilde;o. Estas normas suponen que una componente s&iacute;smica principal es vertical y que las dos componentes horizontales tienen intensidades similares; adem&aacute;s la pr&aacute;ctica de dise&ntilde;o normalmente considera que los tres componentes act&uacute;an a lo largo de los ejes estructurales. Sin embargo, a&uacute;n manteni&eacute;ndonos dentro del m&eacute;todo de an&aacute;lisis espectral, es posible refinar la estimaci&oacute;n de las respuestas m&aacute;ximas probables para una probabilidad de excedencia establecida.</P>     <P ALIGN="JUSTIFY">&nbsp;&nbsp;&nbsp; Podemos tomar en cuenta el hecho de que las dos componentes horizontales principales tienen distintas intensidades y que pueden incidir con cualquier &aacute;ngulo respecto a los ejes estructurales, (<A HREF="#F1">Figura 1</A>), e incluso la posibilidad de que una componente principal no sea exactamente vertical (<A HREF="#F1">Figura 1(a)</A>). Con este objetivo han sido desarrolladas algunas reglas de combinaci&oacute;n; la regla denominada CQC3 ("Complete Quadratic Combination with 3 components") infiere la respuesta cr&iacute;tica como la mayor respuesta considerando todos los posibles &aacute;ngulos de incidencia de las componentes horizontales, teniendo &eacute;stas espectros proporcionales de intensidades diferentes, y bajo el supuesto que una componente principal sea vertical (<A HREF="#F1">Figura 1(b)</A>) [Smeby y Der Kiureghian, 1985; Menun y Der Kiureghian, 1998; L&oacute;pez y Torres, 1997]. En el caso de que se considere la posibilidad de desviaci&oacute;n de una componente principal respecto del eje vertical puede aplicarse una reciente generalizaci&oacute;n de este criterio, la regla GCQC3 ("Generalized Complete Quadratic Combination with 3 components") [L&oacute;pez y Hern&aacute;ndez, 2001 a; Hern&aacute;ndez y L&oacute;pez, 2002 a], la cual suministra la respuesta m&aacute;xima para todas las direcciones posibles de las componentes cuasi-vertical y cuasi-horizontales.</P>     <P ALIGN="JUSTIFY"><A NAME="F1"></A></P>     ]]></body>
<body><![CDATA[<P ALIGN="CENTER"><IMG SRC="/img/fbpe/imme/v40n3/art01fig1a.gif" WIDTH=279 HEIGHT=285><IMG SRC="/img/fbpe/imme/v40n3/art01fig1b.gif" WIDTH=279 HEIGHT=286></P> <B>    
<P ALIGN="CENTER">Figura 1. Direcciones principales (<I>1</I>, <I>2</I>, <I>3</I>) del movimiento s&iacute;smico y direcciones (<I>X</I>, <I>Y</I>, <I>Z</I>) de los ejes estructurales; (a) Caso general; (b) Caso de una direcci&oacute;n principal vertical y dos direcciones principales horizontales</P>     <P ALIGN="CENTER">&nbsp;</P> </B>    <P ALIGN="JUSTIFY">&nbsp;&nbsp;&nbsp; En un trabajo anterior se evaluaron varias reglas de combinaci&oacute;n de las componentes s&iacute;smicas compar&aacute;ndolas con la respuesta cr&iacute;tica dada por la regla CQC3, en el supuesto de que los efectos de la componente vertical en la respuesta estructural estudiada sean despreciables [L&oacute;pez et al., 2001; L&oacute;pez y Hern&aacute;ndez, 2001 b]. Para el caso m&aacute;s general en que la respuesta estructural a una componente s&iacute;smica vertical no es nula, este art&iacute;culo se propone comparar los resultados de aplicar los criterios normativos de combinaci&oacute;n mencionados al comienzo, con respecto a la respuesta cr&iacute;tica dada por la regla CQC3. Considerando la acci&oacute;n simult&aacute;nea de las tres componentes s&iacute;smicas, se logra as&iacute; evaluar los efectos peculiares de la direccionalidad de las componentes s&iacute;smicas horizontales principales y su distinta intensidad, respecto a la usual omisi&oacute;n de este fen&oacute;meno. Se ampl&iacute;a as&iacute; el programa de estudio de los efectos de la direccionalidad de las componentes s&iacute;smicas, llevado a cabo a trav&eacute;s del conjunto de referencias citadas. Estos resultados se presentan tambi&eacute;n en un par de art&iacute;culos conexos [Hern&aacute;ndez y L&oacute;pez, 2002 b; Hern&aacute;ndez y L&oacute;pez, 2003], en los cuales se incluyen adem&aacute;s los resultados correspondientes a la consideraci&oacute;n de que la componente principal <I>3</I> pueda sufrir una desviaci&oacute;n del eje vertical. Igualmente estos &uacute;ltimos resultados se presentar&aacute;n en espa&ntilde;ol en un trabajo paralelo a &eacute;ste.</P> <B>    <P ALIGN="JUSTIFY">2. MOVIMIENTOS S&Iacute;SMICOS</P> </B>    <P ALIGN="JUSTIFY">&nbsp;&nbsp;&nbsp; El movimiento s&iacute;smico de traslaci&oacute;n se puede describir a lo largo de tres ejes principales <I>1</I>, <I>2</I> y <I>3</I>,<I> </I><A HREF="#F1">(Figura 1)</A>, cuyas aceleraciones no est&aacute;n correlacionadas [Penzien y Watabe, 1975]. Llamamos <I>1</I> a la direcci&oacute;n de la mayor componente cuasi-horizontal, <I>2</I> a la direcci&oacute;n de la menor componente cuasi-horizontal y <I>3</I> a la direcci&oacute;n de la componente cuasi-vertical (la m&aacute;s cercana al eje vertical). En muchos casos la desviaci&oacute;n (&#968;<FONT FACE="Times New Roman"> ) entre esta componente y el eje vertical es despreciable, y por tanto en este trabajo se toma &#968;</FONT><I> </I><FONT FACE="Times New Roman">= 0°. Sin embargo, en ocasiones &#968; puede tomar valores significativos, posibilidad que se considera en la referencia Hern&#945;ndez y L&#963;pez, 2003. En el caso que nos ocupa basta considerar el &#945;ngulo &#952; para precisar la posici&#963;n de las componentes s&#957;smicas principales (</FONT><A HREF="#F1">Figura 1(b)</A>).</P> <B>    <P ALIGN="JUSTIFY"><A NAME="F2"></A></P> </B>    <P ALIGN="CENTER"><IMG SRC="/img/fbpe/imme/v40n3/art01fig2.gif" WIDTH=291 HEIGHT=261></P> <B><FONT FACE="Times New Roman">    
<P ALIGN="CENTER">Figura 2. Intensidad espectral suavizada, &#947;</FONT><SUB>2</SUB>, entre las componentes s&iacute;smicas horizontales menor y mayor</P>     <P ALIGN="CENTER">&nbsp;</P> </B>    ]]></body>
<body><![CDATA[<P ALIGN="JUSTIFY">&nbsp;&nbsp;&nbsp; Para la aplicaci&oacute;n del m&eacute;todo de an&aacute;lisis espectral cada componente <I>k <IMG SRC="/img/fbpe/imme/v40n3/art01ms1.gif" WIDTH=66 HEIGHT=20></I>se describe mediante un espectro de pseudoaceleraciones. Simplificadamente, suponemos que los espectros de las componentes horizontales son proporcionales entre s&iacute;, tomando a <IMG SRC="/img/fbpe/imme/v40n3/art01ms2.gif" WIDTH=44 HEIGHT=21>como el espectro correspondiente a la componente <I>2</I>, donde <I>T</I> es el periodo de vibraci&oacute;n y <IMG SRC="/img/fbpe/imme/v40n3/art01ms3.gif" WIDTH=32 HEIGHT=20>es el espectro de la componente <I>1</I>. Denominamos intensidad espectral al par&aacute;metro <IMG SRC="/img/fbpe/imme/v40n3/art01ms4.gif" WIDTH=38 HEIGHT=21>. El error en las respuestas, proveniente de suponer espectros proporcionales, suele ser peque&ntilde;o dado que dichas respuestas est&aacute;n principalmente contenidas en un modo dominante. Esta simplificaci&oacute;n tiene la ventaja de permitir la realizaci&oacute;n de evaluaciones param&eacute;tricas, que es el objetivo principal de este trabajo. Para la componente vertical <IMG SRC="/img/fbpe/imme/v40n3/art01ms5.gif" WIDTH=34 HEIGHT=16>empleamos el espectro <IMG SRC="/img/fbpe/imme/v40n3/art01ms6.gif" WIDTH=38 HEIGHT=21>.</P>     
<P ALIGN="JUSTIFY">&nbsp;&nbsp;&nbsp; Podemos utilizar valores razonables de la intensidad espectral <IMG SRC="/img/fbpe/imme/v40n3/art01ms7.gif" WIDTH=17 HEIGHT=21>entre las componentes s&iacute;smicas horizontales a partir de un reciente estudio estad&iacute;stico [L&oacute;pez y Hern&aacute;ndez, 2002; L&oacute;pez et al., 2002]. En la <A HREF="#F2">Figura 2</A> se observan los valores medios suavizados obtenidos para los casos de sismos cercanos y lejanos; en general los valores de <IMG SRC="/img/fbpe/imme/v40n3/art01ms7.gif" WIDTH=17 HEIGHT=21>oscilan entre 0.5 y 0.8 aproximadamente.</P> <B>    
<P ALIGN="JUSTIFY">3. RESPUESTA CR&Iacute;TICA ANTE DOS COMPONENTES S&Iacute;SMICAS HORIZONTALES Y UNA VERTICAL</P> </B>    <P ALIGN="JUSTIFY">&nbsp;&nbsp;&nbsp; Consideramos una respuesta estructural que pueda expresarse como combinaci&oacute;n lineal de los desplazamientos generalizados de un sistema el&aacute;stico de m grados de libertad. Llamamos r al valor m&aacute;ximo probable de la respuesta. Particularmente definimos a <IMG SRC="/img/fbpe/imme/v40n3/art01rc1.gif" WIDTH=14 HEIGHT=22>y <IMG SRC="/img/fbpe/imme/v40n3/art01rp2.gif" WIDTH=16 HEIGHT=24>como las respuestas m&aacute;ximas probables a una &uacute;nica componente s&iacute;smica de espectro <IMG SRC="/img/fbpe/imme/v40n3/art01ms3.gif" WIDTH=32 HEIGHT=18>aplicada sucesivamente seg&uacute;n los ejes X y Y, respectivamente. Y denominamos <IMG SRC="/img/fbpe/imme/v40n3/art01rc3.gif" WIDTH=14 HEIGHT=21>a la respuesta m&aacute;xima probable ante la aplicaci&oacute;n de la componente s&iacute;smica <IMG SRC="/img/fbpe/imme/v40n3/art01ms5.gif" WIDTH=34 HEIGHT=16>de espectro <IMG SRC="/img/fbpe/imme/v40n3/art01rc4.gif" WIDTH=38 HEIGHT=21>.</P>     
<P ALIGN="JUSTIFY">&nbsp;&nbsp;&nbsp; Las respuestas <IMG SRC="/img/fbpe/imme/v40n3/art01rc1.gif" WIDTH=14 HEIGHT=22>, <IMG SRC="/img/fbpe/imme/v40n3/art01rp2.gif" WIDTH=16 HEIGHT=24>y <IMG SRC="/img/fbpe/imme/v40n3/art01rp3.gif" WIDTH=14 HEIGHT=21>las calculamos con la regla CQC ("Complete Quadratic Combination") [Chopra, 2001]:</P>     
<P ALIGN="CENTER"><IMG SRC="/img/fbpe/imme/v40n3/art01cb1.gif" WIDTH=144 HEIGHT=48>, <IMG SRC="/img/fbpe/imme/v40n3/art01cb2.gif" WIDTH=145 HEIGHT=48>, <IMG SRC="/img/fbpe/imme/v40n3/art01cb3.gif" WIDTH=145 HEIGHT=48>(1a-c)</P>     
<P ALIGN="JUSTIFY">&nbsp;&nbsp;&nbsp; El t&eacute;rmino cruzado de las respuestas <IMG SRC="/img/fbpe/imme/v40n3/art01rc1.gif" WIDTH=16 HEIGHT=24>y <IMG SRC="/img/fbpe/imme/v40n3/art01rp2.gif" WIDTH=17 HEIGHT=25>se define como:</P>     
<P ALIGN="CENTER"><IMG SRC="/img/fbpe/imme/v40n3/art01tc1.gif" WIDTH=145 HEIGHT=48>(2)</P>     
<P ALIGN="JUSTIFY">&nbsp;&nbsp;&nbsp; En las expresiones (1) y (2) <IMG SRC="/img/fbpe/imme/v40n3/art01exp1.gif" WIDTH=20 HEIGHT=25>es la respuesta m&aacute;xima probable del modo de vibraci&oacute;n i, ante la componente s&iacute;smica de espectro <IMG SRC="/img/fbpe/imme/v40n3/art01exp2.gif" WIDTH=34 HEIGHT=22>aplicada seg&uacute;n la direcci&oacute;n k (k = X, Y) y <IMG SRC="/img/fbpe/imme/v40n3/art01exp3.gif" WIDTH=17 HEIGHT=22>es la correspondiente respuesta ante la componente s&iacute;smica de direcci&oacute;n <IMG SRC="/img/fbpe/imme/v40n3/art01ms5.gif" WIDTH=34 HEIGHT=16>y espectro <IMG SRC="/img/fbpe/imme/v40n3/art01exp4.gif" WIDTH=41 HEIGHT=22>, tomadas todas con su respectivo signo algebraico; <IMG SRC="/img/fbpe/imme/v40n3/art01exp5.gif" WIDTH=18 HEIGHT=24>es el coeficiente de correlaci&oacute;n modal entre los modos i y j.</P>     
<P ALIGN="JUSTIFY">&nbsp;&nbsp;&nbsp; Admitiendo que los espectros de las componentes principales horizontales guardan la relaci&oacute;n de proporcionalidad <IMG SRC="/img/fbpe/imme/v40n3/art01cp1.gif" WIDTH=17 HEIGHT=21>, la respuesta m&aacute;xima probable ante las tres componentes conjuntas puede ponerse en funci&oacute;n del &aacute;ngulo de incidencia &#952;<I> </I>usando la regla CQC3 [Smeby y Der Kiureghian, 1985; Menun y Der Kiureghian, 1998; L&oacute;pez y Torres, 1997]:</P>     
]]></body>
<body><![CDATA[<P ALIGN="CENTER"><IMG SRC="/img/fbpe/imme/v40n3/art01cp2.gif" WIDTH=446 HEIGHT=30>(3)</P>     
<P ALIGN="JUSTIFY">&nbsp;&nbsp;&nbsp; La respuesta cr&iacute;tica, definida como el m&aacute;ximo valor de <I>r</I><FONT FACE="Times New Roman"> considerando todos los valores posibles de &#952; , y el correspondiente &#945;ngulo cr&#957;tico para el cual ocurre, vienen dados por [Anastassiadis et al., 1998; L&#963;pez et al., 2000]:</P> </FONT>    <P ALIGN="CENTER"><IMG SRC="/img/fbpe/imme/v40n3/art01csh4a.gif" WIDTH=374 HEIGHT=73>(4a)</P>     
<P ALIGN="CENTER"><IMG SRC="/img/fbpe/imme/v40n3/art01csh4b.gif" WIDTH=132 HEIGHT=54>(4b)</P>     
<P ALIGN="JUSTIFY">&nbsp;</P> <B>    <P ALIGN="JUSTIFY">4. REGLAS DE COMBINACI&Oacute;N NORMATIVAS PARA DISE&Ntilde;O CON TRES</B> <B>COMPONENTES S&Iacute;SMICAS</P> </B>    <P ALIGN="JUSTIFY">&nbsp;&nbsp;&nbsp; Se examinan aqu&iacute; las siguientes reglas de combinaci&oacute;n a sismos multicomponentes: la regla de la Ra&iacute;z Cuadrada de la Suma de Cuadrados (RCSC), la regla del 30%, la regla del 40% y una de las reglas especificadas en el UBC 1997 y el IBC 2000, la cual designamos como regla IBC#1. Las dos primeras se prescriben en el Euroc&oacute;digo 8, COVENIN 2001 y en otras normas. La regla del 40% se recomienda para el an&aacute;lisis de plantas nucleares [ASCE, 1986] y de puentes [Nutt, 1996]. En [Hern&aacute;ndez y L&oacute;pez, 2003] se estudia tambi&eacute;n otra regla (IBC#2) especificada en el UBC 1997 y el IBC 2000. Conviene destacar que en todas las reglas de combinaci&oacute;n de las normativas actuales se omite la consideraci&oacute;n de la relaci&oacute;n de intensidad espectral, <IMG SRC="/img/fbpe/imme/v40n3/art01ms8.gif" WIDTH=16 HEIGHT=21>, entre las componentes s&iacute;smicas horizontales.</P>     
<P ALIGN="JUSTIFY">&nbsp;&nbsp;&nbsp; El valor de la respuesta combinada calculada utilizando cualquiera de estas reglas de combinaci&oacute;n la llamaremos "respuesta estimada" y la designaremos con <IMG SRC="/img/fbpe/imme/v40n3/art01re1.gif" WIDTH=15 HEIGHT=22>; ella depende de las respuestas m&aacute;ximas probables ante una &uacute;nica componente s&iacute;smica actuando a lo largo de los ejes estructurales, <IMG SRC="/img/fbpe/imme/v40n3/art01rc1.gif" WIDTH=14 HEIGHT=22>, <IMG SRC="/img/fbpe/imme/v40n3/art01rp2.gif" WIDTH=16 HEIGHT=24>y <IMG SRC="/img/fbpe/imme/v40n3/art01rp3.gif" WIDTH=14 HEIGHT=21>, dadas por las expresiones (1a), (1b) y (1c), respectivamente. Sin p&eacute;rdida de generalidad podemos suponer que <IMG SRC="/img/fbpe/imme/v40n3/art01gn1.gif" WIDTH=40 HEIGHT=24>, y con la finalidad de normalizar las expresiones definimos las siguientes razones de respuesta:</P>     
<P ALIGN="CENTER"><IMG SRC="/img/fbpe/imme/v40n3/art01rz5a.gif" WIDTH=76 HEIGHT=24>; <IMG SRC="/img/fbpe/imme/v40n3/art01rz5b.gif" WIDTH=62 HEIGHT=25>(5) </P> <B><FONT SIZE=4>    
<P ALIGN="JUSTIFY">&nbsp;</B></FONT> <B>4.1 Regla de la RCSC</P> </B>    ]]></body>
<body><![CDATA[<P ALIGN="JUSTIFY">&nbsp;&nbsp;&nbsp; La aplicaci&oacute;n de esta regla equivale a suponer que las respuestas a cada componente s&iacute;smica en la direcci&oacute;n de los ejes estructurales son estad&iacute;sticamente independientes, y que ambas componentes horizontales tienen la misma intensidad espectral:</P>     <P ALIGN="CENTER">&nbsp;<IMG SRC="/img/fbpe/imme/v40n3/art01ch6.gif" WIDTH=212 HEIGHT=32> (6)</P> <B>    
<P ALIGN="JUSTIFY">4.2 Regla del 30%</P> </B>    <P ALIGN="JUSTIFY">&nbsp;&nbsp;&nbsp; Esta regla es una aproximaci&oacute;n lineal que supone componentes s&iacute;smicas horizontales de igual intensidad y no correlacionadas entre s&iacute; [Rosenblueth y Contreras, 1977]:</P>     <P ALIGN="CENTER"><IMG SRC="/img/fbpe/imme/v40n3/art01csh7.gif" WIDTH=254 HEIGHT=49>(7) </P> <B>    
<P ALIGN="JUSTIFY">4.3 Regla del 40%</P> </B>    <P ALIGN="JUSTIFY">&nbsp;&nbsp;&nbsp; Esta regla igualmente supone componentes s&iacute;smicas horizontales de igual intensidad no correlacionadas. Pretende ser conservadora para la mayor&iacute;a de los casos [Newmark, 1975]:</P>     <P ALIGN="CENTER"><IMG SRC="/img/fbpe/imme/v40n3/art01csh8.gif" WIDTH=254 HEIGHT=49>(8)</P> <B>    
<P ALIGN="JUSTIFY">4.4 Regla IBC#1</P> </B>    <P ALIGN="JUSTIFY">&nbsp;&nbsp;&nbsp; Una de las reglas prescritas en el IBC combina las respuestas a las dos componentes horizontales mediante la regla de la RCSC, y a&ntilde;ade al resultado (tras multiplicarlo por cierto coeficiente de redundancia estructural &#961; ) la contribuci&#963;n de la componente vertical, la cual es estimada en <IMG SRC="/img/fbpe/imme/v40n3/art01cv1.gif" WIDTH=65 HEIGHT=22>, donde <IMG SRC="/img/fbpe/imme/v40n3/art01cv2.gif" WIDTH=21 HEIGHT=22>es la respuesta a carga permanente, y <IMG SRC="/img/fbpe/imme/v40n3/art01cv3.gif" WIDTH=25 HEIGHT=22>es la aceleraci&oacute;n espectral horizontal para periodos cortos. Esto equivale a adoptar como espectro para la componente vertical a 2/3 del espectro de las componentes horizontales, <IMG SRC="/img/fbpe/imme/v40n3/art01cv4.gif" WIDTH=93 HEIGHT=22>, y tomar luego 30% de su valor como contribuci&oacute;n simult&aacute;nea de la componente vertical: <IMG SRC="/img/fbpe/imme/v40n3/art01cv5.gif" WIDTH=110 HEIGHT=22>. Por consiguiente, la respuesta combinada (tomando <IMG SRC="/img/fbpe/imme/v40n3/art01cv6.gif" WIDTH=25 HEIGHT=18>) se puede escribir como:</P>     
]]></body>
<body><![CDATA[<P ALIGN="CENTER"><IMG SRC="/img/fbpe/imme/v40n3/art01rc9.gif" WIDTH=398 HEIGHT=36>(9)</P>     
<P ALIGN="JUSTIFY">&nbsp; </P> <B>    <P ALIGN="JUSTIFY">5. COMPARACI&Oacute;N ENTRE LAS RESPUESTAS ESTIMADAS Y LA CR&Iacute;TICA</P> </B>    <P ALIGN="JUSTIFY">&nbsp;&nbsp;&nbsp; Comparamos la respuesta estimada, <IMG SRC="/img/fbpe/imme/v40n3/art01re1.gif" WIDTH=14 HEIGHT=22>, obtenida con cada una de las reglas de combinaci&oacute;n normativas (expresiones (6) -( 9)) con la respuesta cr&iacute;tica calculada con la regla CQC3 (expresi&oacute;n (4)). Realizamos evaluaciones para los valores extremos aproximados de <IMG SRC="/img/fbpe/imme/v40n3/art01ms7.gif" WIDTH=17 HEIGHT=21>, 0.5 y 0.8 (<A HREF="#F2">Figura 2</A>), y para el valor intermedio <IMG SRC="/img/fbpe/imme/v40n3/art01vi1.gif" WIDTH=53 HEIGHT=21>. Presentamos los valores m&aacute;ximo y m&iacute;nimo de la relaci&oacute;n <IMG SRC="/img/fbpe/imme/v40n3/art01mr1.gif" WIDTH=36 HEIGHT=22>, la cual corresponde a los valores m&iacute;nimo y m&aacute;ximo de la respuesta cr&iacute;tica <IMG SRC="/img/fbpe/imme/v40n3/art01rpt1.gif" WIDTH=18 HEIGHT=22>, respectivamente. Estos valores, <IMG SRC="/img/fbpe/imme/v40n3/art01min1.gif" WIDTH=38 HEIGHT=24>y <IMG SRC="/img/fbpe/imme/v40n3/art01max2.gif" WIDTH=40 HEIGHT=24>se determinan con la expresi&oacute;n (4) para los casos <IMG SRC="/img/fbpe/imme/v40n3/art01exp6.gif" WIDTH=41 HEIGHT=24>y <IMG SRC="/img/fbpe/imme/v40n3/art01exp7.gif" WIDTH=68 HEIGHT=24>respectivamente, los cuales corresponden a las situaciones extremas de correlaci&oacute;n nula y correlaci&oacute;n perfecta entre las respuestas <I>r<SUB>x</I></SUB> y <I>r<SUB>y</I></SUB> [L&oacute;pez et al., 2000]:</P>     
<P ALIGN="CENTER"><IMG SRC="/img/fbpe/imme/v40n3/art01cp%20X.gif" WIDTH=336 HEIGHT=30>(10a,b)</P>     
<P ALIGN="JUSTIFY">&nbsp;&nbsp;&nbsp; Observemos que las respuestas estimadas <IMG SRC="/img/fbpe/imme/v40n3/art01re1.gif" WIDTH=14 HEIGHT=22>(expresiones (6) -( 9)) tienen la forma <IMG SRC="/img/fbpe/imme/v40n3/art01rf1.gif" WIDTH=82 HEIGHT=25><I>, </I>donde<I> </I>f representa una relaci&oacute;n funcional gen&eacute;rica. Por tanto, para valores prefijados de<I> </I><FONT FACE="Times New Roman">&#946;</FONT><SUB> </SUB>y<I> <IMG SRC="/img/fbpe/imme/v40n3/art01vp1.gif" WIDTH=17 HEIGHT=24></I>tenemos:</P>     
<P ALIGN="CENTER"><IMG SRC="/img/fbpe/imme/v40n3/art01vpXIa.gif" WIDTH=356 HEIGHT=30>(11a)</P>     
<P ALIGN="CENTER"><IMG SRC="/img/fbpe/imme/v40n3/art01vpXIb.gif" WIDTH=393 HEIGHT=30>(11b)</P>     
<P ALIGN="JUSTIFY">&nbsp;&nbsp;&nbsp; donde <IMG SRC="/img/fbpe/imme/v40n3/art01rf2.gif" WIDTH=16 HEIGHT=21>y <IMG SRC="/img/fbpe/imme/v40n3/art01rf3.gif" WIDTH=17 HEIGHT=21>representan relaciones funcionales<I>. </I>Si ahora consideramos toda la variaci&oacute;n posible de los par&aacute;metros<I> </I><FONT FACE="Times New Roman">&#946;</FONT><I> </I>y<I> <IMG SRC="/img/fbpe/imme/v40n3/art01vp1.gif" WIDTH=17 HEIGHT=24>, </I>manteniendo constante<IMG SRC="/img/fbpe/imme/v40n3/art01ms7.gif" WIDTH=17 HEIGHT=21>,<I> </I>obtenemos las cotas inferior y superior del cociente <IMG SRC="/img/fbpe/imme/v40n3/art01cv7.gif" WIDTH=46 HEIGHT=22>correspondientes a cada <IMG SRC="/img/fbpe/imme/v40n3/art01ms7.gif" WIDTH=17 HEIGHT=21>:</P>     
<P ALIGN="CENTER"><IMG SRC="/img/fbpe/imme/v40n3/art02fm12.gif" WIDTH=385 HEIGHT=49>&nbsp;&nbsp; (12)</P>     
]]></body>
<body><![CDATA[<P ALIGN="CENTER">&nbsp;</P>     <P ALIGN="JUSTIFY">&nbsp;&nbsp;&nbsp; Es decir, la cota superior es una relaci&oacute;n funcional S que depende de <IMG SRC="/img/fbpe/imme/v40n3/art01ms7.gif" WIDTH=17 HEIGHT=21>, mientras que la cota inferior I es independiente de este par&aacute;metro. La funci&oacute;n S y la constante I evidentemente est&aacute;n relacionadas con la funci&oacute;n f que define <IMG SRC="/img/fbpe/imme/v40n3/art01ms8.gif" WIDTH=14 HEIGHT=22>, es decir son particulares de cada criterio de combinaci&oacute;n. En lo que sigue hablaremos de subestimaci&oacute;n de <IMG SRC="/img/fbpe/imme/v40n3/art01sb1.gif" WIDTH=18 HEIGHT=22>cuando la respuesta estimada <IMG SRC="/img/fbpe/imme/v40n3/art01ms8.gif" WIDTH=14 HEIGHT=22>sea menor que aquella, y de sobreestimaci&oacute;n cuando sea mayor.</P>     
<P ALIGN="JUSTIFY">&nbsp;&nbsp;&nbsp; N&oacute;tese que los casos particulares que se obtengan de la expresi&oacute;n (12) ser&aacute;n v&aacute;lidos para cualquier sistema estructural y cualesquiera formas espectrales (con espectros horizontales proporcionales). Las razones de respuesta &#946;<I> </I>y <IMG SRC="/img/fbpe/imme/v40n3/art01vp1.gif" WIDTH=17 HEIGHT=24>engloban las propiedades de cualquier respuesta, las intensidades relativas de los espectros horizontales se incorporan en <IMG SRC="/img/fbpe/imme/v40n3/art01ms7.gif" WIDTH=17 HEIGHT=21>, mientras que la intensidad relativa entre la componente vertical y las horizontales est&aacute; incluida en <IMG SRC="/img/fbpe/imme/v40n3/art01vp1.gif" WIDTH=17 HEIGHT=24>.</P>     
<P ALIGN="JUSTIFY">&nbsp;&nbsp;&nbsp; Cuando <IMG SRC="/img/fbpe/imme/v40n3/art01rpe1.gif" WIDTH=64 HEIGHT=22>diremos que la respuesta estimada <IMG SRC="/img/fbpe/imme/v40n3/art01rpe2.gif" WIDTH=25 HEIGHT=22>subestima la respuesta cr&iacute;tica, y cuando <IMG SRC="/img/fbpe/imme/v40n3/art01rpe3.gif" WIDTH=64 HEIGHT=22>diremos que la sobreestima. </P> <B><FONT SIZE=4>    
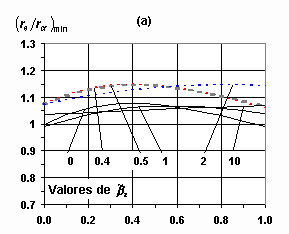
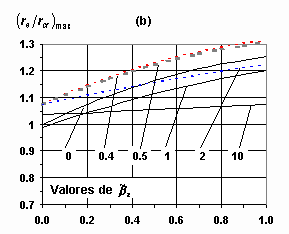
<P ALIGN="JUSTIFY">&nbsp;</B></FONT> <B>5.1 Regla de la RCSC</P> </B>    <P ALIGN="JUSTIFY">&nbsp;&nbsp;&nbsp; En la regla de la RCSC, <IMG SRC="/img/fbpe/imme/v40n3/art01ms8.gif" WIDTH=14 HEIGHT=22>(expresi&oacute;n (6)) es igual a <IMG SRC="/img/fbpe/imme/v40n3/art01max2.gif" WIDTH=40 HEIGHT=24>(expresi&oacute;n (10b)). Por tanto <IMG SRC="/img/fbpe/imme/v40n3/art01sbc1.gif" WIDTH=84 HEIGHT=22>, y esta regla siempre sobreestima la respuesta cr&iacute;tica (<A HREF="#F3">Figura 3(a)</A>). En las <A HREF="#F3">Figuras 3(b)</A>, <A HREF="#F3">3(c)</A> y <A HREF="#F3">3(d)</A> se presentan las variaciones de la relaci&oacute;n <IMG SRC="/img/fbpe/imme/v40n3/art01sbc2.gif" WIDTH=60 HEIGHT=24>en funci&oacute;n de &#946;<I> </I>, para valores de <IMG SRC="/img/fbpe/imme/v40n3/art01vp1.gif" WIDTH=17 HEIGHT=24>comprendidos entre 0 y 10, y para los casos de <IMG SRC="/img/fbpe/imme/v40n3/art01ms7.gif" WIDTH=17 HEIGHT=21>igual 0.5, 0.65 y 0.8.</P>     
<P ALIGN="JUSTIFY">&nbsp;&nbsp;&nbsp; Los mayores valores de <IMG SRC="/img/fbpe/imme/v40n3/art01mv1.gif" WIDTH=60 HEIGHT=24>ocurren para valores peque&ntilde;os de <IMG SRC="/img/fbpe/imme/v40n3/art01vp1.gif" WIDTH=17 HEIGHT=24>y para el menor valor de <IMG SRC="/img/fbpe/imme/v40n3/art01ms7.gif" WIDTH=17 HEIGHT=21>. Para valores grandes de <IMG SRC="/img/fbpe/imme/v40n3/art01vp1.gif" WIDTH=17 HEIGHT=24>la respuesta calculada con la RCSC tiende a la respuesta cr&iacute;tica <IMG SRC="/img/fbpe/imme/v40n3/art01rpc1.gif" WIDTH=60 HEIGHT=22>. Mediante manipulaci&oacute;n algebraica de la expresi&oacute;n (12), usando las funciones f, <IMG SRC="/img/fbpe/imme/v40n3/art01rf2.gif" WIDTH=16 HEIGHT=21>y <IMG SRC="/img/fbpe/imme/v40n3/art01rf3.gif" WIDTH=17 HEIGHT=21>derivadas de la expresi&oacute;n (6), obtenemos las siguientes cotas inferior y superior de la relaci&oacute;n <IMG SRC="/img/fbpe/imme/v40n3/art01mr1.gif" WIDTH=38 HEIGHT=22><FONT FACE="Times New Roman">para el conjunto de valores posibles de &#946;</FONT><I> </I>y <IMG SRC="/img/fbpe/imme/v40n3/art01vp1.gif" WIDTH=17 HEIGHT=24>y un valor fijo de <IMG SRC="/img/fbpe/imme/v40n3/art01ms7.gif" WIDTH=17 HEIGHT=21>:</P>     
<P ALIGN="CENTER"><IMG SRC="/img/fbpe/imme/v40n3/art01cjv1.gif" WIDTH=149 HEIGHT=29>; <IMG SRC="/img/fbpe/imme/v40n3/art01cjv2.gif" WIDTH=65 HEIGHT=21>(13)</P>     
<P ALIGN="JUSTIFY">&nbsp;&nbsp;&nbsp; Para esta regla las cotas superior e inferior son iguales a las correspondientes al caso de respuesta vertical nula<I> </I>[L&oacute;pez et al., 2001; L&oacute;pez y Hern&aacute;ndez, 2001 b], ya que &eacute;ste es el caso m&aacute;s desfavorable. La m&aacute;xima sobreestimaci&oacute;n encontrada es 26.5% para <IMG SRC="/img/fbpe/imme/v40n3/art01sbr1.gif" WIDTH=49 HEIGHT=21>; mientras que para <IMG SRC="/img/fbpe/imme/v40n3/art01sbr2.gif" WIDTH=97 HEIGHT=21>las mayores sobreestimaciones son 18.6% y 10.4%, respectivamente.</P>     
<P ALIGN="JUSTIFY"><A NAME="F3"></A></P>     ]]></body>
<body><![CDATA[<P ALIGN="CENTER"><IMG SRC="/img/fbpe/imme/v40n3/art01fig3a.gif" WIDTH=291 HEIGHT=234><IMG SRC="/img/fbpe/imme/v40n3/art01fig3b.gif" WIDTH=289 HEIGHT=234></P>     
<P ALIGN="CENTER"><IMG SRC="/img/fbpe/imme/v40n3/art01fig3c.gif" WIDTH=291 HEIGHT=252><IMG SRC="/img/fbpe/imme/v40n3/art01fig3d.gif" WIDTH=289 HEIGHT=252></P> <B>    
<P ALIGN="CENTER">Figura 3. Cotas de <IMG SRC="/img/fbpe/imme/v40n3/art01mr1.gif" WIDTH=36 HEIGHT=22>para la regla de la RCSC: (a) <IMG SRC="/img/fbpe/imme/v40n3/art01RCSC1a.gif" WIDTH=60 HEIGHT=22>para todo <IMG SRC="/img/fbpe/imme/v40n3/art01ms7.gif" WIDTH=17 HEIGHT=21>; ( b) <IMG SRC="/img/fbpe/imme/v40n3/art01RCSC1b.gif" WIDTH=60 HEIGHT=22>para <IMG SRC="/img/fbpe/imme/v40n3/art01ms7.gif" WIDTH=17 HEIGHT=21>= 0.5; (c) <IMG SRC="/img/fbpe/imme/v40n3/art01RCSC1b.gif" WIDTH=60 HEIGHT=22>para <IMG SRC="/img/fbpe/imme/v40n3/art01ms7.gif" WIDTH=17 HEIGHT=21>= 0.65; (d) <IMG SRC="/img/fbpe/imme/v40n3/art01RCSC1b.gif" WIDTH=60 HEIGHT=22>para <IMG SRC="/img/fbpe/imme/v40n3/art01ms7.gif" WIDTH=17 HEIGHT=21>= 0.8</P>     
<P ALIGN="JUSTIFY">&nbsp;</P>     <P ALIGN="JUSTIFY">5.2 Regla del 30%</P> </B>    <P ALIGN="JUSTIFY">&nbsp;&nbsp;&nbsp; Al aplicar la regla del 30% resultan subestimaciones o sobreestimaciones de <IMG SRC="/img/fbpe/imme/v40n3/art01rpt1.gif" WIDTH=18 HEIGHT=22>dependiendo de los valores de los par&aacute;metros &#946;, <IMG SRC="/img/fbpe/imme/v40n3/art01vp1.gif" WIDTH=17 HEIGHT=24>y <IMG SRC="/img/fbpe/imme/v40n3/art01ms7.gif" WIDTH=17 HEIGHT=21>. La <A HREF="#F4">Figura 4</A> muestra las variaciones de <IMG SRC="/img/fbpe/imme/v40n3/art01RCSC1a.gif" WIDTH=64 HEIGHT=22>y <IMG SRC="/img/fbpe/imme/v40n3/art01mv1.gif" WIDTH=60 HEIGHT=24>en funci&oacute;n de &#946; , para valores de <IMG SRC="/img/fbpe/imme/v40n3/art01vp1.gif" WIDTH=17 HEIGHT=24>entre 0 y 10, y <IMG SRC="/img/fbpe/imme/v40n3/art01ms7.gif" WIDTH=17 HEIGHT=21>igual a 0.5, 0.65 y 0.8.</P>     
<P ALIGN="JUSTIFY">&nbsp;&nbsp;&nbsp; El cociente <IMG SRC="/img/fbpe/imme/v40n3/art01mr1.gif" WIDTH=38 HEIGHT=22>puede aumentar o disminuir por efecto de la respuesta a la componente vertical (<IMG SRC="/img/fbpe/imme/v40n3/art01vp1.gif" WIDTH=17 HEIGHT=24>&gt;0) respecto del caso con dicha respuesta nula <IMG SRC="/img/fbpe/imme/v40n3/art01rn1.gif" WIDTH=49 HEIGHT=24>detallada en [L&oacute;pez et al., 2001; L&oacute;pez y Hern&aacute;ndez, 2001 b]. En general los valores de <IMG SRC="/img/fbpe/imme/v40n3/art01mv1.gif" WIDTH=60 HEIGHT=24>tienden a crecer al pasar <IMG SRC="/img/fbpe/imme/v40n3/art01vp1.gif" WIDTH=17 HEIGHT=24>de 0 a ~0.3; disminuyen con <IMG SRC="/img/fbpe/imme/v40n3/art01vp1.gif" WIDTH=17 HEIGHT=24>de ~0.3 a 1; vuelven a crecer para <IMG SRC="/img/fbpe/imme/v40n3/art01vp1.gif" WIDTH=17 HEIGHT=24>de 1 a ~3, para tender a 1 <IMG SRC="/img/fbpe/imme/v40n3/art01pt1.gif" WIDTH=62 HEIGHT=22>con valores grandes de <IMG SRC="/img/fbpe/imme/v40n3/art01vp1.gif" WIDTH=17 HEIGHT=24>. Mediante manipulaci&oacute;n algebraica de la expresi&oacute;n (12), usando las funciones f, <IMG SRC="/img/fbpe/imme/v40n3/art01rf2.gif" WIDTH=16 HEIGHT=21>y <IMG SRC="/img/fbpe/imme/v40n3/art01rf3.gif" WIDTH=17 HEIGHT=21>derivadas de la expresi&oacute;n (7), obtenemos las siguientes cotas inferior y superior de la relaci&oacute;n <IMG SRC="/img/fbpe/imme/v40n3/art01mr1.gif" WIDTH=36 HEIGHT=24><FONT FACE="Times New Roman">para el conjunto de valores posibles de &#946; y <IMG SRC="/img/fbpe/imme/v40n3/art01vp1.gif" WIDTH=17 HEIGHT=24></FONT>y un valor determinado de<I> <IMG SRC="/img/fbpe/imme/v40n3/art01ms7.gif" WIDTH=17 HEIGHT=21></I>:</P>     
<P ALIGN="CENTER"><IMG SRC="/img/fbpe/imme/v40n3/art01csh14a.gif" WIDTH=304 HEIGHT=29>; <IMG SRC="/img/fbpe/imme/v40n3/art01csh14b.gif" WIDTH=86 HEIGHT=21>(14)</P> <B>    
<P ALIGN="JUSTIFY"><A NAME="F4"></A></P> </B>    <P ALIGN="CENTER"><IMG SRC="/img/fbpe/imme/v40n3/art01fig4a.gif" WIDTH=289 HEIGHT=234><IMG SRC="/img/fbpe/imme/v40n3/art01fig4b.jpg" WIDTH=271 HEIGHT=217></P>     
]]></body>
<body><![CDATA[<P ALIGN="CENTER"><IMG SRC="/img/fbpe/imme/v40n3/art01fig4c.gif" WIDTH=289 HEIGHT=252><IMG SRC="/img/fbpe/imme/v40n3/art01fig4d.gif" WIDTH=289 HEIGHT=252></P> <B>    
<P ALIGN="CENTER">Figura 4. Cotas de <IMG SRC="/img/fbpe/imme/v40n3/art01mr1.gif" WIDTH=36 HEIGHT=22>para la regla del 30%: (a) <IMG SRC="/img/fbpe/imme/v40n3/art01RCSC1a.gif" WIDTH=60 HEIGHT=22>para todo <FONT FACE="Times New Roman" SIZE=4>&#947;</FONT> <SUB><FONT SIZE=4>2</SUB></FONT> ; ( b) <IMG SRC="/img/fbpe/imme/v40n3/art01RCSC1b.gif" WIDTH=60 HEIGHT=22>para <IMG SRC="/img/fbpe/imme/v40n3/art01ms7.gif" WIDTH=17 HEIGHT=21>= 0.5; (c) <IMG SRC="/img/fbpe/imme/v40n3/art01RCSC1b.gif" WIDTH=60 HEIGHT=22>para <IMG SRC="/img/fbpe/imme/v40n3/art01ms7.gif" WIDTH=17 HEIGHT=21>= 0.65; (d) <IMG SRC="/img/fbpe/imme/v40n3/art01RCSC1b.gif" WIDTH=60 HEIGHT=22>para <IMG SRC="/img/fbpe/imme/v40n3/art01ms7.gif" WIDTH=17 HEIGHT=21>= 0.8.</P>     
<P ALIGN="CENTER">&nbsp;</P> </B>    <P ALIGN="JUSTIFY">&nbsp;&nbsp;&nbsp; La cota inferior es igual a la del caso de respuesta vertical nula [L&oacute;pez et al., 2001; L&oacute;pez y Hern&aacute;ndez, 2001 b]<I> </I>mientras que la cota superior es una funci&oacute;n cercana a la de ese caso <IMG SRC="/img/fbpe/imme/v40n3/art01fc1a.gif" WIDTH=84 HEIGHT=29><IMG SRC="/img/fbpe/imme/v40n3/art01raiz.gif" WIDTH=66 HEIGHT=28>. Las subestimaciones no pasan de 8.1%, mientras que las sobreestimaciones alcanzan hasta un 20.1% cuando <IMG SRC="/img/fbpe/imme/v40n3/art01ms7a.gif" WIDTH=49 HEIGHT=21>, un 14.1% para <IMG SRC="/img/fbpe/imme/v40n3/art01ms7b.gif" WIDTH=56 HEIGHT=21>, y un 10.9% para <IMG SRC="/img/fbpe/imme/v40n3/art01ms7c.gif" WIDTH=49 HEIGHT=21>. </P> <B>    
<P ALIGN="JUSTIFY">5.3 Regla del 40%</P> </B>    <P ALIGN="JUSTIFY">&nbsp;&nbsp;&nbsp; Aplicando la regla del 40% siempre resultan sobreestimaciones de <IMG SRC="/img/fbpe/imme/v40n3/art01sbr3.gif" WIDTH=18 HEIGHT=22>, salvo pocos casos con subestimaciones escasas. La <A HREF="#F5">Figura 5</A> muestra las variaciones de <IMG SRC="/img/fbpe/imme/v40n3/art01RCSC1a.gif" WIDTH=64 HEIGHT=22>y <IMG SRC="/img/fbpe/imme/v40n3/art01mv1.gif" WIDTH=60 HEIGHT=24>en funci&oacute;n de &#946; , para valores de <IMG SRC="/img/fbpe/imme/v40n3/art01vp1.gif" WIDTH=17 HEIGHT=24>entre 0 y 10, y <IMG SRC="/img/fbpe/imme/v40n3/art01ms7.gif" WIDTH=17 HEIGHT=21>igual a 0.5, 0.65 y 0.8. El cociente <IMG SRC="/img/fbpe/imme/v40n3/art01-490.gif" WIDTH=38 HEIGHT=22>puede aumentar o disminuir por efecto de la respuesta a la componente vertical <IMG SRC="/img/fbpe/imme/v40n3/art01-491.gif" WIDTH=49 HEIGHT=24>respecto del caso con dicha respuesta nula <IMG SRC="/img/fbpe/imme/v40n3/art01-492.gif" WIDTH=49 HEIGHT=24>detallada en [L&oacute;pez et al., 2001; L&oacute;pez y Hern&aacute;ndez, 2001 b]. Los valores de <IMG SRC="/img/fbpe/imme/v40n3/art01mv1.gif" WIDTH=60 HEIGHT=24>tienden a crecer al pasar <IMG SRC="/img/fbpe/imme/v40n3/art01vp1.gif" WIDTH=17 HEIGHT=24>de 0 a ~0.4; disminuyen con <IMG SRC="/img/fbpe/imme/v40n3/art01vp1.gif" WIDTH=17 HEIGHT=24>de ~0.4 a 1; vuelven a crecer para <IMG SRC="/img/fbpe/imme/v40n3/art01vp1.gif" WIDTH=17 HEIGHT=24>de 1 a ~2, para tender a 1 <IMG SRC="/img/fbpe/imme/v40n3/art01pt1.gif" WIDTH=60 HEIGHT=22>con valores grandes de <IMG SRC="/img/fbpe/imme/v40n3/art01vp1.gif" WIDTH=17 HEIGHT=24>.</P>     
<P ALIGN="JUSTIFY">Mediante manipulaci&oacute;n algebraica de la expresi&oacute;n (12), usando las funciones f, <IMG SRC="/img/fbpe/imme/v40n3/art01rf2.gif" WIDTH=16 HEIGHT=21>y <IMG SRC="/img/fbpe/imme/v40n3/art01rf3.gif" WIDTH=17 HEIGHT=21>derivadas de la expresi&oacute;n (8), obtenemos las siguientes cotas inferior y superior de la relaci&oacute;n <IMG SRC="/img/fbpe/imme/v40n3/art01mr1.gif" WIDTH=38 HEIGHT=22>para el c<FONT FACE="Times New Roman">onjunto de valores posibles de &#946; y <IMG SRC="/img/fbpe/imme/v40n3/art01vp1.gif" WIDTH=17 HEIGHT=24></FONT>y un valor prefijado de<I> <IMG SRC="/img/fbpe/imme/v40n3/art01ms7.gif" WIDTH=17 HEIGHT=21></I>:</P>     
<P ALIGN="CENTER"><IMG SRC="/img/fbpe/imme/v40n3/art01-503.gif" WIDTH=304 HEIGHT=29>; <IMG SRC="/img/fbpe/imme/v40n3/art01-504.gif" WIDTH=86 HEIGHT=21>(15).</P> <B>    
<P ALIGN="JUSTIFY"><A NAME="F5"></A></P> </B>    <P ALIGN="CENTER"><A HREF="http:///"><IMG SRC="http:/img/fbpe/imme/v40n3/art01fig5a.gif" BORDER=0 WIDTH=289 HEIGHT=234></A><IMG SRC="http:/img/fbpe/imme/v40n3/art01fig5b.gif" WIDTH=289 HEIGHT=237></P>     ]]></body>
<body><![CDATA[<P ALIGN="CENTER"><IMG SRC="/img/fbpe/imme/v40n3/art01fig5c.gif" WIDTH=289 HEIGHT=252><IMG SRC="/img/fbpe/imme/v40n3/art01fig5d.gif" WIDTH=289 HEIGHT=252></P> <B>    
<P ALIGN="CENTER">Figura 5. Cotas de <IMG SRC="/img/fbpe/imme/v40n3/art01mr1.gif" WIDTH=36 HEIGHT=22>para la regla del 40%: (a) <IMG SRC="/img/fbpe/imme/v40n3/art01RCSC1a.gif" WIDTH=60 HEIGHT=22>para todo <IMG SRC="/img/fbpe/imme/v40n3/art01ms7.gif" WIDTH=17 HEIGHT=21>; ( b) <IMG SRC="/img/fbpe/imme/v40n3/art01RCSC1b.gif" WIDTH=60 HEIGHT=22>para <IMG SRC="/img/fbpe/imme/v40n3/art01ms7.gif" WIDTH=20 HEIGHT=22>= 0.5; (c) <IMG SRC="/img/fbpe/imme/v40n3/art01RCSC1b.gif" WIDTH=60 HEIGHT=22>para <IMG SRC="/img/fbpe/imme/v40n3/art01ms7.gif" WIDTH=17 HEIGHT=21>= 0.65; (d) <IMG SRC="/img/fbpe/imme/v40n3/art01RCSC1b.gif" WIDTH=60 HEIGHT=22>para <IMG SRC="/img/fbpe/imme/v40n3/art01ms7.gif" WIDTH=17 HEIGHT=21>= 0.8</P>     
<P ALIGN="CENTER">&nbsp;</P> </B>    <P ALIGN="JUSTIFY">&nbsp;&nbsp;&nbsp; La cota inferior es igual a la del caso de respuesta vertical nula [L&oacute;pez et al., 2001; L&oacute;pez y Hern&aacute;ndez, 2001 b],<I> </I>mientras que la cota superior es una funci&oacute;n cercana a la de ese caso <IMG SRC="/img/fbpe/imme/v40n3/art01-509.gif" WIDTH=84 HEIGHT=29><IMG SRC="/img/fbpe/imme/v40n3/art01-510.gif" WIDTH=65 HEIGHT=25>. Las subestimaciones nunca sobrepasan el 1%, mientras que las sobreestimaciones pueden ir desde un 31.5% cuando <IMG SRC="/img/fbpe/imme/v40n3/art01ms7a.gif" WIDTH=49 HEIGHT=21>, un 24% para <IMG SRC="/img/fbpe/imme/v40n3/art01ms7b.gif" WIDTH=56 HEIGHT=21>, hasta un 18.7% para <IMG SRC="/img/fbpe/imme/v40n3/art01ms7c.gif" WIDTH=49 HEIGHT=21>. </P> <B><FONT SIZE=4>    
<P ALIGN="JUSTIFY">&nbsp;</B></FONT> <B>5.4 Regla IBC#1</P> </B>    <P ALIGN="JUSTIFY">&nbsp;&nbsp;&nbsp; Los resultados presentados en la <A HREF="#F6">Figura 6</A> indican que la regla IBC#1 sobreestima la respuesta cr&iacute;tica para peque&ntilde;os <IMG SRC="/img/fbpe/imme/v40n3/art01vp1.gif" WIDTH=17 HEIGHT=24>, pero conduce a grandes subestimaciones para valores grandes del mismo. La sobreestimaci&oacute;n aumenta al variar <IMG SRC="/img/fbpe/imme/v40n3/art01vp1.gif" WIDTH=17 HEIGHT=24>de 0 a ~0.3, para disminuir luego con mayores valores de <IMG SRC="/img/fbpe/imme/v40n3/art01vp1.gif" WIDTH=17 HEIGHT=24>. Para <IMG SRC="/img/fbpe/imme/v40n3/art01vp1.gif" WIDTH=17 HEIGHT=24 align="bottom">=1 la mayor subestimaci&oacute;n es solo de 8.1%, pero se incrementa en gran medida para valores grandes de <IMG SRC="/img/fbpe/imme/v40n3/art01vp1.gif" WIDTH=17 HEIGHT=24>.</P> <B>    
<P ALIGN="JUSTIFY">&nbsp;</P>     <P ALIGN="JUSTIFY"><A NAME="F6"></A></P> </B>    <P ALIGN="CENTER"><IMG SRC="/img/fbpe/imme/v40n3/art01fig6a.gif" WIDTH=289 HEIGHT=234><IMG SRC="/img/fbpe/imme/v40n3/art01fig6b.gif" WIDTH=289 HEIGHT=234></P>     
<P ALIGN="CENTER"><IMG SRC="/img/fbpe/imme/v40n3/art01fig6c.gif" WIDTH=289 HEIGHT=252><IMG SRC="/img/fbpe/imme/v40n3/art01fig6d.gif" WIDTH=289 HEIGHT=252></P> <B>    
]]></body>
<body><![CDATA[<P ALIGN="CENTER">Figura 6. Cotas de <IMG SRC="/img/fbpe/imme/v40n3/art01mr1.gif" WIDTH=36 HEIGHT=22>para la regla IBC#1 : (a) <IMG SRC="/img/fbpe/imme/v40n3/art01RCSC1a.gif" WIDTH=60 HEIGHT=22>para todo <IMG SRC="/img/fbpe/imme/v40n3/art01ms7.gif" WIDTH=17 HEIGHT=21>; ( b) <IMG SRC="/img/fbpe/imme/v40n3/art01RCSC1b.gif" WIDTH=60 HEIGHT=22>para <IMG SRC="/img/fbpe/imme/v40n3/art01ms7.gif" WIDTH=17 HEIGHT=21>= 0.5; (c) <IMG SRC="/img/fbpe/imme/v40n3/art01mv1.gif" WIDTH=60 HEIGHT=22>para <IMG SRC="/img/fbpe/imme/v40n3/art01ms7.gif" WIDTH=17 HEIGHT=21>= 0.65; (d) <IMG SRC="/img/fbpe/imme/v40n3/art01mv1.gif" WIDTH=60 HEIGHT=22>para <IMG SRC="/img/fbpe/imme/v40n3/art01ms7.gif" WIDTH=17 HEIGHT=21>= 0.8</P>     
<P ALIGN="CENTER">&nbsp;</P> </B>    <P ALIGN="JUSTIFY">&nbsp;&nbsp;&nbsp; Mediante manipulaci&oacute;n algebraica de la expresi&oacute;n (12), usando las funciones f, <IMG SRC="/img/fbpe/imme/v40n3/art01rf2.gif" WIDTH=16 HEIGHT=21>y <IMG SRC="/img/fbpe/imme/v40n3/art01rf3.gif" WIDTH=17 HEIGHT=21>derivadas de la expresi&oacute;n (9), obtenemos las siguientes cotas inferior y superior de la relaci&oacute;n <IMG SRC="/img/fbpe/imme/v40n3/art01mr1.gif" WIDTH=38 HEIGHT=22><FONT FACE="Times New Roman">para el conjunto de valores posibles de &#946;</FONT><I> </I>y <IMG SRC="/img/fbpe/imme/v40n3/art01vp1.gif" WIDTH=17 HEIGHT=24>y un valor prefijado de<I> <IMG SRC="/img/fbpe/imme/v40n3/art01ms7.gif" WIDTH=17 HEIGHT=21></I>:</P>     
<P ALIGN="CENTER"><IMG SRC="/img/fbpe/imme/v40n3/art01-529.gif" WIDTH=212 HEIGHT=22>; <IMG SRC="/img/fbpe/imme/v40n3/art01csh14b.gif" WIDTH=88 HEIGHT=21>(16)</P>     
<P ALIGN="JUSTIFY">&nbsp;&nbsp;&nbsp; La tan peque&ntilde;a cota inferior est&aacute; gobernada por el t&eacute;rmino <IMG SRC="/img/fbpe/imme/v40n3/art01-531.gif" WIDTH=32 HEIGHT=21>de la expresi&oacute;n (9); la cota superior se aproxima linealmente pues la expresi&oacute;n exacta es muy compleja. Las subestimaciones pueden llegar a valer tanto como 70%, mientras que las sobreestimaciones pueden llegar hasta un m&aacute;ximo de 30% cuando <IMG SRC="/img/fbpe/imme/v40n3/art01ms7a.gif" WIDTH=49 HEIGHT=21>, un 22.3% para <IMG SRC="/img/fbpe/imme/v40n3/art01ms7b.gif" WIDTH=56 HEIGHT=21>, y 14.4% para <IMG SRC="/img/fbpe/imme/v40n3/art01ms7c.gif" WIDTH=49 HEIGHT=21>. Es de inter&eacute;s observar que para valores grandes de <IMG SRC="/img/fbpe/imme/v40n3/art01vp1.gif" WIDTH=18 HEIGHT=24>esta regla subestima la respuesta cr&iacute;tica en todas las situaciones. Estas situaciones de subestimaci&oacute;n se compensan parcialmente mediante las combinaciones de dise&ntilde;o normativas, gracias a la adici&oacute;n de las correspondientes solicitaciones gravitacionales a cada solicitaci&oacute;n s&iacute;smica, conduciendo a una menor subestimaci&oacute;n de las solicitaciones combinadas que de una solicitaci&oacute;n s&iacute;smica aislada. </P> <B>    
<P ALIGN="JUSTIFY">6. EJEMPLO</P> </B>    <P ALIGN="JUSTIFY">&nbsp;&nbsp;&nbsp; A continuaci&oacute;n ilustramos las comparaciones de las reglas de combinaci&oacute;n s&iacute;smicas mediante un caso sencillo pero de caracter&iacute;sticas reales. Sea una plataforma de un piso formada por una losa rectangular de lados 8.00 m y 5.00 m y espesor 0.17 m, apoyada en cuatro vigas que a su vez apoyan en cuatro columnas de 4 m de altura (<A HREF="#F7">Figura 7</A>). La secci&oacute;n de las vigas es de 0.40 m de ancho por 0.65 m de altura, y la de las columnas es de 0.60 m por lado. El material de los elementos estructurales es concreto armado con f'<SUB>c</SUB> = 27.5 MPa. La plataforma se dise&ntilde;a para soportar equipos con una carga distribuida de 5.64 kN/m2 en el &aacute;rea de la losa y una carga concentrada de 480 kN en el centro de la misma.</P>     <P ALIGN="JUSTIFY">&nbsp;&nbsp;&nbsp; Conviene anotar que en un modelo de un piso puede evaluarse el comportamiento de pr&aacute;cticamente cualquier tipo de respuesta, respecto al problema que nos ocupa. Lo que interesa evaluar es la sensibilidad a la componente vertical del sismo y a las direcciones de incidencia de las componentes s&iacute;smicas. Ella depende de la raz&oacute;n de las respuestas a la componente vertical y a la componente horizontal mayor, <IMG SRC="/img/fbpe/imme/v40n3/art01vp1.gif" WIDTH=17 HEIGHT=24>, y de la correlaci&oacute;n entre las respuestas a cada par de componentes horizontales, <IMG SRC="/img/fbpe/imme/v40n3/art01-537.gif" WIDTH=60 HEIGHT=25>. Estos par&aacute;metros pueden tomar el mismo rango de valores en edificaciones de un piso y de varios pisos. En consecuencia, los resultados que se muestren con un sistema de un piso son semejantes a los que se obtendr&iacute;an con sistemas de varios pisos. </P> <B><FONT SIZE=4>    
<P ALIGN="JUSTIFY">&nbsp;<A NAME="F7"></A></P> </B></FONT>    <P ALIGN="CENTER"><IMG SRC="/img/fbpe/imme/v40n3/art01fig7.gif" WIDTH=324 HEIGHT=312></P> <B>    
]]></body>
<body><![CDATA[<P ALIGN="CENTER">Figura 7. Planta de plataforma de un piso</P>     <P ALIGN="CENTER">&nbsp;</P> </B>    <P ALIGN="JUSTIFY">&nbsp;&nbsp;&nbsp; Consideramos la estructura sometida a un sismo cercano con tres componentes, dos horizontales que pueden obrar seg&uacute;n cualquier direcci&oacute;n en su plano y una vertical (<A HREF="#F1">Figura 1(b)</A>). Definimos el espectro <IMG SRC="/img/fbpe/imme/v40n3/art01ms3.gif" WIDTH=32 HEIGHT=20>en t&eacute;rminos de pseudoaceleraci&oacute;n (<A HREF="#F8">Figura 8(a)</A>) para la aceleraci&oacute;n, velocidad y desplazamientos picos del terreno iguales a 0.5 g, 61 cm/seg y 45.7 cm respectivamente, percentil de 84.1 % y coeficiente de amortiguamiento de 5 %. La componente s&iacute;smica <I>1 </I>est&aacute; caracterizada por el espectro <IMG SRC="/img/fbpe/imme/v40n3/art01ms3.gif" WIDTH=32 HEIGHT=20>y la componente <I>2</I> por <IMG SRC="/img/fbpe/imme/v40n3/art01-541.gif" WIDTH=65 HEIGHT=21>donde <IMG SRC="/img/fbpe/imme/v40n3/art01-542.gif" WIDTH=36 HEIGHT=21>la tomamos de la l&iacute;nea de campo cercano de la <A HREF="#F2">Figura 2</A>. Igualmente utilizamos un espectro t&iacute;pico de campo cercano <IMG SRC="/img/fbpe/imme/v40n3/art01ms6.gif" WIDTH=38 HEIGHT=21>(<A HREF="#F8">Figura 8(b)</A>) para caracterizar a la componente vertical <IMG SRC="/img/fbpe/imme/v40n3/art01ms5.gif" WIDTH=34 HEIGHT=16>.</P> <B>    
<P ALIGN="JUSTIFY"><A NAME="F8"></A></P> </B>    <P ALIGN="CENTER"><IMG SRC="/img/fbpe/imme/v40n3/art01fig8a.gif" WIDTH=257 HEIGHT=312><IMG SRC="/img/fbpe/imme/v40n3/art01fig8b.gif" WIDTH=257 HEIGHT=312></P> <B>    
<P ALIGN="CENTER">Figura 8. Espectros de pseudoaceleraci&oacute;n para campo cercano: (a) de la componente mayor horizontal <I>1</I>; (b) de la componente vertical <I>3=Z</P> </I>    <P ALIGN="JUSTIFY"><A NAME="T1"></A></P>     <P ALIGN="CENTER">TABLA 1. Modos significativos y sus valores b&aacute;sicos</P></B>     <P ALIGN="CENTER">    <CENTER><TABLE BORDER CELLSPACING=1 CELLPADDING=1 WIDTH=577> <TR><TD WIDTH="12%" VALIGN="MIDDLE" ROWSPAN=3 HEIGHT=47> <B>    ]]></body>
<body><![CDATA[<P ALIGN="JUSTIFY">Modo</P>     <P ALIGN="JUSTIFY">(<I>i</I>)</B></TD> <TD WIDTH="14%" VALIGN="MIDDLE" ROWSPAN=3 HEIGHT=47>     <P ALIGN="JUSTIFY"><IMG SRC="/img/fbpe/imme/v40n3/art01-547.gif" WIDTH=17 HEIGHT=24></P> <B>    
<P ALIGN="JUSTIFY">(seg)</B></TD> <TD WIDTH="45%" VALIGN="TOP" COLSPAN=3 HEIGHT=47> <B>    <P ALIGN="JUSTIFY">Valores espectrales</B></TD> <TD WIDTH="29%" VALIGN="MIDDLE" COLSPAN=3 ROWSPAN=2 HEIGHT=47> <B>    <P ALIGN="JUSTIFY">Masas participativas</P>     <P ALIGN="JUSTIFY">(%)</B></TD> </TR> <TR><TD WIDTH="14%" VALIGN="MIDDLE" ROWSPAN=2 HEIGHT=47>     <P ALIGN="JUSTIFY"><IMG SRC="/img/fbpe/imme/v40n3/art01-548.gif" WIDTH=57 HEIGHT=24></TD> <TD WIDTH="18%" VALIGN="MIDDLE" ROWSPAN=2 HEIGHT=47> <B>    
<P ALIGN="JUSTIFY">Intensidad espectral <IMG SRC="/img/fbpe/imme/v40n3/art01-549.gif" WIDTH=22 HEIGHT=24></B></TD> <TD WIDTH="14%" VALIGN="MIDDLE" ROWSPAN=2 HEIGHT=47>     
<P ALIGN="JUSTIFY"><IMG SRC="/img/fbpe/imme/v40n3/art01-550.gif" WIDTH=62 HEIGHT=23></TD> </TR> <TR><TD WIDTH="10%" VALIGN="TOP" HEIGHT=8> <B><I>    
]]></body>
<body><![CDATA[<P ALIGN="JUSTIFY">X</B></I></TD> <TD WIDTH="10%" VALIGN="TOP" HEIGHT=8> <B><I>    <P ALIGN="JUSTIFY">Y</B></I></TD> <TD WIDTH="10%" VALIGN="TOP" HEIGHT=8> <B><I>    <P ALIGN="JUSTIFY">Z</B></I></TD> </TR> <TR><TD WIDTH="12%" VALIGN="TOP" HEIGHT=17>     <P ALIGN="JUSTIFY">1</TD> <TD WIDTH="14%" VALIGN="TOP" HEIGHT=17>     <P ALIGN="JUSTIFY">0.2874</TD> <TD WIDTH="14%" VALIGN="TOP" HEIGHT=17>     <P ALIGN="JUSTIFY">1.355</TD> <TD WIDTH="18%" VALIGN="TOP" HEIGHT=17>     <P ALIGN="JUSTIFY">0.701</TD> <TD WIDTH="14%" VALIGN="TOP" HEIGHT=17>     <P ALIGN="JUSTIFY">1.200</TD> <TD WIDTH="10%" VALIGN="TOP" HEIGHT=17>     <P ALIGN="JUSTIFY">0</TD> <TD WIDTH="10%" VALIGN="TOP" HEIGHT=17>     <P ALIGN="JUSTIFY">84.58</TD> <TD WIDTH="10%" VALIGN="TOP" HEIGHT=17>     ]]></body>
<body><![CDATA[<P ALIGN="JUSTIFY">0</TD> </TR> <TR><TD WIDTH="12%" VALIGN="TOP" HEIGHT=17>     <P ALIGN="JUSTIFY">2</TD> <TD WIDTH="14%" VALIGN="TOP" HEIGHT=17>     <P ALIGN="JUSTIFY">0.2632</TD> <TD WIDTH="14%" VALIGN="TOP" HEIGHT=17>     <P ALIGN="JUSTIFY">1.355</TD> <TD WIDTH="18%" VALIGN="TOP" HEIGHT=17>     <P ALIGN="JUSTIFY">0.701</TD> <TD WIDTH="14%" VALIGN="TOP" HEIGHT=17>     <P ALIGN="JUSTIFY">1.200</TD> <TD WIDTH="10%" VALIGN="TOP" HEIGHT=17>     <P ALIGN="JUSTIFY">0</TD> <TD WIDTH="10%" VALIGN="TOP" HEIGHT=17>     <P ALIGN="JUSTIFY">0</TD> <TD WIDTH="10%" VALIGN="TOP" HEIGHT=17>     <P ALIGN="JUSTIFY">62.99</TD> </TR> <TR><TD WIDTH="12%" VALIGN="TOP" HEIGHT=17>     <P ALIGN="JUSTIFY">3</TD> <TD WIDTH="14%" VALIGN="TOP" HEIGHT=17>     ]]></body>
<body><![CDATA[<P ALIGN="JUSTIFY">0.2276</TD> <TD WIDTH="14%" VALIGN="TOP" HEIGHT=17>     <P ALIGN="JUSTIFY">1.355</TD> <TD WIDTH="18%" VALIGN="TOP" HEIGHT=17>     <P ALIGN="JUSTIFY">0.701</TD> <TD WIDTH="14%" VALIGN="TOP" HEIGHT=17>     <P ALIGN="JUSTIFY">1.200</TD> <TD WIDTH="10%" VALIGN="TOP" HEIGHT=17>     <P ALIGN="JUSTIFY">94.92</TD> <TD WIDTH="10%" VALIGN="TOP" HEIGHT=17>     <P ALIGN="JUSTIFY">0</TD> <TD WIDTH="10%" VALIGN="TOP" HEIGHT=17>     <P ALIGN="JUSTIFY">0</TD> </TR> <TR><TD WIDTH="12%" VALIGN="TOP" HEIGHT=17>     <P ALIGN="JUSTIFY">6</TD> <TD WIDTH="14%" VALIGN="TOP" HEIGHT=17>     <P ALIGN="JUSTIFY">0.0834</TD> <TD WIDTH="14%" VALIGN="TOP" HEIGHT=17>     <P ALIGN="JUSTIFY">0.981</TD> <TD WIDTH="18%" VALIGN="TOP" HEIGHT=17>     ]]></body>
<body><![CDATA[<P ALIGN="JUSTIFY">0.797</TD> <TD WIDTH="14%" VALIGN="TOP" HEIGHT=17>     <P ALIGN="JUSTIFY">1.046</TD> <TD WIDTH="10%" VALIGN="TOP" HEIGHT=17>     <P ALIGN="JUSTIFY">0</TD> <TD WIDTH="10%" VALIGN="TOP" HEIGHT=17>     <P ALIGN="JUSTIFY">15.37</TD> <TD WIDTH="10%" VALIGN="TOP" HEIGHT=17>     <P ALIGN="JUSTIFY">0</TD> </TR> <TR><TD WIDTH="12%" VALIGN="TOP" HEIGHT=17>     <P ALIGN="JUSTIFY">7</TD> <TD WIDTH="14%" VALIGN="TOP" HEIGHT=17>     <P ALIGN="JUSTIFY">0.0713</TD> <TD WIDTH="14%" VALIGN="TOP" HEIGHT=17>     <P ALIGN="JUSTIFY">0.871</TD> <TD WIDTH="18%" VALIGN="TOP" HEIGHT=17>     <P ALIGN="JUSTIFY">0.788</TD> <TD WIDTH="14%" VALIGN="TOP" HEIGHT=17>     <P ALIGN="JUSTIFY">0.934</TD> <TD WIDTH="10%" VALIGN="TOP" HEIGHT=17>     ]]></body>
<body><![CDATA[<P ALIGN="JUSTIFY">5.07</TD> <TD WIDTH="10%" VALIGN="TOP" HEIGHT=17>     <P ALIGN="JUSTIFY">0</TD> <TD WIDTH="10%" VALIGN="TOP" HEIGHT=17>     <P ALIGN="JUSTIFY">0</TD> </TR> <TR><TD WIDTH="12%" VALIGN="TOP" HEIGHT=17>     <P ALIGN="JUSTIFY">9</TD> <TD WIDTH="14%" VALIGN="TOP" HEIGHT=17>     <P ALIGN="JUSTIFY">0.0551</TD> <TD WIDTH="14%" VALIGN="TOP" HEIGHT=17>     <P ALIGN="JUSTIFY">0.726</TD> <TD WIDTH="18%" VALIGN="TOP" HEIGHT=17>     <P ALIGN="JUSTIFY">0.776</TD> <TD WIDTH="14%" VALIGN="TOP" HEIGHT=17>     <P ALIGN="JUSTIFY">0.783</TD> <TD WIDTH="10%" VALIGN="TOP" HEIGHT=17>     <P ALIGN="JUSTIFY">0</TD> <TD WIDTH="10%" VALIGN="TOP" HEIGHT=17>     <P ALIGN="JUSTIFY">0</TD> <TD WIDTH="10%" VALIGN="TOP" HEIGHT=17>     ]]></body>
<body><![CDATA[<P ALIGN="JUSTIFY">6.36</TD> </TR> <TR><TD WIDTH="12%" VALIGN="TOP" HEIGHT=17>     <P ALIGN="JUSTIFY">10</TD> <TD WIDTH="14%" VALIGN="TOP" HEIGHT=17>     <P ALIGN="JUSTIFY">0.0312</TD> <TD WIDTH="14%" VALIGN="TOP" HEIGHT=17>     <P ALIGN="JUSTIFY">0.500</TD> <TD WIDTH="18%" VALIGN="TOP" HEIGHT=17>     <P ALIGN="JUSTIFY">0.751</TD> <TD WIDTH="14%" VALIGN="TOP" HEIGHT=17>     <P ALIGN="JUSTIFY">0.561</TD> <TD WIDTH="10%" VALIGN="TOP" HEIGHT=17>     <P ALIGN="JUSTIFY">0</TD> <TD WIDTH="10%" VALIGN="TOP" HEIGHT=17>     <P ALIGN="JUSTIFY">0</TD> <TD WIDTH="10%" VALIGN="TOP" HEIGHT=17>     <P ALIGN="JUSTIFY">10.86</TD> </TR> <TR><TD WIDTH="12%" VALIGN="TOP" HEIGHT=17>     <P ALIGN="JUSTIFY">21</TD> <TD WIDTH="14%" VALIGN="TOP" HEIGHT=17>     ]]></body>
<body><![CDATA[<P ALIGN="JUSTIFY">0.0095</TD> <TD WIDTH="14%" VALIGN="TOP" HEIGHT=17>     <P ALIGN="JUSTIFY">0.500</TD> <TD WIDTH="18%" VALIGN="TOP" HEIGHT=17>     <P ALIGN="JUSTIFY">0.724</TD> <TD WIDTH="14%" VALIGN="TOP" HEIGHT=17>     <P ALIGN="JUSTIFY">0.550</TD> <TD WIDTH="10%" VALIGN="TOP" HEIGHT=17>     <P ALIGN="JUSTIFY">0</TD> <TD WIDTH="10%" VALIGN="TOP" HEIGHT=17>     <P ALIGN="JUSTIFY">0</TD> <TD WIDTH="10%" VALIGN="TOP" HEIGHT=17>     <P ALIGN="JUSTIFY">19.52</TD> </TR> </TABLE> </CENTER>      <P ALIGN="JUSTIFY">&nbsp;</P>     <P ALIGN="JUSTIFY">&nbsp;&nbsp;&nbsp; El sistema estructural se model&oacute; tomando 9 nodos desplazables de una malla de elementos de losa de 4 m x 2.5 m (<A HREF="#F7">Figura 7</A>), para un total de 27 grados de libertad, con elementos finitos planos para la losa y elementos lineales para las vigas y columnas. En la <A HREF="#T1">Tabla 1</A> se exponen los periodos propios significativos con sus respectivas masas participativas a cada componente s&iacute;smica y los valores espectrales ante los espectros <IMG SRC="/img/fbpe/imme/v40n3/art01ms3.gif" WIDTH=32 HEIGHT=20>y <IMG SRC="/img/fbpe/imme/v40n3/art01ms6.gif" WIDTH=38 HEIGHT=21>.</P>     
<P ALIGN="JUSTIFY">&nbsp;&nbsp;&nbsp; Como respuestas <I>r</I> a estudiar escogemos: a) la fuerza axial de la columna inferior izquierda de la <A HREF="#F7">Figura 7</A> (tomada positiva para compresi&oacute;n); b) la fuerza cortante de direcci&oacute;n <I>X</I> en la misma columna; c) el momento flector seg&uacute;n el eje <I>X</I> en el tope de la misma columna; d) la fuerza cortante de direcci&oacute;n <I>Z </I>en un extremo de la viga inferior de direcci&oacute;n <I>X</I>; y e) el momento flector seg&uacute;n el eje <I>Y</I> de la misma viga.&nbsp;&nbsp;&nbsp;&nbsp;&nbsp;&nbsp;&nbsp;&nbsp;&nbsp;&nbsp;&nbsp;&nbsp;&nbsp;&nbsp;&nbsp;&nbsp;&nbsp;&nbsp;&nbsp;&nbsp;&nbsp;&nbsp;&nbsp;&nbsp;&nbsp;&nbsp;&nbsp;&nbsp;&nbsp;&nbsp;&nbsp;&nbsp;&nbsp;&nbsp;&nbsp;&nbsp;&nbsp;&nbsp;&nbsp;&nbsp;&nbsp;&nbsp;&nbsp;&nbsp;&nbsp;&nbsp;&nbsp;&nbsp;&nbsp;&nbsp;&nbsp;&nbsp;&nbsp;&nbsp;&nbsp;&nbsp;&nbsp;&nbsp;&nbsp;&nbsp;&nbsp;</P>     ]]></body>
<body><![CDATA[<P ALIGN="JUSTIFY">&nbsp;&nbsp;&nbsp; En la <A HREF="#T2">Tabla 2</A> se presentan las respuestas <IMG SRC="/img/fbpe/imme/v40n3/art01exp1.gif" WIDTH=17 HEIGHT=24>de los modos de vibraci&oacute;n <I>i</I> ante cada componente s&iacute;smica horizontal (<I>k</I> = <I>X</I>,<I> Y</I>) de espectro <IMG SRC="/img/fbpe/imme/v40n3/art01ms3.gif" WIDTH=32 HEIGHT=20>, y las respuestas <IMG SRC="/img/fbpe/imme/v40n3/art01exp3.gif" WIDTH=17 HEIGHT=22>de los modos <I>i</I> ante la componente vertical de espectro <IMG SRC="/img/fbpe/imme/v40n3/art01ms6.gif" WIDTH=38 HEIGHT=21>.</P> <B>    
<P ALIGN="CENTER"><A NAME="T2"></A></P>     <P ALIGN="CENTER">TABLA 2. Valores de las respuestas modales espectrales</B> </P>     <P ALIGN="CENTER">    <CENTER><TABLE BORDER CELLSPACING=1 CELLPADDING=4 WIDTH=661> <TR><TD WIDTH="19%" VALIGN="TOP" ROWSPAN=2> <B>    <P ALIGN="JUSTIFY">RESPUESTA</B></TD> <TD WIDTH="11%" VALIGN="TOP" ROWSPAN=2> <B>    <P ALIGN="JUSTIFY">Direc. comp. s&iacute;sm.</B></TD> <TD WIDTH="71%" VALIGN="TOP" COLSPAN=8> <B>    <P ALIGN="JUSTIFY">M O D O S D E V I B R A C I &Oacute; N</B></TD> </TR> <TR><TD WIDTH="9%" VALIGN="TOP"> <B>    <P ALIGN="JUSTIFY">1</B></TD> <TD WIDTH="9%" VALIGN="TOP"> <B>    <P ALIGN="JUSTIFY">2</B></TD> <TD WIDTH="9%" VALIGN="TOP"> <B>    ]]></body>
<body><![CDATA[<P ALIGN="JUSTIFY">3</B></TD> <TD WIDTH="9%" VALIGN="TOP"> <B>    <P ALIGN="JUSTIFY">6</B></TD> <TD WIDTH="9%" VALIGN="TOP"> <B>    <P ALIGN="JUSTIFY">7</B></TD> <TD WIDTH="9%" VALIGN="TOP"> <B>    <P ALIGN="JUSTIFY">9</B></TD> <TD WIDTH="9%" VALIGN="TOP"> <B>    <P ALIGN="JUSTIFY">10</B></TD> <TD WIDTH="9%" VALIGN="TOP"> <B>    <P ALIGN="JUSTIFY">21</B></TD> </TR> <TR><TD WIDTH="19%" VALIGN="TOP" ROWSPAN=3 HEIGHT=27> <B>    <P ALIGN="JUSTIFY">Fuerza axial en columna (kN)</B></TD> <TD WIDTH="11%" VALIGN="TOP" HEIGHT=27>     <P ALIGN="JUSTIFY"><IMG SRC="/img/fbpe/imme/v40n3/art01-554.gif" WIDTH=18 HEIGHT=24></TD> <TD WIDTH="9%" VALIGN="TOP" HEIGHT=27>     
<P ALIGN="JUSTIFY">0</TD> <TD WIDTH="9%" VALIGN="TOP" HEIGHT=27>     <P ALIGN="JUSTIFY">0</TD> <TD WIDTH="9%" VALIGN="TOP" HEIGHT=27>     ]]></body>
<body><![CDATA[<P ALIGN="JUSTIFY">111.33</TD> <TD WIDTH="9%" VALIGN="TOP" HEIGHT=27>     <P ALIGN="JUSTIFY">0</TD> <TD WIDTH="9%" VALIGN="TOP" HEIGHT=27>     <P ALIGN="JUSTIFY">3.97</TD> <TD WIDTH="9%" VALIGN="TOP" HEIGHT=27>     <P ALIGN="JUSTIFY">0</TD> <TD WIDTH="9%" VALIGN="TOP" HEIGHT=27>     <P ALIGN="JUSTIFY">0.12</TD> <TD WIDTH="9%" VALIGN="TOP" HEIGHT=27>     <P ALIGN="JUSTIFY">0.10</TD> </TR> <TR><TD WIDTH="11%" VALIGN="TOP" HEIGHT=27>     <P ALIGN="JUSTIFY"><IMG SRC="/img/fbpe/imme/v40n3/art01-555.gif" WIDTH=18 HEIGHT=25></TD> <TD WIDTH="9%" VALIGN="TOP" HEIGHT=27>     
<P ALIGN="JUSTIFY">175.64</TD> <TD WIDTH="9%" VALIGN="TOP" HEIGHT=27>     <P ALIGN="JUSTIFY">0</TD> <TD WIDTH="9%" VALIGN="TOP" HEIGHT=27>     <P ALIGN="JUSTIFY">0</TD> <TD WIDTH="9%" VALIGN="TOP" HEIGHT=27>     ]]></body>
<body><![CDATA[<P ALIGN="JUSTIFY">24.81</TD> <TD WIDTH="9%" VALIGN="TOP" HEIGHT=27>     <P ALIGN="JUSTIFY">0</TD> <TD WIDTH="9%" VALIGN="TOP" HEIGHT=27>     <P ALIGN="JUSTIFY">0</TD> <TD WIDTH="9%" VALIGN="TOP" HEIGHT=27>     <P ALIGN="JUSTIFY">0</TD> <TD WIDTH="9%" VALIGN="TOP" HEIGHT=27>     <P ALIGN="JUSTIFY">0.20</TD> </TR> <TR><TD WIDTH="11%" VALIGN="TOP" HEIGHT=27>     <P ALIGN="JUSTIFY"><IMG SRC="/img/fbpe/imme/v40n3/art01-556.gif" WIDTH=17 HEIGHT=24></TD> <TD WIDTH="9%" VALIGN="TOP" HEIGHT=27>     
<P ALIGN="JUSTIFY">0</TD> <TD WIDTH="9%" VALIGN="TOP" HEIGHT=27>     <P ALIGN="JUSTIFY">178.02</TD> <TD WIDTH="9%" VALIGN="TOP" HEIGHT=27>     <P ALIGN="JUSTIFY">0</TD> <TD WIDTH="9%" VALIGN="TOP" HEIGHT=27>     <P ALIGN="JUSTIFY">0</TD> <TD WIDTH="9%" VALIGN="TOP" HEIGHT=27>     ]]></body>
<body><![CDATA[<P ALIGN="JUSTIFY">0</TD> <TD WIDTH="9%" VALIGN="TOP" HEIGHT=27>     <P ALIGN="JUSTIFY">11.73</TD> <TD WIDTH="9%" VALIGN="TOP" HEIGHT=27>     <P ALIGN="JUSTIFY">14.36</TD> <TD WIDTH="9%" VALIGN="TOP" HEIGHT=27>     <P ALIGN="JUSTIFY">25.28</TD> </TR> <TR><TD WIDTH="19%" VALIGN="TOP" ROWSPAN=3 HEIGHT=27> <B>    <P ALIGN="JUSTIFY">Fuerza cortante <I>X</I> en columna (kN)</B></TD> <TD WIDTH="11%" VALIGN="TOP" HEIGHT=27>     <P ALIGN="JUSTIFY"><IMG SRC="/img/fbpe/imme/v40n3/art01-554.gif" WIDTH=18 HEIGHT=24></TD> <TD WIDTH="9%" VALIGN="TOP" HEIGHT=27>     
<P ALIGN="JUSTIFY">0</TD> <TD WIDTH="9%" VALIGN="TOP" HEIGHT=27>     <P ALIGN="JUSTIFY">0</TD> <TD WIDTH="9%" VALIGN="TOP" HEIGHT=27>     <P ALIGN="JUSTIFY">302.93</TD> <TD WIDTH="9%" VALIGN="TOP" HEIGHT=27>     <P ALIGN="JUSTIFY">0</TD> <TD WIDTH="9%" VALIGN="TOP" HEIGHT=27>     ]]></body>
<body><![CDATA[<P ALIGN="JUSTIFY">10.41</TD> <TD WIDTH="9%" VALIGN="TOP" HEIGHT=27>     <P ALIGN="JUSTIFY">0</TD> <TD WIDTH="9%" VALIGN="TOP" HEIGHT=27>     <P ALIGN="JUSTIFY">0</TD> <TD WIDTH="9%" VALIGN="TOP" HEIGHT=27>     <P ALIGN="JUSTIFY">0</TD> </TR> <TR><TD WIDTH="11%" VALIGN="TOP" HEIGHT=27>     <P ALIGN="JUSTIFY"><IMG SRC="/img/fbpe/imme/v40n3/art01-555.gif" WIDTH=18 HEIGHT=25></TD> <TD WIDTH="9%" VALIGN="TOP" HEIGHT=27>     
<P ALIGN="JUSTIFY">5.74</TD> <TD WIDTH="9%" VALIGN="TOP" HEIGHT=27>     <P ALIGN="JUSTIFY">0</TD> <TD WIDTH="9%" VALIGN="TOP" HEIGHT=27>     <P ALIGN="JUSTIFY">0</TD> <TD WIDTH="9%" VALIGN="TOP" HEIGHT=27>     <P ALIGN="JUSTIFY">1.11</TD> <TD WIDTH="9%" VALIGN="TOP" HEIGHT=27>     <P ALIGN="JUSTIFY">0</TD> <TD WIDTH="9%" VALIGN="TOP" HEIGHT=27>     ]]></body>
<body><![CDATA[<P ALIGN="JUSTIFY">0</TD> <TD WIDTH="9%" VALIGN="TOP" HEIGHT=27>     <P ALIGN="JUSTIFY">0</TD> <TD WIDTH="9%" VALIGN="TOP" HEIGHT=27>     <P ALIGN="JUSTIFY">0</TD> </TR> <TR><TD WIDTH="11%" VALIGN="TOP" HEIGHT=27>     <P ALIGN="JUSTIFY"><IMG SRC="/img/fbpe/imme/v40n3/art01-556.gif" WIDTH=17 HEIGHT=24></TD> <TD WIDTH="9%" VALIGN="TOP" HEIGHT=27>     
<P ALIGN="JUSTIFY">0</TD> <TD WIDTH="9%" VALIGN="TOP" HEIGHT=27>     <P ALIGN="JUSTIFY">101.90</TD> <TD WIDTH="9%" VALIGN="TOP" HEIGHT=27>     <P ALIGN="JUSTIFY">0</TD> <TD WIDTH="9%" VALIGN="TOP" HEIGHT=27>     <P ALIGN="JUSTIFY">0</TD> <TD WIDTH="9%" VALIGN="TOP" HEIGHT=27>     <P ALIGN="JUSTIFY">0</TD> <TD WIDTH="9%" VALIGN="TOP" HEIGHT=27>     <P ALIGN="JUSTIFY">6.77</TD> <TD WIDTH="9%" VALIGN="TOP" HEIGHT=27>     ]]></body>
<body><![CDATA[<P ALIGN="JUSTIFY">0.19</TD> <TD WIDTH="9%" VALIGN="TOP" HEIGHT=27>     <P ALIGN="JUSTIFY">0.19</TD> </TR> <TR><TD WIDTH="19%" VALIGN="MIDDLE" ROWSPAN=3 HEIGHT=27> <B>    <P ALIGN="JUSTIFY">Momento flector <I>X</I> en tope de columna (mkN)</B></TD> <TD WIDTH="11%" VALIGN="TOP" HEIGHT=27>     <P ALIGN="JUSTIFY"><IMG SRC="/img/fbpe/imme/v40n3/art01-554.gif" WIDTH=18 HEIGHT=24></TD> <TD WIDTH="9%" VALIGN="TOP" HEIGHT=27>     
<P ALIGN="JUSTIFY">0</TD> <TD WIDTH="9%" VALIGN="TOP" HEIGHT=27>     <P ALIGN="JUSTIFY">0</TD> <TD WIDTH="9%" VALIGN="TOP" HEIGHT=27>     <P ALIGN="JUSTIFY">4.64</TD> <TD WIDTH="9%" VALIGN="TOP" HEIGHT=27>     <P ALIGN="JUSTIFY">0</TD> <TD WIDTH="9%" VALIGN="TOP" HEIGHT=27>     <P ALIGN="JUSTIFY">0.18</TD> <TD WIDTH="9%" VALIGN="TOP" HEIGHT=27>     <P ALIGN="JUSTIFY">0</TD> <TD WIDTH="9%" VALIGN="TOP" HEIGHT=27>     ]]></body>
<body><![CDATA[<P ALIGN="JUSTIFY">0.09</TD> <TD WIDTH="9%" VALIGN="TOP" HEIGHT=27>     <P ALIGN="JUSTIFY">0.004</TD> </TR> <TR><TD WIDTH="11%" VALIGN="TOP" HEIGHT=27>     <P ALIGN="JUSTIFY"><IMG SRC="/img/fbpe/imme/v40n3/art01-555.gif" WIDTH=18 HEIGHT=25></TD> <TD WIDTH="9%" VALIGN="TOP" HEIGHT=27>     
<P ALIGN="JUSTIFY">437.53</TD> <TD WIDTH="9%" VALIGN="TOP" HEIGHT=27>     <P ALIGN="JUSTIFY">0</TD> <TD WIDTH="9%" VALIGN="TOP" HEIGHT=27>     <P ALIGN="JUSTIFY">0</TD> <TD WIDTH="9%" VALIGN="TOP" HEIGHT=27>     <P ALIGN="JUSTIFY">57.49</TD> <TD WIDTH="9%" VALIGN="TOP" HEIGHT=27>     <P ALIGN="JUSTIFY">0</TD> <TD WIDTH="9%" VALIGN="TOP" HEIGHT=27>     <P ALIGN="JUSTIFY">0</TD> <TD WIDTH="9%" VALIGN="TOP" HEIGHT=27>     <P ALIGN="JUSTIFY">0</TD> <TD WIDTH="9%" VALIGN="TOP" HEIGHT=27>     ]]></body>
<body><![CDATA[<P ALIGN="JUSTIFY">0</TD> </TR> <TR><TD WIDTH="11%" VALIGN="TOP" HEIGHT=27>     <P ALIGN="JUSTIFY"><IMG SRC="/img/fbpe/imme/v40n3/art01-556.gif" WIDTH=17 HEIGHT=24></TD> <TD WIDTH="9%" VALIGN="TOP" HEIGHT=27>     
<P ALIGN="JUSTIFY">0</TD> <TD WIDTH="9%" VALIGN="TOP" HEIGHT=27>     <P ALIGN="JUSTIFY">120.78</TD> <TD WIDTH="9%" VALIGN="TOP" HEIGHT=27>     <P ALIGN="JUSTIFY">0</TD> <TD WIDTH="9%" VALIGN="TOP" HEIGHT=27>     <P ALIGN="JUSTIFY">0</TD> <TD WIDTH="9%" VALIGN="TOP" HEIGHT=27>     <P ALIGN="JUSTIFY">0</TD> <TD WIDTH="9%" VALIGN="TOP" HEIGHT=27>     <P ALIGN="JUSTIFY">2.91</TD> <TD WIDTH="9%" VALIGN="TOP" HEIGHT=27>     <P ALIGN="JUSTIFY">11.29</TD> <TD WIDTH="9%" VALIGN="TOP" HEIGHT=27>     <P ALIGN="JUSTIFY">0.94</TD> </TR> <TR><TD WIDTH="19%" VALIGN="MIDDLE" ROWSPAN=3 HEIGHT=27> <B>    ]]></body>
<body><![CDATA[<P ALIGN="JUSTIFY">Fuerza cortante vertical en viga (kN)</B></TD> <TD WIDTH="11%" VALIGN="TOP" HEIGHT=27>     <P ALIGN="JUSTIFY"><IMG SRC="/img/fbpe/imme/v40n3/art01-554.gif" WIDTH=18 HEIGHT=24></TD> <TD WIDTH="9%" VALIGN="TOP" HEIGHT=27>     
<P ALIGN="JUSTIFY">0</TD> <TD WIDTH="9%" VALIGN="TOP" HEIGHT=27>     <P ALIGN="JUSTIFY">0</TD> <TD WIDTH="9%" VALIGN="TOP" HEIGHT=27>     <P ALIGN="JUSTIFY">100.67</TD> <TD WIDTH="9%" VALIGN="TOP" HEIGHT=27>     <P ALIGN="JUSTIFY">0</TD> <TD WIDTH="9%" VALIGN="TOP" HEIGHT=27>     <P ALIGN="JUSTIFY">3.46</TD> <TD WIDTH="9%" VALIGN="TOP" HEIGHT=27>     <P ALIGN="JUSTIFY">0</TD> <TD WIDTH="9%" VALIGN="TOP" HEIGHT=27>     <P ALIGN="JUSTIFY">0</TD> <TD WIDTH="9%" VALIGN="TOP" HEIGHT=27>     <P ALIGN="JUSTIFY">0</TD> </TR> <TR><TD WIDTH="11%" VALIGN="TOP" HEIGHT=27>     ]]></body>
<body><![CDATA[<P ALIGN="JUSTIFY"><IMG SRC="/img/fbpe/imme/v40n3/art01-555.gif" WIDTH=18 HEIGHT=25></TD> <TD WIDTH="9%" VALIGN="TOP" HEIGHT=27>     
<P ALIGN="JUSTIFY">7.60</TD> <TD WIDTH="9%" VALIGN="TOP" HEIGHT=27>     <P ALIGN="JUSTIFY">0</TD> <TD WIDTH="9%" VALIGN="TOP" HEIGHT=27>     <P ALIGN="JUSTIFY">0</TD> <TD WIDTH="9%" VALIGN="TOP" HEIGHT=27>     <P ALIGN="JUSTIFY">2.19</TD> <TD WIDTH="9%" VALIGN="TOP" HEIGHT=27>     <P ALIGN="JUSTIFY">0</TD> <TD WIDTH="9%" VALIGN="TOP" HEIGHT=27>     <P ALIGN="JUSTIFY">0</TD> <TD WIDTH="9%" VALIGN="TOP" HEIGHT=27>     <P ALIGN="JUSTIFY">0</TD> <TD WIDTH="9%" VALIGN="TOP" HEIGHT=27>     <P ALIGN="JUSTIFY">0</TD> </TR> <TR><TD WIDTH="11%" VALIGN="TOP" HEIGHT=27>     <P ALIGN="JUSTIFY"><IMG SRC="/img/fbpe/imme/v40n3/art01-556.gif" WIDTH=17 HEIGHT=24></TD> <TD WIDTH="9%" VALIGN="TOP" HEIGHT=27>     
]]></body>
<body><![CDATA[<P ALIGN="JUSTIFY">0</TD> <TD WIDTH="9%" VALIGN="TOP" HEIGHT=27>     <P ALIGN="JUSTIFY">129.21</TD> <TD WIDTH="9%" VALIGN="TOP" HEIGHT=27>     <P ALIGN="JUSTIFY">0</TD> <TD WIDTH="9%" VALIGN="TOP" HEIGHT=27>     <P ALIGN="JUSTIFY">0</TD> <TD WIDTH="9%" VALIGN="TOP" HEIGHT=27>     <P ALIGN="JUSTIFY">0</TD> <TD WIDTH="9%" VALIGN="TOP" HEIGHT=27>     <P ALIGN="JUSTIFY">11.27</TD> <TD WIDTH="9%" VALIGN="TOP" HEIGHT=27>     <P ALIGN="JUSTIFY">0.03</TD> <TD WIDTH="9%" VALIGN="TOP" HEIGHT=27>     <P ALIGN="JUSTIFY">0.31</TD> </TR> <TR><TD WIDTH="19%" VALIGN="TOP" ROWSPAN=3 HEIGHT=27> <B>    <P ALIGN="JUSTIFY">Momento flector <I>Y</I> en extremo de viga (mkN)</B></TD> <TD WIDTH="11%" VALIGN="TOP" HEIGHT=27>     <P ALIGN="JUSTIFY"><IMG SRC="/img/fbpe/imme/v40n3/art01-554.gif" WIDTH=18 HEIGHT=24></TD> <TD WIDTH="9%" VALIGN="TOP" HEIGHT=27>     
]]></body>
<body><![CDATA[<P ALIGN="JUSTIFY">0</TD> <TD WIDTH="9%" VALIGN="TOP" HEIGHT=27>     <P ALIGN="JUSTIFY">0</TD> <TD WIDTH="9%" VALIGN="TOP" HEIGHT=27>     <P ALIGN="JUSTIFY">402.39</TD> <TD WIDTH="9%" VALIGN="TOP" HEIGHT=27>     <P ALIGN="JUSTIFY">0</TD> <TD WIDTH="9%" VALIGN="TOP" HEIGHT=27>     <P ALIGN="JUSTIFY">13.83</TD> <TD WIDTH="9%" VALIGN="TOP" HEIGHT=27>     <P ALIGN="JUSTIFY">0</TD> <TD WIDTH="9%" VALIGN="TOP" HEIGHT=27>     <P ALIGN="JUSTIFY">0</TD> <TD WIDTH="9%" VALIGN="TOP" HEIGHT=27>     <P ALIGN="JUSTIFY">0</TD> </TR> <TR><TD WIDTH="11%" VALIGN="TOP" HEIGHT=27>     <P ALIGN="JUSTIFY"><IMG SRC="/img/fbpe/imme/v40n3/art01-555.gif" WIDTH=18 HEIGHT=25></TD> <TD WIDTH="9%" VALIGN="TOP" HEIGHT=27>     
<P ALIGN="JUSTIFY">13.68</TD> <TD WIDTH="9%" VALIGN="TOP" HEIGHT=27>     ]]></body>
<body><![CDATA[<P ALIGN="JUSTIFY">0</TD> <TD WIDTH="9%" VALIGN="TOP" HEIGHT=27>     <P ALIGN="JUSTIFY">0</TD> <TD WIDTH="9%" VALIGN="TOP" HEIGHT=27>     <P ALIGN="JUSTIFY">3.56</TD> <TD WIDTH="9%" VALIGN="TOP" HEIGHT=27>     <P ALIGN="JUSTIFY">0</TD> <TD WIDTH="9%" VALIGN="TOP" HEIGHT=27>     <P ALIGN="JUSTIFY">0</TD> <TD WIDTH="9%" VALIGN="TOP" HEIGHT=27>     <P ALIGN="JUSTIFY">0</TD> <TD WIDTH="9%" VALIGN="TOP" HEIGHT=27>     <P ALIGN="JUSTIFY">0</TD> </TR> <TR><TD WIDTH="11%" VALIGN="TOP" HEIGHT=27>     <P ALIGN="JUSTIFY"><IMG SRC="/img/fbpe/imme/v40n3/art01-556.gif" WIDTH=17 HEIGHT=24></TD> <TD WIDTH="9%" VALIGN="TOP" HEIGHT=27>     
<P ALIGN="JUSTIFY">0</TD> <TD WIDTH="9%" VALIGN="TOP" HEIGHT=27>     <P ALIGN="JUSTIFY">195.32</TD> <TD WIDTH="9%" VALIGN="TOP" HEIGHT=27>     ]]></body>
<body><![CDATA[<P ALIGN="JUSTIFY">0</TD> <TD WIDTH="9%" VALIGN="TOP" HEIGHT=27>     <P ALIGN="JUSTIFY">0</TD> <TD WIDTH="9%" VALIGN="TOP" HEIGHT=27>     <P ALIGN="JUSTIFY">0</TD> <TD WIDTH="9%" VALIGN="TOP" HEIGHT=27>     <P ALIGN="JUSTIFY">18.34</TD> <TD WIDTH="9%" VALIGN="TOP" HEIGHT=27>     <P ALIGN="JUSTIFY">0.06</TD> <TD WIDTH="9%" VALIGN="TOP" HEIGHT=27>     <P ALIGN="JUSTIFY">0.51</TD> </TR> </TABLE> </CENTER>      <P ALIGN="CENTER">&nbsp;</P>     <P ALIGN="justify">&nbsp;&nbsp;&nbsp; A partir de los valores modales de la <A HREF="#T2">Tabla 2</A>, en primer lugar calculamos las respuestas m&aacute;ximas probables dadas por la expresi&oacute;n (1) y el t&eacute;rmino cruzado de la expresi&oacute;n (2), ante las componentes s&iacute;smicas actuando por separado. Los valores de las respuestas y la ra&iacute;z cuadrada del t&eacute;rmino cruzado (que tiene la misma unidad de las respuestas) se muestran en la <A HREF="#T3">Tabla 3</A>, junto con las razones de respuesta (expresi&oacute;n (5); cuando<IMG SRC="/img/fbpe/imme/v40n3/art01equis.gif" WIDTH=48 HEIGHT=25>, debemos usar <IMG SRC="/img/fbpe/imme/v40n3/art01-560.gif" WIDTH=56 HEIGHT=24>y <IMG SRC="/img/fbpe/imme/v40n3/art01-561.gif" WIDTH=64 HEIGHT=25>). Luego calculamos las respuestas cr&iacute;ticas <IMG SRC="/img/fbpe/imme/v40n3/art01sb1.gif" WIDTH=18 HEIGHT=22>, de acuerdo con la regla CQC3 (expresi&oacute;n (4a) ), las cuales se presentan junto con sus &aacute;ngulos cr&iacute;ticos <IMG SRC="/img/fbpe/imme/v40n3/art01-516.gif" WIDTH=37 HEIGHT=24>asociados (expresi&oacute;n (4b) ). Para su aplicaci&oacute;n utilizamos <IMG SRC="/img/fbpe/imme/v40n3/art01-574.gif" WIDTH=62 HEIGHT=21>, correspondiente a los modos de mayor participaci&oacute;n.</P> <B>    
<P ALIGN="CENTER"><A NAME="T3"></A></P>     <P ALIGN="CENTER">TABLA 3. Respuestas m&aacute;ximas probables</B> </P>     ]]></body>
<body><![CDATA[<P ALIGN="CENTER">    <CENTER><TABLE BORDER CELLSPACING=1 CELLPADDING=4 WIDTH=556> <TR><TD WIDTH="27%" VALIGN="TOP" ROWSPAN=3> <B>    <P ALIGN="JUSTIFY">RESPUESTA</B></TD> <TD WIDTH="38%" VALIGN="TOP" COLSPAN=4> <B>    <P ALIGN="JUSTIFY">Componentes separadas</B></TD> <TD WIDTH="16%" VALIGN="TOP" COLSPAN=2 ROWSPAN=2> <B>    <P ALIGN="JUSTIFY">Razones de respuesta</B></TD> <TD WIDTH="19%" VALIGN="TOP" COLSPAN=2 ROWSPAN=2> <B>    <P ALIGN="JUSTIFY">Valores cr&iacute;ticos. Componentes simult&aacute;neas</B></TD> </TR> <TR><TD WIDTH="28%" VALIGN="TOP" COLSPAN=3>     <P ALIGN="JUSTIFY"><IMG SRC="/img/fbpe/imme/v40n3/art01ms3.gif" WIDTH=38 HEIGHT=21></TD> <TD WIDTH="10%" VALIGN="TOP">     
<P ALIGN="JUSTIFY"><IMG SRC="/img/fbpe/imme/v40n3/art01ms6.gif" WIDTH=45 HEIGHT=24></TD> </TR> <TR><TD WIDTH="9%" VALIGN="TOP">     
<P ALIGN="JUSTIFY"><IMG SRC="/img/fbpe/imme/v40n3/art01rc1.gif" WIDTH=14 HEIGHT=22></TD> <TD WIDTH="9%" VALIGN="TOP">     
<P ALIGN="JUSTIFY"><IMG SRC="/img/fbpe/imme/v40n3/art01rp2.gif" WIDTH=16 HEIGHT=24></TD> <TD WIDTH="10%" VALIGN="TOP">     
]]></body>
<body><![CDATA[<P ALIGN="JUSTIFY"><IMG SRC="/img/fbpe/imme/v40n3/art01-569.gif" WIDTH=30 HEIGHT=29></TD> <TD WIDTH="10%" VALIGN="TOP">     
<P ALIGN="JUSTIFY"><IMG SRC="/img/fbpe/imme/v40n3/art01rc3.gif" WIDTH=14 HEIGHT=21></TD> <TD WIDTH="8%" VALIGN="TOP"> <FONT FACE="Times New Roman">    
<P ALIGN="JUSTIFY">&#946;</FONT></TD> <TD WIDTH="8%" VALIGN="TOP">     <P ALIGN="JUSTIFY"><IMG SRC="/img/fbpe/imme/v40n3/art01vp1.gif" WIDTH=17 HEIGHT=24></TD> <TD WIDTH="9%" VALIGN="TOP">     
<P ALIGN="JUSTIFY"><IMG SRC="/img/fbpe/imme/v40n3/art01-516.gif" WIDTH=36 HEIGHT=38></TD> <TD WIDTH="10%" VALIGN="TOP">     
<P ALIGN="JUSTIFY"><IMG SRC="/img/fbpe/imme/v40n3/art01sb1.gif" WIDTH=18 HEIGHT=22></TD> </TR> <TR><TD WIDTH="27%" VALIGN="TOP"> <B>    
<P ALIGN="JUSTIFY">Fuerza axial en columna (kN)</B></TD> <TD WIDTH="9%" VALIGN="TOP">     <P ALIGN="JUSTIFY">111.42</TD> <TD WIDTH="9%" VALIGN="TOP">     <P ALIGN="JUSTIFY">177.49</TD> <TD WIDTH="10%" VALIGN="TOP">     <P ALIGN="JUSTIFY">110.38</TD> <TD WIDTH="10%" VALIGN="TOP">     ]]></body>
<body><![CDATA[<P ALIGN="JUSTIFY">182.59</TD> <TD WIDTH="8%" VALIGN="TOP">     <P ALIGN="JUSTIFY">0.628</TD> <TD WIDTH="8%" VALIGN="TOP">     <P ALIGN="JUSTIFY">1.029</TD> <TD WIDTH="9%" VALIGN="TOP">     <P ALIGN="JUSTIFY">64.04º</TD> <TD WIDTH="10%" VALIGN="TOP">     <P ALIGN="JUSTIFY">271.96</TD> </TR> <TR><TD WIDTH="27%" VALIGN="TOP"> <B>    <P ALIGN="JUSTIFY">Fuerza cortante <I>X</I> en columna (kN)</B></TD> <TD WIDTH="9%" VALIGN="TOP">     <P ALIGN="JUSTIFY">303.17</TD> <TD WIDTH="9%" VALIGN="TOP">     <P ALIGN="JUSTIFY">5.85</TD> <TD WIDTH="10%" VALIGN="TOP">     <P ALIGN="JUSTIFY">32.96</TD> <TD WIDTH="10%" VALIGN="TOP">     <P ALIGN="JUSTIFY">102.14</TD> <TD WIDTH="8%" VALIGN="TOP">     ]]></body>
<body><![CDATA[<P ALIGN="JUSTIFY">0.019</TD> <TD WIDTH="8%" VALIGN="TOP">     <P ALIGN="JUSTIFY">0.337</TD> <TD WIDTH="9%" VALIGN="TOP">     <P ALIGN="JUSTIFY">0.68º</TD> <TD WIDTH="10%" VALIGN="TOP">     <P ALIGN="JUSTIFY">319.95</TD> </TR> <TR><TD WIDTH="27%" VALIGN="TOP"> <B>    <P ALIGN="JUSTIFY">Momento flector <I>X</I> en tope de columna (mkN)</B></TD> <TD WIDTH="9%" VALIGN="TOP">     <P ALIGN="JUSTIFY">4.64</TD> <TD WIDTH="9%" VALIGN="TOP">     <P ALIGN="JUSTIFY">441.55</TD> <TD WIDTH="10%" VALIGN="TOP">     <P ALIGN="JUSTIFY">35.56</TD> <TD WIDTH="10%" VALIGN="TOP">     <P ALIGN="JUSTIFY">121.43</TD> <TD WIDTH="8%" VALIGN="TOP">     <P ALIGN="JUSTIFY">0.011</TD> <TD WIDTH="8%" VALIGN="TOP">     ]]></body>
<body><![CDATA[<P ALIGN="JUSTIFY">0.275</TD> <TD WIDTH="9%" VALIGN="TOP">     <P ALIGN="JUSTIFY">89.63º</TD> <TD WIDTH="10%" VALIGN="TOP">     <P ALIGN="JUSTIFY">457.96</TD> </TR> <TR><TD WIDTH="27%" VALIGN="TOP"> <B>    <P ALIGN="JUSTIFY">Fuerza cortante vertical en viga (kN)</B></TD> <TD WIDTH="9%" VALIGN="TOP">     <P ALIGN="JUSTIFY">100.75</TD> <TD WIDTH="9%" VALIGN="TOP">     <P ALIGN="JUSTIFY">7.92</TD> <TD WIDTH="10%" VALIGN="TOP">     <P ALIGN="JUSTIFY">21.94</TD> <TD WIDTH="10%" VALIGN="TOP">     <P ALIGN="JUSTIFY">129.72</TD> <TD WIDTH="8%" VALIGN="TOP">     <P ALIGN="JUSTIFY">0.079</TD> <TD WIDTH="8%" VALIGN="TOP">     <P ALIGN="JUSTIFY">1.288</TD> <TD WIDTH="9%" VALIGN="TOP">     ]]></body>
<body><![CDATA[<P ALIGN="JUSTIFY">2.73º</TD> <TD WIDTH="10%" VALIGN="TOP">     <P ALIGN="JUSTIFY">164.38</TD> </TR> <TR><TD WIDTH="27%" VALIGN="TOP"> <B>    <P ALIGN="JUSTIFY">Momento flector <I>Y</I> en extremo de viga (mkN)</B></TD> <TD WIDTH="9%" VALIGN="TOP">     <P ALIGN="JUSTIFY">402.70</TD> <TD WIDTH="9%" VALIGN="TOP">     <P ALIGN="JUSTIFY">14.15</TD> <TD WIDTH="10%" VALIGN="TOP">     <P ALIGN="JUSTIFY">58.78</TD> <TD WIDTH="10%" VALIGN="TOP">     <P ALIGN="JUSTIFY">196.21</TD> <TD WIDTH="8%" VALIGN="TOP">     <P ALIGN="JUSTIFY">0.035</TD> <TD WIDTH="8%" VALIGN="TOP">     <P ALIGN="JUSTIFY">0.487</TD> <TD WIDTH="9%" VALIGN="TOP">     <P ALIGN="JUSTIFY">1.22º</TD> <TD WIDTH="10%" VALIGN="TOP">     ]]></body>
<body><![CDATA[<P ALIGN="JUSTIFY">448.11</TD> </TR> </TABLE> </CENTER>      <P ALIGN="CENTER">&nbsp;</P>     <P ALIGN="JUSTIFY">&nbsp;&nbsp;&nbsp; Los valores de la <A HREF="#T2">Tabla 2</A> se calcularon mediante el programa de computaci&oacute;n SAP2000 [Computers and Structures, 1999]. Para obtener los t&eacute;rminos cruzados, y a partir de ellos la respuesta cr&iacute;tica (<A HREF="#T3">Tabla 3</A>), se requiere de un c&aacute;lculo suplementario que no es provisto por el programa. Conviene anotar que si en lugar de utilizar el valor constante <IMG SRC="/img/fbpe/imme/v40n3/art01-574.gif" WIDTH=62 HEIGHT=21>calcul&aacute;ramos la respuesta cr&iacute;tica "exacta" considerando los espectros exactos (<IMG SRC="/img/fbpe/imme/v40n3/art01ms7.gif" WIDTH=17 HEIGHT=21>variable) [Anastassiadis et al., 1998; L&oacute;pez y Torres, 1997] obtendr&iacute;amos resultados semejantes. Por ejemplo para el caso de la fuerza axial en la columna ese c&aacute;lculo conduce a <IMG SRC="/img/fbpe/imme/v40n3/art01-576.gif" WIDTH=96 HEIGHT=22>para un &aacute;ngulo cr&iacute;tico <IMG SRC="/img/fbpe/imme/v40n3/art01-577.gif" WIDTH=72 HEIGHT=22>. Como se puede comprobar, estos dos valores son muy cercanos a los dados por la regla CQC3 en la <A HREF="#T3">Tabla 3</A>.</P>     
<P ALIGN="JUSTIFY">&nbsp;&nbsp;&nbsp; Observemos que la fuerza axial en la columna es bastante sensible a la direcci&oacute;n de las componentes s&iacute;smicas horizontales, estando el &aacute;ngulo cr&iacute;tico en una posici&oacute;n intermedia entre los ejes <I>X</I> y <I>Y</I>; &eacute;sto se debe a que las respuestas <IMG SRC="/img/fbpe/imme/v40n3/art01rc1.gif" WIDTH=14 HEIGHT=24>y<I> <IMG SRC="/img/fbpe/imme/v40n3/art01rp2.gif" WIDTH=16 HEIGHT=25></I>tienen valores semejantes y el t&eacute;rmino cruzado <IMG SRC="/img/fbpe/imme/v40n3/art01-580.gif" WIDTH=18 HEIGHT=25>es relativamente grande. Por el contrario para las otras respuestas estudiadas es predominante la acci&oacute;n en una direcci&oacute;n principal, y en consecuencia el &aacute;ngulo cr&iacute;tico casi coincide con los ejes <I>X</I> o <I>Y</I>. En cuanto a la importancia de la respuesta a la componente vertical hemos obtenido una gama de valores <IMG SRC="/img/fbpe/imme/v40n3/art01vp1.gif" WIDTH=17 HEIGHT=24>que van desde 0.275 a 1.288, configurando una variedad de casos, desde ser poco influyente a ser dominante.</P>     
<P ALIGN="JUSTIFY">&nbsp;&nbsp;&nbsp; Calculamos ahora los valores de <IMG SRC="/img/fbpe/imme/v40n3/art01ms8.gif" WIDTH=14 HEIGHT=22>para cada regla normativa, aplicando las expresiones (6) a (9) con los valores de <IMG SRC="/img/fbpe/imme/v40n3/art01rc1.gif" WIDTH=14 HEIGHT=22>, <IMG SRC="/img/fbpe/imme/v40n3/art01rp2.gif" WIDTH=16 HEIGHT=24>y <IMG SRC="/img/fbpe/imme/v40n3/art01rc3.gif" WIDTH=14 HEIGHT=21>. Se presentan en la <A HREF="#T4">Tabla 4</A> junto con el cociente <IMG SRC="/img/fbpe/imme/v40n3/art01mr1.gif" WIDTH=36 HEIGHT=22>, el cual nos indica el grado de precisi&oacute;n de la estimaci&oacute;n de cada regla de combinaci&oacute;n. Podemos comprobar que los valores obtenidos de <IMG SRC="/img/fbpe/imme/v40n3/art01mr1.gif" WIDTH=36 HEIGHT=22>est&aacute;n comprendidos entre los valores de <IMG SRC="/img/fbpe/imme/v40n3/art01RCSC1a.gif" WIDTH=60 HEIGHT=22>y <IMG SRC="/img/fbpe/imme/v40n3/art01RCSC1b.gif" WIDTH=60 HEIGHT=22>establecidos en la Secci&oacute;n 5, interpolando adecuadamente en las <A HREF="#F3">Figuras (3)</A>,<A HREF="#F4">(4)</A>,<A HREF="#F5">(5)</A>,<A HREF="#F6">(6)</A>. Notemos que para las respuestas estudiadas: a) la regla de la RCSC da resultados casi exactos; b) la regla del 30% deriva en peque&ntilde;as subestimaciones o algo mayores sobreestimaciones, las cuales se producen cuando <IMG SRC="/img/fbpe/imme/v40n3/art01vp1.gif" WIDTH=17 HEIGHT=24>es cercano a 0.3, tal como se observ&oacute; en la <A HREF="#F4">Figura 4</A>; c) la regla del 40 % es siempre conservadora; y d) la regla del IBC#1 es conservadora para valores peque&ntilde;os de <IMG SRC="/img/fbpe/imme/v40n3/art01vp1.gif" WIDTH=17 HEIGHT=24>, pero puede conducir a subestimaciones importantes cuando <IMG SRC="/img/fbpe/imme/v40n3/art01vp1.gif" WIDTH=17 HEIGHT=24>es superior a 1. En todo caso, en esta estructura la particular correlaci&oacute;n entre las respuestas a las componentes s&iacute;smicas conduce a que las estimaciones de las reglas est&eacute;n m&aacute;s cerca de sus valores m&iacute;nimos posibles que de los m&aacute;ximos posibles.<A NAME="T4"></A></P> <B>    
<P ALIGN="CENTER">TABLA 4. Respuestas estimadas y su relaci&oacute;n con la respuesta cr&iacute;tica.</B> </P>     <P ALIGN="CENTER">    <CENTER><TABLE BORDER CELLSPACING=1 CELLPADDING=4 WIDTH=601> <TR><TD WIDTH="27%" VALIGN="TOP" ROWSPAN=3> <B>    <P ALIGN="JUSTIFY">RESPUESTA</B></TD> <TD WIDTH="73%" VALIGN="TOP" COLSPAN=8> <B>    <P ALIGN="JUSTIFY">R E G L A N O R M A T I V A</B></TD> </TR> <TR><TD WIDTH="17%" VALIGN="TOP" COLSPAN=2> <B>    ]]></body>
<body><![CDATA[<P ALIGN="JUSTIFY">SRSS</B></TD> <TD WIDTH="19%" VALIGN="TOP" COLSPAN=2> <B>    <P ALIGN="JUSTIFY">30%</B></TD> <TD WIDTH="19%" VALIGN="TOP" COLSPAN=2> <B>    <P ALIGN="JUSTIFY">40%</B></TD> <TD WIDTH="19%" VALIGN="TOP" COLSPAN=2> <B>    <P ALIGN="JUSTIFY">IBC#1</B></TD> </TR> <TR><TD WIDTH="9%" VALIGN="TOP">     <P ALIGN="JUSTIFY"><IMG SRC="/img/fbpe/imme/v40n3/art01ms8.gif" WIDTH=14 HEIGHT=22></TD> <TD WIDTH="8%" VALIGN="TOP">     
<P ALIGN="JUSTIFY"><IMG SRC="/img/fbpe/imme/v40n3/art01mr1.gif" WIDTH=36 HEIGHT=22></TD> <TD WIDTH="10%" VALIGN="TOP">     
<P ALIGN="JUSTIFY"><IMG SRC="/img/fbpe/imme/v40n3/art01ms8.gif" WIDTH=14 HEIGHT=22></TD> <TD WIDTH="9%" VALIGN="TOP">     
<P ALIGN="JUSTIFY"><IMG SRC="/img/fbpe/imme/v40n3/art01mr1.gif" WIDTH=36 HEIGHT=22></TD> <TD WIDTH="10%" VALIGN="TOP">     
<P ALIGN="JUSTIFY"><IMG SRC="/img/fbpe/imme/v40n3/art01ms8.gif" WIDTH=14 HEIGHT=22></TD> <TD WIDTH="9%" VALIGN="TOP">     
<P ALIGN="JUSTIFY"><IMG SRC="/img/fbpe/imme/v40n3/art01mr1.gif" WIDTH=36 HEIGHT=22></TD> <TD WIDTH="10%" VALIGN="TOP">     
]]></body>
<body><![CDATA[<P ALIGN="JUSTIFY"><IMG SRC="/img/fbpe/imme/v40n3/art01ms8.gif" WIDTH=14 HEIGHT=22></TD> <TD WIDTH="9%" VALIGN="TOP">     
<P ALIGN="JUSTIFY"><IMG SRC="/img/fbpe/imme/v40n3/art01mr1.gif" WIDTH=36 HEIGHT=22></TD> </TR> <TR><TD WIDTH="27%" VALIGN="TOP" HEIGHT=36> <B>    
<P ALIGN="JUSTIFY">Fuerza axial en columna (kN)</B></TD> <TD WIDTH="9%" VALIGN="TOP" HEIGHT=36>     <P ALIGN="JUSTIFY">277.95</TD> <TD WIDTH="8%" VALIGN="TOP" HEIGHT=36>     <P ALIGN="JUSTIFY">1.020</TD> <TD WIDTH="10%" VALIGN="TOP" HEIGHT=36>     <P ALIGN="JUSTIFY">269.26</TD> <TD WIDTH="9%" VALIGN="TOP" HEIGHT=36>     <P ALIGN="JUSTIFY">0.990</TD> <TD WIDTH="10%" VALIGN="TOP" HEIGHT=36>     <P ALIGN="JUSTIFY">298.15</TD> <TD WIDTH="9%" VALIGN="TOP" HEIGHT=36>     <P ALIGN="JUSTIFY">1.096</TD> <TD WIDTH="10%" VALIGN="TOP" HEIGHT=36>     <P ALIGN="JUSTIFY">264.34</TD> <TD WIDTH="9%" VALIGN="TOP" HEIGHT=36>     ]]></body>
<body><![CDATA[<P ALIGN="JUSTIFY">0.972</TD> </TR> <TR><TD WIDTH="27%" VALIGN="TOP" HEIGHT=36> <B>    <P ALIGN="JUSTIFY">Fuerza cortante <I>X</I> en columna (kN)</B></TD> <TD WIDTH="9%" VALIGN="TOP" HEIGHT=36>     <P ALIGN="JUSTIFY">319.96</TD> <TD WIDTH="8%" VALIGN="TOP" HEIGHT=36>     <P ALIGN="JUSTIFY">1.000</TD> <TD WIDTH="10%" VALIGN="TOP" HEIGHT=36>     <P ALIGN="JUSTIFY">335.56</TD> <TD WIDTH="9%" VALIGN="TOP" HEIGHT=36>     <P ALIGN="JUSTIFY">1.049</TD> <TD WIDTH="10%" VALIGN="TOP" HEIGHT=36>     <P ALIGN="JUSTIFY">346.36</TD> <TD WIDTH="9%" VALIGN="TOP" HEIGHT=36>     <P ALIGN="JUSTIFY">1.083</TD> <TD WIDTH="10%" VALIGN="TOP" HEIGHT=36>     <P ALIGN="JUSTIFY">333.87</TD> <TD WIDTH="9%" VALIGN="TOP" HEIGHT=36>     <P ALIGN="JUSTIFY">1.044</TD> </TR> <TR><TD WIDTH="27%" VALIGN="TOP" HEIGHT=36> <B>    ]]></body>
<body><![CDATA[<P ALIGN="JUSTIFY">Momento flector <I>X</I> en tope de columna (mkN)</B></TD> <TD WIDTH="9%" VALIGN="TOP" HEIGHT=36>     <P ALIGN="JUSTIFY">457.97</TD> <TD WIDTH="8%" VALIGN="TOP" HEIGHT=36>     <P ALIGN="JUSTIFY">1.000</TD> <TD WIDTH="10%" VALIGN="TOP" HEIGHT=36>     <P ALIGN="JUSTIFY">479.37</TD> <TD WIDTH="9%" VALIGN="TOP" HEIGHT=36>     <P ALIGN="JUSTIFY">1.047</TD> <TD WIDTH="10%" VALIGN="TOP" HEIGHT=36>     <P ALIGN="JUSTIFY">491.98</TD> <TD WIDTH="9%" VALIGN="TOP" HEIGHT=36>     <P ALIGN="JUSTIFY">1.074</TD> <TD WIDTH="10%" VALIGN="TOP" HEIGHT=36>     <P ALIGN="JUSTIFY">478.00</TD> <TD WIDTH="9%" VALIGN="TOP" HEIGHT=36>     <P ALIGN="JUSTIFY">1.044</TD> </TR> <TR><TD WIDTH="27%" VALIGN="TOP" HEIGHT=36> <B>    <P ALIGN="JUSTIFY">Fuerza cortante vertical en viga (kN)</B></TD> <TD WIDTH="9%" VALIGN="TOP" HEIGHT=36>     ]]></body>
<body><![CDATA[<P ALIGN="JUSTIFY">164.44</TD> <TD WIDTH="8%" VALIGN="TOP" HEIGHT=36>     <P ALIGN="JUSTIFY">1.000</TD> <TD WIDTH="10%" VALIGN="TOP" HEIGHT=36>     <P ALIGN="JUSTIFY">162.32</TD> <TD WIDTH="9%" VALIGN="TOP" HEIGHT=36>     <P ALIGN="JUSTIFY">0.987</TD> <TD WIDTH="10%" VALIGN="TOP" HEIGHT=36>     <P ALIGN="JUSTIFY">173.19</TD> <TD WIDTH="9%" VALIGN="TOP" HEIGHT=36>     <P ALIGN="JUSTIFY">1.054</TD> <TD WIDTH="10%" VALIGN="TOP" HEIGHT=36>     <P ALIGN="JUSTIFY">139.98</TD> <TD WIDTH="9%" VALIGN="TOP" HEIGHT=36>     <P ALIGN="JUSTIFY">0.852</TD> </TR> <TR><TD WIDTH="27%" VALIGN="TOP"> <B>    <P ALIGN="JUSTIFY">Momento flector <I>Y</I> en extremo de viga (mkN)</B></TD> <TD WIDTH="9%" VALIGN="TOP">     <P ALIGN="JUSTIFY">448.19</TD> <TD WIDTH="8%" VALIGN="TOP">     ]]></body>
<body><![CDATA[<P ALIGN="JUSTIFY">1.000</TD> <TD WIDTH="10%" VALIGN="TOP">     <P ALIGN="JUSTIFY">465.81</TD> <TD WIDTH="9%" VALIGN="TOP">     <P ALIGN="JUSTIFY">1.039</TD> <TD WIDTH="10%" VALIGN="TOP">     <P ALIGN="JUSTIFY">486.85</TD> <TD WIDTH="9%" VALIGN="TOP">     <P ALIGN="JUSTIFY">1.086</TD> <TD WIDTH="10%" VALIGN="TOP">     <P ALIGN="JUSTIFY">461.82</TD> <TD WIDTH="9%" VALIGN="TOP">     <P ALIGN="JUSTIFY">1.031</TD> </TR> </TABLE> </CENTER>  <B>    <P ALIGN="JUSTIFY">&nbsp;</P>     <P ALIGN="JUSTIFY">7.</B> <B>CONCLUSIONES</P> </B>    <P ALIGN="JUSTIFY">&nbsp;&nbsp;&nbsp; Se evaluaron varias reglas normativas utilizadas para combinar las respuestas a tres componentes s&iacute;smicas, dentro del marco del m&eacute;todo de an&aacute;lisis espectral. Se consider&oacute; el caso usual de que una componente principal es vertical, mientras que las dos componentes horizontales principales se supuso que pueden tener cualquier orientaci&oacute;n en el plano. Se tom&oacute; en cuenta la posible diferencia de intensidad espectral <IMG SRC="/img/fbpe/imme/v40n3/art01ms7.gif" WIDTH=17 HEIGHT=21>entre las dos componentes horizontales principales.</P>     
]]></body>
<body><![CDATA[<P ALIGN="JUSTIFY">&nbsp;&nbsp;&nbsp; Las respuestas <IMG SRC="/img/fbpe/imme/v40n3/art01ms8.gif" WIDTH=14 HEIGHT=22>estimadas por las reglas normativas se compararon con la respuesta cr&iacute;tica <IMG SRC="/img/fbpe/imme/v40n3/art01sb1.gif" WIDTH=18 HEIGHT=22>calculada m&aacute;s exactamente mediante la regla CQC3, la cual provee la m&aacute;xima respuesta para todos los &aacute;ngulos de incidencia posibles y una intensidad espectral <IMG SRC="/img/fbpe/imme/v40n3/art01ms7.gif" WIDTH=17 HEIGHT=21>dada. Se estudiaron las cotas m&aacute;xima y m&iacute;nima de la relaci&oacute;n <IMG SRC="/img/fbpe/imme/v40n3/art01mr1.gif" WIDTH=36 HEIGHT=22>considerando todos los valores posibles de la relaci&oacute;n entre las respuestas a componentes horizontales ortogonales, para los diferentes casos de intensidad espectral y los diversos grados de respuesta a la componente vertical (<IMG SRC="/img/fbpe/imme/v40n3/art01vp1.gif" WIDTH=17 HEIGHT=24>). Los resultados presentados son v&aacute;lidos para cualquier sistema estructural y cualesquiera espectros de respuesta.</P>     
<P ALIGN="JUSTIFY">&nbsp;&nbsp;&nbsp; Se desarrollaron expresiones anal&iacute;ticas para los extremos superior e inferior de la relaci&oacute;n <IMG SRC="/img/fbpe/imme/v40n3/art01mr1.gif" WIDTH=36 HEIGHT=22>, para cada regla normativa estudiada, v&aacute;lidas para toda la variaci&oacute;n posible de grados de respuesta a la componente vertical, pero particularizadas a una intensidad espectral <IMG SRC="/img/fbpe/imme/v40n3/art01ms7.gif" WIDTH=17 HEIGHT=21>fija. Por otro lado, se presentaron gr&aacute;ficamente resultados que muestran la variaci&oacute;n del cociente <IMG SRC="/img/fbpe/imme/v40n3/art01mr1.gif" WIDTH=36 HEIGHT=22>en funci&oacute;n de la relaci&oacute;n &#946; entre las respuestas a componentes horizontales ortogonales y del grado de respuesta a la componente vertical <IMG SRC="/img/fbpe/imme/v40n3/art01vp1.gif" WIDTH=17 HEIGHT=24>para diversas intensidades espectrales <IMG SRC="/img/fbpe/imme/v40n3/art01ms7.gif" WIDTH=17 HEIGHT=21>representativas.</P>     
<P ALIGN="JUSTIFY">&nbsp;&nbsp;&nbsp; Para valores de la intensidad espectral <IMG SRC="/img/fbpe/imme/v40n3/art01ms7.gif" WIDTH=17 HEIGHT=21>comprendidos entre 0.5 y 0.8, encontramos que las respuestas estimadas por la regla de la RCSC est&aacute;n entre 1 y 1.26 veces la respuesta cr&iacute;tica, las estimadas por la regla del 30% entre 0.92 y 1.20, las estimadas por la regla del 40% entre 0.99 y 1.32 y las estimadas por la regla IBC#1 entre 0.30 y 1.30 veces dicha respuesta.</P>     
<P ALIGN="JUSTIFY">&nbsp;&nbsp;&nbsp; Con respecto a la ausencia de respuesta a la componente vertical, el efecto de su presencia en la relaci&oacute;n <IMG SRC="/img/fbpe/imme/v40n3/art01mr1.gif" WIDTH=36 HEIGHT=22>es el de: a) disminuirla para la regla de la RCSC; b) aumentarla o disminuirla para las reglas del 30% y del 40%; c) aumentarla ligeramente para la regla IBC#1 cuando dicha respuesta es peque&ntilde;a, pero disminuirla enormemente cuando la misma es significativa.</P>     
<P ALIGN="JUSTIFY">&nbsp;&nbsp;&nbsp; N&oacute;tese que las reglas de la RCSC y del 40% son conservadoras, la regla del 30 % est&aacute; en una situaci&oacute;n intermedia entre conservadora y liberal, mientras que la regla IBC#1 puede ser extraordinariamente poco conservadora. Las situaciones de subestimaci&oacute;n de esta regla resultan algo compensadas mediante las combinaciones de dise&ntilde;o normativas, debido a la adici&oacute;n de las solicitaciones gravitacionales a las solicitaciones s&iacute;smicas; una evaluaci&oacute;n del grado de precisi&oacute;n de las solicitaciones combinadas requiere estudios adicionales.</P>     <P ALIGN="JUSTIFY">&nbsp;&nbsp;&nbsp; El an&aacute;lisis de un ejemplo con una estructura sencilla corrobor&oacute; los resultados te&oacute;ricos respecto al rango de estimaciones, con cierta cercan&iacute;a a los valores m&iacute;nimos debido a la particular correlaci&oacute;n entre las respuestas a las componentes s&iacute;smicas separadas. </P>     <P ALIGN="JUSTIFY">&nbsp; </P> <B><FONT SIZE=4>    <P ALIGN="JUSTIFY">8.</FONT> REFERENCIAS</P> </B>    <!-- ref --><P ALIGN="JUSTIFY">1. ASCE, American Society of Civil Engineers, ASCE Working Group on Seismic Analysis of Safety Related Nuclear Structures. Seismic Analysis of Safety Related Nuclear Structures and Commentary. NY, 1986.&nbsp;&nbsp;&nbsp;&nbsp;&nbsp;&nbsp;&nbsp;&nbsp;[&#160;<a href="javascript:void(0);" onclick="javascript: window.open('/scielo.php?script=sci_nlinks&ref=738121&pid=S0376-723X200200030000100001&lng=','','width=640,height=500,resizable=yes,scrollbars=1,menubar=yes,');">Links</a>&#160;]<!-- end-ref --><!-- ref --><P ALIGN="JUSTIFY">2. Anastassiadis K, Avramidis IE y Panetsos PK. Earthquake resistant design of structures under three-component orthotropic seismic excitation. Proceedings of the 11th European Conference on Earthquake Engineering T10, France, 1998.&nbsp;&nbsp;&nbsp;&nbsp;&nbsp;&nbsp;&nbsp;&nbsp;[&#160;<a href="javascript:void(0);" onclick="javascript: window.open('/scielo.php?script=sci_nlinks&ref=738122&pid=S0376-723X200200030000100002&lng=','','width=640,height=500,resizable=yes,scrollbars=1,menubar=yes,');">Links</a>&#160;]<!-- end-ref --><!-- ref --><P ALIGN="JUSTIFY">3. CEN, Comit&eacute; Europeo de Normalizaci&oacute;n. Euroc&oacute;digo 8: Disposiciones para el proyecto de estructuras sismorresistentes. Bruselas, B&eacute;lgica, 1998.&nbsp;&nbsp;&nbsp;&nbsp;&nbsp;&nbsp;&nbsp;&nbsp;[&#160;<a href="javascript:void(0);" onclick="javascript: window.open('/scielo.php?script=sci_nlinks&ref=738123&pid=S0376-723X200200030000100003&lng=','','width=640,height=500,resizable=yes,scrollbars=1,menubar=yes,');">Links</a>&#160;]<!-- end-ref --><!-- ref --><P ALIGN="JUSTIFY">4. Chopra AK. Dynamics of Structures: Theory and Applications to Earthquake Engineering (2nd edn). Prentice Hall: Saddle River, NY, 2001.&nbsp;&nbsp;&nbsp;&nbsp;&nbsp;&nbsp;&nbsp;&nbsp;[&#160;<a href="javascript:void(0);" onclick="javascript: window.open('/scielo.php?script=sci_nlinks&ref=738124&pid=S0376-723X200200030000100004&lng=','','width=640,height=500,resizable=yes,scrollbars=1,menubar=yes,');">Links</a>&#160;]<!-- end-ref --><!-- ref --><P ALIGN="JUSTIFY">5. Computers and Structures, Inc. SAP2000 Structural Analysis Program. Berkeley, California, 1999.&nbsp;&nbsp;&nbsp;&nbsp;&nbsp;&nbsp;&nbsp;&nbsp;[&#160;<a href="javascript:void(0);" onclick="javascript: window.open('/scielo.php?script=sci_nlinks&ref=738125&pid=S0376-723X200200030000100005&lng=','','width=640,height=500,resizable=yes,scrollbars=1,menubar=yes,');">Links</a>&#160;]<!-- end-ref --><!-- ref --><P ALIGN="JUSTIFY">6. COVENIN, Comisi&oacute;n Venezolana de Normas Industriales. Edificaciones Sismorresistentes, COVENIN 1756. Caracas, 2001.&nbsp;&nbsp;&nbsp;&nbsp;&nbsp;&nbsp;&nbsp;&nbsp;[&#160;<a href="javascript:void(0);" onclick="javascript: window.open('/scielo.php?script=sci_nlinks&ref=738126&pid=S0376-723X200200030000100006&lng=','','width=640,height=500,resizable=yes,scrollbars=1,menubar=yes,');">Links</a>&#160;]<!-- end-ref --><!-- ref --><P ALIGN="JUSTIFY">7. Hern&aacute;ndez JJ y L&oacute;pez OA. Response to three-component seismic motion of arbitrary direction. Earthquake Engineering and Structural Dynamics 2002; <B>31</B>:55 - 77. (2002 a).&nbsp;&nbsp;&nbsp;&nbsp;&nbsp;&nbsp;&nbsp;&nbsp;[&#160;<a href="javascript:void(0);" onclick="javascript: window.open('/scielo.php?script=sci_nlinks&ref=738127&pid=S0376-723X200200030000100007&lng=','','width=640,height=500,resizable=yes,scrollbars=1,menubar=yes,');">Links</a>&#160;]<!-- end-ref --><!-- ref --><P ALIGN="JUSTIFY">8. Hern&aacute;ndez JJ y L&oacute;pez OA. Revision of code combination rules for response to three components of seismic motion. Proceedings of the 7th U.S. National Conference on Earthquake Engineering , Boston, 2002. (2002 b).&nbsp;&nbsp;&nbsp;&nbsp;&nbsp;&nbsp;&nbsp;&nbsp;[&#160;<a href="javascript:void(0);" onclick="javascript: window.open('/scielo.php?script=sci_nlinks&ref=738128&pid=S0376-723X200200030000100008&lng=','','width=640,height=500,resizable=yes,scrollbars=1,menubar=yes,');">Links</a>&#160;]<!-- end-ref --><!-- ref --><P ALIGN="JUSTIFY">9. Hern&aacute;ndez JJ y L&oacute;pez OA. Evaluation of combination rules for three-component seismic analysis. Earthquake Engineering and Structural Dynamics 2003, (propuesto para publicaci&oacute;n).&nbsp;&nbsp;&nbsp;&nbsp;&nbsp;&nbsp;&nbsp;&nbsp;[&#160;<a href="javascript:void(0);" onclick="javascript: window.open('/scielo.php?script=sci_nlinks&ref=738129&pid=S0376-723X200200030000100009&lng=','','width=640,height=500,resizable=yes,scrollbars=1,menubar=yes,');">Links</a>&#160;]<!-- end-ref --><!-- ref --><P ALIGN="JUSTIFY">10. ICBO, International Conference of Building Officials. 1997 Uniform Building Code, Structural Engineering Design Provisions, vol. 2, Whittier, CA, 1997.&nbsp;&nbsp;&nbsp;&nbsp;&nbsp;&nbsp;&nbsp;&nbsp;[&#160;<a href="javascript:void(0);" onclick="javascript: window.open('/scielo.php?script=sci_nlinks&ref=738130&pid=S0376-723X200200030000100010&lng=','','width=640,height=500,resizable=yes,scrollbars=1,menubar=yes,');">Links</a>&#160;]<!-- end-ref --><!-- ref --><P ALIGN="JUSTIFY">11. ICC, International Code Council, Inc. 2000 International Building Code. Birmingham, AL, 2000.&nbsp;&nbsp;&nbsp;&nbsp;&nbsp;&nbsp;&nbsp;&nbsp;[&#160;<a href="javascript:void(0);" onclick="javascript: window.open('/scielo.php?script=sci_nlinks&ref=738131&pid=S0376-723X200200030000100011&lng=','','width=640,height=500,resizable=yes,scrollbars=1,menubar=yes,');">Links</a>&#160;]<!-- end-ref --><!-- ref --><P ALIGN="JUSTIFY">12. L&oacute;pez OA, Chopra AK y Hern&aacute;ndez JJ. Critical response of structures to multicomponent earthquake excitation. Earthquake Engineering and Structural Dynamics 2000; <B>29</B>:1759 - 1778.&nbsp;&nbsp;&nbsp;&nbsp;&nbsp;&nbsp;&nbsp;&nbsp;[&#160;<a href="javascript:void(0);" onclick="javascript: window.open('/scielo.php?script=sci_nlinks&ref=738132&pid=S0376-723X200200030000100012&lng=','','width=640,height=500,resizable=yes,scrollbars=1,menubar=yes,');">Links</a>&#160;]<!-- end-ref --><!-- ref --><P ALIGN="JUSTIFY">13. L&oacute;pez OA, Chopra AK y Hern&aacute;ndez JJ. Evaluation of combination rules for maximum response calculation in multicomponent seismic analysis. Earthquake Engineering and Structural Dynamics 2001; <B>30</B>:1379 - 1398.&nbsp;&nbsp;&nbsp;&nbsp;&nbsp;&nbsp;&nbsp;&nbsp;[&#160;<a href="javascript:void(0);" onclick="javascript: window.open('/scielo.php?script=sci_nlinks&ref=738133&pid=S0376-723X200200030000100013&lng=','','width=640,height=500,resizable=yes,scrollbars=1,menubar=yes,');">Links</a>&#160;]<!-- end-ref --><!-- ref --><P ALIGN="JUSTIFY">14. L&oacute;pez OA y Hern&aacute;ndez JJ. Generalizaci&oacute;n del criterio CQC3 para incluir tres componentes s&iacute;smicas en cualquier direcci&oacute;n. Revista T&eacute;cnica de la Facultad de Ingenier&iacute;a, Universidad del Zulia, Maracaibo, Venezuela, vol. 24, Nº 2, Agosto 2001. (2001 a).&nbsp;&nbsp;&nbsp;&nbsp;&nbsp;&nbsp;&nbsp;&nbsp;[&#160;<a href="javascript:void(0);" onclick="javascript: window.open('/scielo.php?script=sci_nlinks&ref=738134&pid=S0376-723X200200030000100014&lng=','','width=640,height=500,resizable=yes,scrollbars=1,menubar=yes,');">Links</a>&#160;]<!-- end-ref --><!-- ref --><P ALIGN="JUSTIFY">15. L&oacute;pez OA y Hern&aacute;ndez JJ. Criterios para combinar respuestas ante dos componentes s&iacute;smicas. Revista T&eacute;cnica de la Facultad de Ingenier&iacute;a, Universidad del Zulia, Maracaibo, Venezuela, vol. 24, Nº 3, Diciembre 2001. (2001 b).&nbsp;&nbsp;&nbsp;&nbsp;&nbsp;&nbsp;&nbsp;&nbsp;[&#160;<a href="javascript:void(0);" onclick="javascript: window.open('/scielo.php?script=sci_nlinks&ref=738135&pid=S0376-723X200200030000100015&lng=','','width=640,height=500,resizable=yes,scrollbars=1,menubar=yes,');">Links</a>&#160;]<!-- end-ref --><!-- ref --><P ALIGN="JUSTIFY">16. L&oacute;pez OA y Hern&aacute;ndez JJ. Response spectra for two horizontal seismic components and application of the CQC3-rule. Proceedings of the 7th U.S. National Conference on Earthquake Engineering , Boston, 2002.&nbsp;&nbsp;&nbsp;&nbsp;&nbsp;&nbsp;&nbsp;&nbsp;[&#160;<a href="javascript:void(0);" onclick="javascript: window.open('/scielo.php?script=sci_nlinks&ref=738136&pid=S0376-723X200200030000100016&lng=','','width=640,height=500,resizable=yes,scrollbars=1,menubar=yes,');">Links</a>&#160;]<!-- end-ref --><!-- ref --><P ALIGN="JUSTIFY">17. L&oacute;pez OA, Hern&aacute;ndez JJ y Raven EC. Espectros de respuesta de las componentes horizontales principales del movimiento s&iacute;smico. VI Congreso Internacional de M&eacute;todos Num&eacute;ricos en Ingenier&iacute;a y Ciencias Aplicadas, CIMENICS 2002, AD08, Caracas, 2002.&nbsp;&nbsp;&nbsp;&nbsp;&nbsp;&nbsp;&nbsp;&nbsp;[&#160;<a href="javascript:void(0);" onclick="javascript: window.open('/scielo.php?script=sci_nlinks&ref=738137&pid=S0376-723X200200030000100017&lng=','','width=640,height=500,resizable=yes,scrollbars=1,menubar=yes,');">Links</a>&#160;]<!-- end-ref --><!-- ref --><P ALIGN="JUSTIFY">18. L&oacute;pez OA y Torres R. The critical angle of seismic incidence and the maximum structural response. Earthquake Engineering and Structural Dynamics 1997; <B>26</B>:881 - 894.&nbsp;&nbsp;&nbsp;&nbsp;&nbsp;&nbsp;&nbsp;&nbsp;[&#160;<a href="javascript:void(0);" onclick="javascript: window.open('/scielo.php?script=sci_nlinks&ref=738138&pid=S0376-723X200200030000100018&lng=','','width=640,height=500,resizable=yes,scrollbars=1,menubar=yes,');">Links</a>&#160;]<!-- end-ref --><!-- ref --><P ALIGN="JUSTIFY">19. Menun C y Der Kiureghian A. A replacement for the 30%, 40% and SRSS rules for multicomponent seismic analysis. Earthquake Spectra 1998; <B>14</B>:153 - 156.&nbsp;&nbsp;&nbsp;&nbsp;&nbsp;&nbsp;&nbsp;&nbsp;[&#160;<a href="javascript:void(0);" onclick="javascript: window.open('/scielo.php?script=sci_nlinks&ref=738139&pid=S0376-723X200200030000100019&lng=','','width=640,height=500,resizable=yes,scrollbars=1,menubar=yes,');">Links</a>&#160;]<!-- end-ref --><!-- ref --><P ALIGN="JUSTIFY">20. Newmark NM. Seismic design criteria for structures and facilities, trans-Alaska pipeline system. Proceedings of the U.S. National Conference on Earthquake Engineering, EERI, 1975, 94 - 103.&nbsp;&nbsp;&nbsp;&nbsp;&nbsp;&nbsp;&nbsp;&nbsp;[&#160;<a href="javascript:void(0);" onclick="javascript: window.open('/scielo.php?script=sci_nlinks&ref=738140&pid=S0376-723X200200030000100020&lng=','','width=640,height=500,resizable=yes,scrollbars=1,menubar=yes,');">Links</a>&#160;]<!-- end-ref --><!-- ref --><P ALIGN="JUSTIFY">21. Nutt RV. ATC–32: Provisional recommendations for the seismic design of bridges. The Fourth Caltrans Seismic Workshop, California Department of Transportation, Sacramento, CA, 1996.&nbsp;&nbsp;&nbsp;&nbsp;&nbsp;&nbsp;&nbsp;&nbsp;[&#160;<a href="javascript:void(0);" onclick="javascript: window.open('/scielo.php?script=sci_nlinks&ref=738141&pid=S0376-723X200200030000100021&lng=','','width=640,height=500,resizable=yes,scrollbars=1,menubar=yes,');">Links</a>&#160;]<!-- end-ref --><!-- ref --><P ALIGN="JUSTIFY">22. Penzien J y Watabe M. Characteristics of 3-dimensional earthquake ground motion. Earthquake Engineering and Structural Dynamics 1975; <B>3</B>:365 - 374.&nbsp;&nbsp;&nbsp;&nbsp;&nbsp;&nbsp;&nbsp;&nbsp;[&#160;<a href="javascript:void(0);" onclick="javascript: window.open('/scielo.php?script=sci_nlinks&ref=738142&pid=S0376-723X200200030000100022&lng=','','width=640,height=500,resizable=yes,scrollbars=1,menubar=yes,');">Links</a>&#160;]<!-- end-ref --><!-- ref --><P ALIGN="JUSTIFY">23. Rosenblueth E y Contreras H. Approximate design for multicomponent earthquakes. Journal of Engineering Mechanics, ASCE, 1977; <B>103</B>:895 - 911.&nbsp;&nbsp;&nbsp;&nbsp;&nbsp;&nbsp;&nbsp;&nbsp;[&#160;<a href="javascript:void(0);" onclick="javascript: window.open('/scielo.php?script=sci_nlinks&ref=738143&pid=S0376-723X200200030000100023&lng=','','width=640,height=500,resizable=yes,scrollbars=1,menubar=yes,');">Links</a>&#160;]<!-- end-ref --><!-- ref --><P ALIGN="JUSTIFY">24. Smeby W y Der Kiureghian A. Modal combination rules for multicomponent earthquake excitation. Earthquake Engineering and Structural Dynamics 1985; <B>13</B>:1 - 12. &nbsp;&nbsp;&nbsp;&nbsp;&nbsp;&nbsp;&nbsp;&nbsp;[&#160;<a href="javascript:void(0);" onclick="javascript: window.open('/scielo.php?script=sci_nlinks&ref=738144&pid=S0376-723X200200030000100024&lng=','','width=640,height=500,resizable=yes,scrollbars=1,menubar=yes,');">Links</a>&#160;]<!-- end-ref --><P ALIGN="JUSTIFY">9. RECONOCIMIENTO</P> </B>    <P ALIGN="JUSTIFY">&nbsp;&nbsp;&nbsp; Los autores manifiestan su agradecimiento al financiamiento parcial otorgado por el Consejo Nacional de Investigaciones Cient&iacute;ficas y Tecnol&oacute;gicas, CONICIT, Venezuela, bajo el Proyecto Nº S1-2000000606. </P>     ]]></body>
<back>
<ref-list>
<ref id="B1">
<label>1</label><nlm-citation citation-type="">
<collab>ASCE, American Society of Civil Engineers, ASCE Working Group on Seismic Analysis of Safety Related Nuclear Structures</collab>
<source><![CDATA[Seismic Analysis of Safety Related Nuclear Structures and Commentary]]></source>
<year>1986</year>
<publisher-loc><![CDATA[NY ]]></publisher-loc>
</nlm-citation>
</ref>
<ref id="B2">
<label>2</label><nlm-citation citation-type="confpro">
<person-group person-group-type="author">
<name>
<surname><![CDATA[Anastassiadis]]></surname>
<given-names><![CDATA[K]]></given-names>
</name>
<name>
<surname><![CDATA[Avramidis]]></surname>
<given-names><![CDATA[IE]]></given-names>
</name>
<name>
<surname><![CDATA[Panetsos]]></surname>
<given-names><![CDATA[PK.]]></given-names>
</name>
</person-group>
<source><![CDATA[Earthquake resistant design of structures under three-component orthotropic seismic excitation]]></source>
<year></year>
<conf-name><![CDATA[11th European Conference on Earthquake Engineering T10]]></conf-name>
<conf-date>1998</conf-date>
<conf-loc> </conf-loc>
</nlm-citation>
</ref>
<ref id="B3">
<label>3</label><nlm-citation citation-type="">
<collab>CEN, Comité Europeo de Normalización</collab>
<source><![CDATA[Eurocódigo 8: Disposiciones para el proyecto de estructuras sismorresistentes]]></source>
<year>1998</year>
<publisher-loc><![CDATA[Bruselas ]]></publisher-loc>
</nlm-citation>
</ref>
<ref id="B4">
<label>4</label><nlm-citation citation-type="book">
<person-group person-group-type="author">
<name>
<surname><![CDATA[Chopra]]></surname>
<given-names><![CDATA[AK.]]></given-names>
</name>
</person-group>
<source><![CDATA[Dynamics of Structures: Theory and Applications to Earthquake Engineering]]></source>
<year>2001</year>
<edition>2nd</edition>
<publisher-loc><![CDATA[Saddle River^eNY NY]]></publisher-loc>
<publisher-name><![CDATA[Prentice Hall]]></publisher-name>
</nlm-citation>
</ref>
<ref id="B5">
<label>5</label><nlm-citation citation-type="">
<collab>Computers and Structures, Inc</collab>
<source><![CDATA[SAP2000 Structural Analysis Program]]></source>
<year>1999</year>
<publisher-loc><![CDATA[Berkeley^eCalifornia California]]></publisher-loc>
</nlm-citation>
</ref>
<ref id="B6">
<label>6</label><nlm-citation citation-type="book">
<collab>COVENIN, Comisión Venezolana de Normas Industriales</collab>
<source><![CDATA[Edificaciones Sismorresistentes]]></source>
<year>2001</year>
<publisher-loc><![CDATA[Caracas ]]></publisher-loc>
<publisher-name><![CDATA[COVENIN 1756]]></publisher-name>
</nlm-citation>
</ref>
<ref id="B7">
<label>7</label><nlm-citation citation-type="journal">
<person-group person-group-type="author">
<name>
<surname><![CDATA[Hernández]]></surname>
<given-names><![CDATA[JJ]]></given-names>
</name>
<name>
<surname><![CDATA[López]]></surname>
<given-names><![CDATA[OA.]]></given-names>
</name>
</person-group>
<article-title xml:lang="en"><![CDATA[Response to three-component seismic motion of arbitrary direction]]></article-title>
<source><![CDATA[Earthquake Engineering and Structural Dynamics]]></source>
<year>2002</year>
<volume>31</volume>
<page-range>55 - 77</page-range></nlm-citation>
</ref>
<ref id="B8">
<label>8</label><nlm-citation citation-type="confpro">
<person-group person-group-type="author">
<name>
<surname><![CDATA[Hernández]]></surname>
<given-names><![CDATA[JJ]]></given-names>
</name>
<name>
<surname><![CDATA[López]]></surname>
<given-names><![CDATA[OA.]]></given-names>
</name>
</person-group>
<source><![CDATA[Revision of code combination rules for response to three components of seismic motion]]></source>
<year></year>
<conf-name><![CDATA[7th U.S. National Conference on Earthquake Engineering]]></conf-name>
<conf-date>2002</conf-date>
<conf-loc>Boston </conf-loc>
</nlm-citation>
</ref>
<ref id="B9">
<label>9</label><nlm-citation citation-type="book">
<person-group person-group-type="author">
<name>
<surname><![CDATA[Hernández]]></surname>
<given-names><![CDATA[JJ]]></given-names>
</name>
<name>
<surname><![CDATA[López]]></surname>
<given-names><![CDATA[OA.]]></given-names>
</name>
</person-group>
<source><![CDATA[Evaluation of combination rules for three-component seismic analysis]]></source>
<year>2003</year>
<publisher-name><![CDATA[Earthquake Engineering and Structural Dynamics]]></publisher-name>
</nlm-citation>
</ref>
<ref id="B10">
<label>10</label><nlm-citation citation-type="confpro">
<source><![CDATA[Uniform Building Code, Structural Engineering Design Provisions]]></source>
<year>1997</year>
<volume>2</volume>
<conf-name><![CDATA[ ICBO, International Conference of Building Officials]]></conf-name>
<conf-date>1997</conf-date>
<conf-loc> </conf-loc>
<publisher-name><![CDATA[Whittier, CA]]></publisher-name>
</nlm-citation>
</ref>
<ref id="B11">
<label>11</label><nlm-citation citation-type="book">
<collab>ICC, International Code Council, Inc</collab>
<source><![CDATA[]]></source>
<year>2000</year>
<publisher-loc><![CDATA[Birmingham^eAL AL]]></publisher-loc>
<publisher-name><![CDATA[International Building Code]]></publisher-name>
</nlm-citation>
</ref>
<ref id="B12">
<label>12</label><nlm-citation citation-type="journal">
<person-group person-group-type="author">
<name>
<surname><![CDATA[López]]></surname>
<given-names><![CDATA[OA]]></given-names>
</name>
<name>
<surname><![CDATA[Chopra]]></surname>
<given-names><![CDATA[AK]]></given-names>
</name>
<name>
<surname><![CDATA[Hernández]]></surname>
<given-names><![CDATA[JJ.]]></given-names>
</name>
</person-group>
<article-title xml:lang="en"><![CDATA[Critical response of structures to multicomponent earthquake excitation]]></article-title>
<source><![CDATA[Earthquake Engineering and Structural Dynamics]]></source>
<year>2000</year>
<volume>29</volume>
<page-range>1759 - 1778</page-range></nlm-citation>
</ref>
<ref id="B13">
<label>13</label><nlm-citation citation-type="journal">
<person-group person-group-type="author">
<name>
<surname><![CDATA[López]]></surname>
<given-names><![CDATA[OA]]></given-names>
</name>
<name>
<surname><![CDATA[Chopra]]></surname>
<given-names><![CDATA[AK]]></given-names>
</name>
<name>
<surname><![CDATA[Hernández]]></surname>
<given-names><![CDATA[JJ.]]></given-names>
</name>
</person-group>
<article-title xml:lang="en"><![CDATA[Evaluation of combination rules for maximum response calculation in multicomponent seismic analysis]]></article-title>
<source><![CDATA[Earthquake Engineering and Structural Dynamics]]></source>
<year>2001</year>
<volume>30</volume>
<page-range>1379 - 1398</page-range></nlm-citation>
</ref>
<ref id="B14">
<label>14</label><nlm-citation citation-type="journal">
<person-group person-group-type="author">
<name>
<surname><![CDATA[López]]></surname>
<given-names><![CDATA[OA]]></given-names>
</name>
<name>
<surname><![CDATA[Hernández]]></surname>
<given-names><![CDATA[JJ.]]></given-names>
</name>
</person-group>
<article-title xml:lang="es"><![CDATA[Generalización del criterio CQC3 para incluir tres componentes sísmicas en cualquier dirección]]></article-title>
<source><![CDATA[Revista Técnica de la Facultad de Ingeniería]]></source>
<year>Agos</year>
<month>to</month>
<day> 2</day>
<volume>24</volume>
<numero>2</numero>
<issue>2</issue>
<publisher-loc><![CDATA[Maracaibo ]]></publisher-loc>
<publisher-name><![CDATA[Universidad del Zulia]]></publisher-name>
</nlm-citation>
</ref>
<ref id="B15">
<label>15</label><nlm-citation citation-type="journal">
<person-group person-group-type="author">
<name>
<surname><![CDATA[López]]></surname>
<given-names><![CDATA[OA]]></given-names>
</name>
<name>
<surname><![CDATA[Hernández]]></surname>
<given-names><![CDATA[JJ.]]></given-names>
</name>
</person-group>
<article-title xml:lang="es"><![CDATA[Criterios para combinar respuestas ante dos componentes sísmicas]]></article-title>
<source><![CDATA[Revista Técnica de la Facultad de Ingeniería]]></source>
<year>Dici</year>
<month>em</month>
<day>br</day>
<volume>24</volume>
<numero>3</numero>
<issue>3</issue>
<publisher-loc><![CDATA[Maracaibo ]]></publisher-loc>
<publisher-name><![CDATA[Universidad del Zulia]]></publisher-name>
</nlm-citation>
</ref>
<ref id="B16">
<label>16</label><nlm-citation citation-type="confpro">
<person-group person-group-type="author">
<name>
<surname><![CDATA[López]]></surname>
<given-names><![CDATA[OA]]></given-names>
</name>
<name>
<surname><![CDATA[Hernández]]></surname>
<given-names><![CDATA[JJ.]]></given-names>
</name>
</person-group>
<source><![CDATA[Response spectra for two horizontal seismic components and application of the CQC3-rule]]></source>
<year></year>
<conf-name><![CDATA[7th U.S. National Conference on Earthquake Engineering]]></conf-name>
<conf-date>2002</conf-date>
<conf-loc>Boston </conf-loc>
</nlm-citation>
</ref>
<ref id="B17">
<label>17</label><nlm-citation citation-type="confpro">
<person-group person-group-type="author">
<name>
<surname><![CDATA[López]]></surname>
<given-names><![CDATA[OA]]></given-names>
</name>
<name>
<surname><![CDATA[Hernández]]></surname>
<given-names><![CDATA[JJ]]></given-names>
</name>
<name>
<surname><![CDATA[Raven]]></surname>
<given-names><![CDATA[EC.]]></given-names>
</name>
</person-group>
<source><![CDATA[Espectros de respuesta de las componentes horizontales principales del movimiento sísmico]]></source>
<year></year>
<conf-name><![CDATA[VI Congreso Internacional de Métodos Numéricos en Ingeniería y Ciencias Aplicadas]]></conf-name>
<conf-date>2002</conf-date>
<conf-loc>Caracas </conf-loc>
</nlm-citation>
</ref>
<ref id="B18">
<label>18</label><nlm-citation citation-type="journal">
<person-group person-group-type="author">
<name>
<surname><![CDATA[López]]></surname>
<given-names><![CDATA[OA]]></given-names>
</name>
<name>
<surname><![CDATA[Torres]]></surname>
<given-names><![CDATA[R.]]></given-names>
</name>
</person-group>
<article-title xml:lang="en"><![CDATA[The critical angle of seismic incidence and the maximum structural response]]></article-title>
<source><![CDATA[Earthquake Engineering and Structural Dynamics]]></source>
<year>1997</year>
<volume>26</volume>
<page-range>881 - 894</page-range></nlm-citation>
</ref>
<ref id="B19">
<label>19</label><nlm-citation citation-type="journal">
<person-group person-group-type="author">
<name>
<surname><![CDATA[Menun]]></surname>
<given-names><![CDATA[C]]></given-names>
</name>
<name>
<surname><![CDATA[Der Kiureghian]]></surname>
<given-names><![CDATA[A.]]></given-names>
</name>
</person-group>
<article-title xml:lang="en"><![CDATA[A replacement for the 30%, 40% and SRSS rules for multicomponent seismic analysis]]></article-title>
<source><![CDATA[Earthquake Spectra]]></source>
<year>1998</year>
<volume>14</volume>
<page-range>153 - 156</page-range></nlm-citation>
</ref>
<ref id="B20">
<label>20</label><nlm-citation citation-type="confpro">
<person-group person-group-type="author">
<name>
<surname><![CDATA[Newmark]]></surname>
<given-names><![CDATA[NM.]]></given-names>
</name>
</person-group>
<source><![CDATA[Seismic design criteria for structures and facilities, trans-Alaska pipeline system]]></source>
<year></year>
<conf-name><![CDATA[ Proceedings of the U.S. National Conference on Earthquake Engineering]]></conf-name>
<conf-date>1975</conf-date>
<conf-loc> </conf-loc>
<page-range>94 - 103</page-range></nlm-citation>
</ref>
<ref id="B21">
<label>21</label><nlm-citation citation-type="">
<collab>The Fourth Caltrans Seismic Workshop^dCalifornia Department of Transportation</collab>
<source><![CDATA[Nutt RV. ATC-32: Provisional recommendations for the seismic design of bridges]]></source>
<year>1996</year>
<publisher-loc><![CDATA[Sacramento^eCA CA]]></publisher-loc>
</nlm-citation>
</ref>
<ref id="B22">
<label>22</label><nlm-citation citation-type="journal">
<person-group person-group-type="author">
<name>
<surname><![CDATA[Penzien]]></surname>
<given-names><![CDATA[J]]></given-names>
</name>
<name>
<surname><![CDATA[Watabe]]></surname>
<given-names><![CDATA[M.]]></given-names>
</name>
</person-group>
<article-title xml:lang="en"><![CDATA[Characteristics of 3-dimensional earthquake ground motion]]></article-title>
<source><![CDATA[Earthquake Engineering and Structural Dynamics]]></source>
<year>1975</year>
<volume>3</volume>
<page-range>365 - 374</page-range></nlm-citation>
</ref>
<ref id="B23">
<label>23</label><nlm-citation citation-type="journal">
<person-group person-group-type="author">
<name>
<surname><![CDATA[Rosenblueth]]></surname>
<given-names><![CDATA[E]]></given-names>
</name>
<name>
<surname><![CDATA[Contreras]]></surname>
<given-names><![CDATA[H.]]></given-names>
</name>
</person-group>
<article-title xml:lang="en"><![CDATA[Approximate design for multicomponent earthquakes]]></article-title>
<source><![CDATA[Journal of Engineering Mechanics]]></source>
<year>1977</year>
<volume>103</volume>
<page-range>895 - 911</page-range><publisher-name><![CDATA[ASCE]]></publisher-name>
</nlm-citation>
</ref>
<ref id="B24">
<label>24</label><nlm-citation citation-type="journal">
<person-group person-group-type="author">
<name>
<surname><![CDATA[Smeby]]></surname>
<given-names><![CDATA[W]]></given-names>
</name>
<name>
<surname><![CDATA[Der Kiureghian]]></surname>
<given-names><![CDATA[A.]]></given-names>
</name>
</person-group>
<article-title xml:lang="en"><![CDATA[Modal combination rules for multicomponent earthquake excitation]]></article-title>
<source><![CDATA[Earthquake Engineering and Structural Dynamics]]></source>
<year>1985</year>
<volume>13</volume>
<page-range>1 - 12</page-range></nlm-citation>
</ref>
</ref-list>
</back>
</article>