<?xml version="1.0" encoding="ISO-8859-1"?><article xmlns:mml="http://www.w3.org/1998/Math/MathML" xmlns:xlink="http://www.w3.org/1999/xlink" xmlns:xsi="http://www.w3.org/2001/XMLSchema-instance">
<front>
<journal-meta>
<journal-id>0378-1844</journal-id>
<journal-title><![CDATA[Interciencia]]></journal-title>
<abbrev-journal-title><![CDATA[INCI]]></abbrev-journal-title>
<issn>0378-1844</issn>
<publisher>
<publisher-name><![CDATA[ASOCIACIÓN INTERCIENCIA]]></publisher-name>
</publisher>
</journal-meta>
<article-meta>
<article-id>S0378-18442004000400006</article-id>
<title-group>
<article-title xml:lang="en"><![CDATA[Modelling short-term dynamic behaviour of the surf clam (Mesodesma donacium) fishery in northern chile using static and dynamic catchability hypotheses]]></article-title>
<article-title xml:lang="es"><![CDATA[MODELAJE DEL COMPORTAMIENTO DINÁMICO A CORTO PLAZO DE LA PESQUERÍA DEL BIVALVO Mesodesma donacium EN EL NORTE DE CHILE USANDO HIPÓTESIS DE CAPTURABILIDAD ESTÁTICA Y DINÁMICA]]></article-title>
<article-title xml:lang="pt"><![CDATA[MODELAGEM DO COMPORTAMENTO DINÂMICO A CURTO PRAZO DA PESCARIA DO BIVALVO Mesodesma donacium NO NORTE DO CHILE USANDO HIPÓTESES DE CAPTURABILIDADE ESTÁTICA E DINÂMICA]]></article-title>
</title-group>
<contrib-group>
<contrib contrib-type="author">
<name>
<surname><![CDATA[PÉREZ E]]></surname>
<given-names><![CDATA[EDUARDO P]]></given-names>
</name>
<xref ref-type="aff" rid="A01"/>
</contrib>
<contrib contrib-type="author">
<name>
<surname><![CDATA[CHÁVEZ V]]></surname>
<given-names><![CDATA[JAVIER E.]]></given-names>
</name>
<xref ref-type="aff" rid="A02"/>
</contrib>
</contrib-group>
<aff id="A01">
<institution><![CDATA[,Marine Biologist Professor Departament of Marine Biology]]></institution>
<addr-line><![CDATA[Coquimbo ]]></addr-line>
<country>Chile</country>
</aff>
<aff id="A02">
<institution><![CDATA[,Marine Biologist  ]]></institution>
<addr-line><![CDATA[ ]]></addr-line>
<country>Chile</country>
</aff>
<pub-date pub-type="pub">
<day>00</day>
<month>04</month>
<year>2004</year>
</pub-date>
<pub-date pub-type="epub">
<day>00</day>
<month>04</month>
<year>2004</year>
</pub-date>
<volume>29</volume>
<numero>4</numero>
<fpage>193</fpage>
<lpage>198</lpage>
<copyright-statement/>
<copyright-year/>
<self-uri xlink:href="http://ve.scielo.org/scielo.php?script=sci_arttext&amp;pid=S0378-18442004000400006&amp;lng=en&amp;nrm=iso"></self-uri><self-uri xlink:href="http://ve.scielo.org/scielo.php?script=sci_abstract&amp;pid=S0378-18442004000400006&amp;lng=en&amp;nrm=iso"></self-uri><self-uri xlink:href="http://ve.scielo.org/scielo.php?script=sci_pdf&amp;pid=S0378-18442004000400006&amp;lng=en&amp;nrm=iso"></self-uri><abstract abstract-type="short" xml:lang="en"><p><![CDATA[The catchability coefficient (q) is a technologically-related parameter that represents the proportion of individuals of a stock cuaght per unit of effort expended. This is frequently assumed to be constant, but there is evidence that in pelagic fishes the value of q may vary with the resource abundance. However, there are few records of q variability in benthic resources. This study evaluates two methods to estimate q: The first supposes the catchability coefficient to be constant over time, and the second supposes a density-dependent relation between q and the abundance of the resource. Both estimations were incorporated into a modified depletion model using data obtained from a local Mesodesma donacium fishery in Coquimbo Bay, Chile. Performance variables such as biomass, catch and catch per unit of effort were simulated and contrasted with observational data from the fishery. Results showed variability over time in the q value associated with the local abundance of the resource. However, the standard error associated to the fit caused the variability calculated for the performance variables to be higher in the case of a variable q than for those obtained with the static q model.]]></p></abstract>
<abstract abstract-type="short" xml:lang="es"><p><![CDATA[El coeficiente de capturabilidad (q) es un parámetro tecnológico que representa la proporción de individuos del stock que es removida por unidad de esfuerzo. Frecuentemente se asume como una constante, aunque hay evidencia que en peces pelágicos q puede variar en función de la abundancia del recurso. Sin embargo, para recursos bentónicos hay pocos registros de variabilidad de q. En este estudio se evaluaron dos métodos para estimar q: El primero supone una capturabilidad constante a través del tiempo, mientras que el segundo supone una relación de denso- dependencia entre q y la abundancia del recurso. Ambas estimaciones fueron incorporadas a un modelo de remoción modificado, utilizando datos obtenidos de la pesquería del bivalvo Mesodesma donacium en la Bahía de Coquimbo, Chile. Las variables de desempeño (biomasa, captura y captura por unidad de esfuerzo) fueron simuladas y contrastadas con valores observados en la pesquería. Los resultados mostraron que q varió a través del tiempo asociado a cambios en la abundancia local del recurso. Sin embargo, el error estándar asociado al ajuste generó que la variabilidad calculada para las variables de desempeño fueran más altas en el modelo basado en q variable que aquellas obtenidas con un q estático.]]></p></abstract>
<abstract abstract-type="short" xml:lang="pt"><p><![CDATA[O coeficiente de capturabilidade (q) é um parâmetro tecnológico que representa a proporção de indivíduos do stock que é removida por unidade de esforço. Freqüentemente se assume como uma constante, ainda que há evidencia que em peixes pelágicos q pode variar em função da abundância do recurso. No entanto, para recursos bentônicos há poucos registros de variabilidade de q. Neste estudo se avaliaram dois métodos para estimar q: O primeiro supõe uma capturabilidade constante através do tempo, enquanto que o segundo supõe uma relação de denso-dependência entre q e a abundância do recurso. Ambas estimações foram incorporadas a um modelo de remoção modificado, utilizando dados obtidos da pescaria do bivalvo Mesodesma donacium na Bahia de Coquimbo, Chile. As variáveis de desempenho (biomassa, captura e captura por unidade de esforço) foram simuladas e contrastadas com valores observados na pescaria. Os resultados mostraram que q variou através do tempo associado a mudanças na abundância local do recurso. No entanto, o erro estandar associado ao ajuste gerou que a variabilidade calculada para as variáveis de desempenho foram mais altas no modelo baseado em q variável que aquelas obtidas com um q estático.]]></p></abstract>
<kwd-group>
<kwd lng="en"><![CDATA[Assessment]]></kwd>
<kwd lng="en"><![CDATA[Catchability]]></kwd>
<kwd lng="en"><![CDATA[Mesodesma donacium]]></kwd>
<kwd lng="en"><![CDATA[Standard Error of Regression]]></kwd>
<kwd lng="en"><![CDATA[Stock]]></kwd>
</kwd-group>
</article-meta>
</front><body><![CDATA[ <p style="margin-top: 0px; margin-bottom: 0px" align="center"><b> <span lang="EN-US" style="font-family: Verdana">MODELLING SHORT-TERM DYNAMIC BEHAVIOUR</span><span style="font-family: Verdana"> </span> <span lang="EN-US" style="font-family: Verdana">OF THE SURF CLAM (<i>Mesodesma  donacium</i>)</span></b></p>     <p style="margin-top: 0px; margin-bottom: 0px" align="center"><b> <span lang="EN-US" style="font-family: Verdana">FISHERY IN NORTHERN CHILE USING  STATIC</span><span style="font-family: Verdana"> </span> <span lang="EN-US" style="font-family: Verdana">AND DYNAMIC CATCHABILITY  HYPOTHESES</span></b></p>     <p style="margin-top: 0px; margin-bottom: 0px" align="center">&nbsp;</p>     <p style="margin-top: 0px; margin-bottom: 0px" align="center"><b> <span lang="EN-US" style="font-family: Verdana"><font size="2">EDUARDO P. PÉREZ  E. and JAVIER E. CHÁVEZ V.</font></span></b></p>     <p style="margin-top: 0px; margin-bottom: 0px" align="center"><b> <span lang="EN-US" style="font-family: Verdana"><font size="2">&nbsp;</font></span></b></p>     <p style="margin-top: 0px; margin-bottom: 0px" align="center"> <span lang="EN-US" style="font-family: Verdana"><font size="2">Eduardo P. Pérez  E. Marine Biologist, M.Sc. and Ph.D. Professor, Departament of Marine</font></span></p>     <p style="margin-top: 0px; margin-bottom: 0px" align="center"> <span style="font-family: Verdana"><font size="2">Biology, Universidad Católica  del Norte, Chile, and researcher, Centro de Estudios Avanzados en Zonas Áridas. </font></span><span lang="EN-US" style="font-family: Verdana"><font size="2"> Address:</font></span></p>     <p style="margin-top: 0px; margin-bottom: 0px" align="center"> <span lang="EN-US" style="font-family: Verdana"><font size="2">Casilla 117  Coquimbo, Chile. email: eperez@ucn.cl</font></span></p>     <p style="margin-top: 0px; margin-bottom: 0px" align="center">&nbsp;</p>     <p style="margin-top: 0px; margin-bottom: 0px" align="center"> <span lang="EN-US" style="font-family: Verdana"><font size="2">Javier E. Chávez  V. Marine Biologist. Specialist, National Fishery Service, Coquimbo,</font></span></p>     ]]></body>
<body><![CDATA[<p style="margin-top: 0px; margin-bottom: 0px" align="center"> <span style="font-family: Verdana"><font size="2">Chile. email: jchavez@sernapesca.cl</font></span></p>     <p style="margin-top: 0px; margin-bottom: 0px" align="center">&nbsp;</p>     <p style="margin-top: 0px; margin-bottom: 0px" align="justify"> <span lang="EN-US" style="font-weight: 700; font-family: Verdana"> <font size="2">Abstract:</font></span></p>     <p style="margin-top: 0px; margin-bottom: 0px" align="justify"> <span lang="EN-US" style="font-family: Verdana"><font size="2">&nbsp;</font></span></p>     <p style="margin-top: 0px; margin-bottom: 0px" align="justify"> <span lang="EN-US" style="font-family: Verdana"><font size="2">The catchability  coefficient (q) is a technologically-related parameter that represents the  proportion of individuals of a stock cuaght per unit of effort expended. This is frequently assumed to  be constant, but there is evidence that in pelagic fishes the value of q may  vary with the resource abundance. However, there are few records of q  variability in benthic resources. This study evaluates two methods to estimate  q: The first supposes the catchability coefficient to be constant over time, and  the second supposes a density-dependent relation between q and the abundance of  the resource. Both estimations were incorporated into a modified depletion model  using data obtained from a local Mesodesma donacium fishery in Coquimbo Bay,  Chile. Performance variables such as biomass, catch and catch per unit of effort  were simulated and contrasted with observational data from the fishery. Results  showed variability over time in the q value associated with the local abundance  of the resource. However, the standard error associated to the fit caused the  variability calculated for the performance variables to be higher in the case of  a variable q than for those obtained with the static q model.</font></span></p>     <p style="margin-top: 0px; margin-bottom: 0px" align="justify"> <font face="Verdana" size="2"><span lang="EN-US">&nbsp;</span></font></p>     <p style="margin-top: 0px; margin-bottom: 0px" align="justify"><b> <font size="2"><span lang="EN-US" style="font-family: Verdana">KEYWORDS</span><span style="font-family: Verdana">: </span><span lang="EN-US" style="font-family: Verdana">Assessment</span><span style="font-family: Verdana">; </span><span lang="EN-US" style="font-family: Verdana">Catchability</span><span style="font-family: Verdana">; </span><i><span lang="EN-US" style="font-family: Verdana">Mesodesma donacium</span><span style="font-family: Verdana">; </span></i><span lang="EN-US" style="font-family: Verdana">Standard Error of  Regression</span><span style="font-family: Verdana">; </span> <span lang="EN-US" style="font-family: Verdana">Stock</span></font></b></p>     <p style="margin-top: 0px; margin-bottom: 0px" align="justify"> <span lang="EN-US" style="font-family: Verdana"><font size="2">&nbsp;</font></span></p>     <p style="margin-top: 0px; margin-bottom: 0px" align="justify"> <span style="font-family: Verdana"><font size="2">&nbsp;</font></span></p>     <p style="margin-top: 0px; margin-bottom: 0px" align="center"><b> <span style="font-family: Verdana"><font size="2">MODELAJE DEL COMPORTAMIENTO  DINÁMICO A CORTO PLAZO DE LA PESQUERÍA DEL BIVALVO </font><i><font size="2"> Mesodesma donacium</font></i></span></b></p>     ]]></body>
<body><![CDATA[<p style="margin-top: 0px; margin-bottom: 0px" align="center"><b> <span style="font-family: Verdana"><font size="2">EN EL NORTE DE CHILE USANDO  HIPÓTESIS DE CAPTURABILIDAD ESTÁTICA Y DINÁMICA</font></span></b><span style="font-family: Verdana"><font size="2">&nbsp;</font></span></p>     <p style="margin-top: 0px; margin-bottom: 0px" align="justify"> <span style="font-family: Verdana"><font size="2">&nbsp;</font></span></p>     <p style="margin-top: 0px; margin-bottom: 0px" align="justify"> <span style="font-weight: 700; font-family: Verdana"><font size="2">Resumen:</font></span></p>     <p style="margin-top: 0px; margin-bottom: 0px" align="justify"> <span style="font-family: Verdana"><font size="2">&nbsp;</font></span></p>     <p style="margin-top: 0px; margin-bottom: 0px" align="justify"> <span style="font-family: Verdana"><font size="2">El coeficiente de  capturabilidad (q) es un parámetro tecnológico que representa la proporción de  individuos del stock que es removida por unidad de esfuerzo. Frecuentemente se  asume como una constante, aunque hay evidencia que en peces pelágicos q puede  variar en función de la abundancia del recurso. Sin embargo, para recursos  bentónicos hay pocos registros de variabilidad de q. En este estudio se  evaluaron dos métodos para estimar q: El primero supone una capturabilidad  constante a través del tiempo, mientras que el segundo supone una relación de  denso- dependencia entre q y la abundancia del recurso. Ambas estimaciones  fueron incorporadas a un modelo de remoción modificado, utilizando datos  obtenidos de la pesquería del bivalvo Mesodesma donacium en la Bahía de  Coquimbo, Chile. Las variables de desempeño (biomasa, captura y captura por  unidad de esfuerzo) fueron simuladas y contrastadas con valores observados en la  pesquería. Los resultados mostraron que q varió a través del tiempo asociado a  cambios en la abundancia local del recurso. Sin embargo, el error estándar  asociado al ajuste generó que la variabilidad calculada para las variables de  desempeño fueran más altas en el modelo basado en q variable que aquellas  obtenidas con un q estático<i>.</i></font></span></p>     <p style="margin-top: 0px; margin-bottom: 0px" align="justify"> <span style="font-family: Verdana"><font size="2">&nbsp;</font></span></p>     <p style="margin-top: 0px; margin-bottom: 0px" align="center"><b> <span style="font-family: Verdana"><font size="2">MODELAGEM DO COMPORTAMENTO  DINÂMICO A CURTO PRAZO DA PESCARIA DO BIVALVO </font></span><i> <span style="font-family: Verdana"><font size="2">Mesodesma donacium </font> </span></i><span style="font-family: Verdana"><font size="2">NO</font></span></b></p>     <p style="margin-top: 0px; margin-bottom: 0px" align="center"><b> <span style="font-family: Verdana"><font size="2">NORTE DO CHILE USANDO  HIPÓTESES DE CAPTURABILIDADE ESTÁTICA E DINÂMICA</font></span></b></p>     <p style="margin-top: 0px; margin-bottom: 0px" align="justify"> <span style="font-family: Verdana"><font size="2">&nbsp;</font></span></p>     <p style="margin-top: 0px; margin-bottom: 0px" align="justify"> <span style="font-weight: 700; font-family: Verdana"><font size="2">Resumo:</font></span></p>     ]]></body>
<body><![CDATA[<p style="margin-top: 0px; margin-bottom: 0px" align="justify"> <span style="font-family: Verdana"><font size="2">&nbsp;</font></span></p>     <p style="margin-top: 0px; margin-bottom: 0px" align="justify"> <span style="font-family: Verdana"><font size="2">O coeficiente de  capturabilidade (q) é um parâmetro tecnológico que representa a proporção de  indivíduos do stock que é removida por unidade de esforço. Freqüentemente se  assume como uma constante, ainda que há evidencia que em peixes pelágicos q pode  variar em função da abundância do recurso. No entanto, para recursos bentônicos  há poucos registros de variabilidade de q. Neste estudo se avaliaram dois  métodos para estimar q: O primeiro supõe uma capturabilidade constante através  do tempo, enquanto que o segundo supõe uma relação de denso-dependência entre q  e a abundância do recurso. Ambas estimações foram incorporadas a um modelo de  remoção modificado, utilizando dados obtidos da pescaria do bivalvo Mesodesma donacium na Bahia de Coquimbo, Chile. As variáveis de desempenho  (biomassa, captura e captura por unidade de esforço) foram simuladas e  contrastadas com valores observados na pescaria. Os resultados mostraram que q  variou através do tempo associado a mudanças na abundância local do recurso. No  entanto, o erro estandar associado ao ajuste gerou que a variabilidade calculada  para as variáveis de desempenho foram mais altas no modelo baseado em q variável  que aquelas obtidas com um q estático.</font></span></p>     <p style="margin-top: 0px; margin-bottom: 0px" align="justify"> <span style="font-family: Verdana"><font size="2">&nbsp;</font></span></p>     <p style="margin-top: 0px; margin-bottom: 0px" align="center"> <span lang="EN-US" style="font-family: Verdana"><font size="2">Received:  09/30/2003. Modified: 03/15/2004. Accepted: 03/31/2004</font></span></p>     <p style="margin-top: 0px; margin-bottom: 0px" align="justify"> <span lang="EN-US" style="font-family: Verdana"><font size="2">&nbsp;</font></span></p>     <p style="margin-top: 0px; margin-bottom: 0px" align="justify"> <span lang="EN-US" style="font-family: Verdana"><font size="2">&nbsp;</font></span></p>     <p style="margin-top: 0px; margin-bottom: 0px" align="justify"> <span lang="EN-US" style="font-family: Verdana"><font size="2">Ideally, fishery  modeling may be used to predict the effects of management methods and  regulations applied to a given fishery (Hilborn and Walters, 1992; Seijo <i>et  al., </i>1997). All models are, however, based on fundamental assumptions. One  of these is related to the spatial/ temporal constancy of the catchability  coefficient (q), defined as a technical coefficient that represents the  proportion of individuals of a stock captured per unit effort applied (Peterman  and Steer, 1981; Gulland, 1983).</font></span></p>     <p style="margin-top: 0px; margin-bottom: 0px" align="justify"> <span lang="EN-US" style="font-family: Verdana"><font size="2">&nbsp;</font></span></p>     <p style="margin-top: 0px; margin-bottom: 0px" align="justify"> <span lang="EN-US" style="font-family: Verdana"><font size="2">From this point  of view the catch per unit effort (CPUE) is the result of a relation between the  level of biomass of the stock and the catchability coefficient (Arreguín-Sánchez,  1996). Thus, in absence of a direct assessment (fishing surveys, for example)  the biomass of the population, an important variable in fisheries management  that cannot be directly observed, may be inferred by means of an observable  indicator such as the CPUE and from knowledge of the catchability coefficient  (Richards and Schnute, 1986; Crecco and Overholtz, 1990; Ye and Mohammed, 1999).  However, there have been failures with the assumption of constant catchability  (Winters and Wheeler, 1985; Crecco and Overholtz, 1990). In fact, a large  variability of this coefficient can be found in the literature due to, among  other factors, the behavior of the resource in aspects such as reproductive  aggregation, patterns of abundance in space and time (Ulltang, 1976; Peterman  and Steer, 1981), changes in fishing power (Gulland, 1983) or in the  distribution area (Winters and Wheeler, 1985) associated with environmental  factors (Swain <i>et al.</i>, 2000). These factors should influence the  proportion of stock removed per unit of effort applied. Simultaneous space-time  variability has been reported for q. Evidence was recently presented (Pérez and  Defeo, 2003) which suggested spatial and temporal variability in q in the  fishery of the nylon shrimp <i>Heterocarpus reedi </i>in Chile’s northern zone.  The implications of this variability of q in modelling of fisheries have not  been evaluated as yet, although it has been proposed that the biomass would  decrease at a higher rate than calculated following a model based on the  supposition of a constant q (Pérez, 1996; Chávez, 2000). Also, the effect on  estimates of the performance variables of the model based on the variability of  the estimations of q (static or dynamic) needs to be evaluated. In general, only  the trajectories of the performance variables which have been obtained by  deterministic analyses have been reported, without considering errors associated  with the models.</font></span></p>     <p style="margin-top: 0px; margin-bottom: 0px" align="justify"> <span lang="EN-US" style="font-family: Verdana"><font size="2">&nbsp;</font></span></p>     ]]></body>
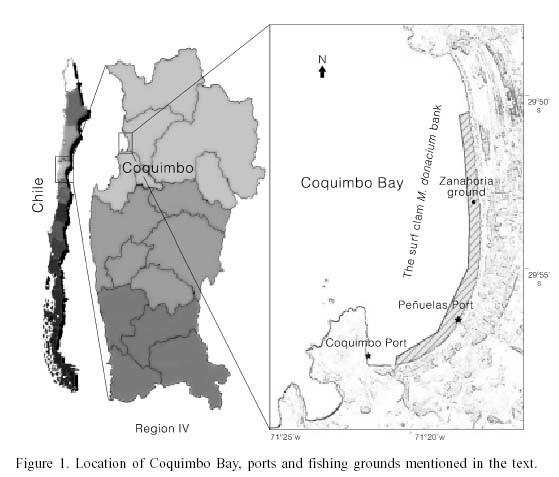
<body><![CDATA[<p style="margin-top: 0px; margin-bottom: 0px" align="justify"> <span lang="EN-US" style="font-family: Verdana"><font size="2">In order to  evaluate the effect of uncertainty associated with the estimation of q on two  indirect estimates of a stock of the bivalve <i>Mesodesma donacium </i>in  Coquimbo Bay, Chile (29º55'S), two methods based on different hypotheses or  assumptions about q were used: i) assumes this coefficient to be constant over  time, and as such it is used to evaluate the dynamics of the stock, while ii)  supposes a density dependence in the local abundance of the resource; that is,  as the biomass of the resource declines, the catchability increases. The  alternatives concerning the static or dynamic nature of the catchability were  separately incorporated into a modified depletion model which utilized data from  the <i>M. donacium </i>fishery. Finally, the expected values for the models  based on each one of the hypothesis and its uncertainty associated with direct  observations from the fishery under typical conditions in the field were  compared.</font></span></p>     <p style="margin-top: 0px; margin-bottom: 0px" align="justify"> <span lang="EN-US" style="font-family: Verdana"><font size="2">&nbsp;</font></span></p>     <p style="margin-top: 0px; margin-bottom: 0px" align="justify"><b> <span lang="EN-US" style="font-family: Verdana"><font size="2">Materials and  Methods</font></span></b></p>     <p style="margin-top: 0px; margin-bottom: 0px" align="justify"><b> <span lang="EN-US" style="font-family: Verdana"><font size="2">&nbsp;</font></span></b></p>     <p style="margin-top: 0px; margin-bottom: 0px" align="justify"><i> <span lang="EN-US" style="font-family: Verdana"><font size="2">M. donacium and  its fishery</font></span></i></p>     <p style="margin-top: 0px; margin-bottom: 0px" align="justify"><i> <span lang="EN-US" style="font-family: Verdana"><font size="2">&nbsp;</font></span></i></p>     <p style="margin-top: 0px; margin-bottom: 0px" align="justify"> <span lang="EN-US" style="font-family: Verdana"><font size="2">The surf clam <i> Mesodesma donacium </i>inhabits sandy beaches 0-5m deep<i>. </i>In Chile,  fishermen operating from 24ft boats with outboard motors harvest the clam using  a semiautonomous diving hookah. In many localities, in addition to divers,  fishermen operating from the beach, called “orilleros”, exploit that fraction of  the resource at depths of 0- 1.5m. The fishery operates under an open-access  regime with one regulation: a minimum size restriction of 60mm of valve length.  There is an exception, however, in Coquimbo Bay (<a href="#figura1">Figure 1</a>;  Pérez, 1996), where the resource has been subject to a community based  management since 1989 (Ariz <i>et al., </i>1994). The community has established  a license quota of 64 small-scale boats. This voluntary collective action has  been recognised and backed by the New Law of Fishery and Aquaculture, in force  since 1991 (Castilla, 1994). Nevertheless, the law establishes that this method  of self-regulation can be legal only if there has been a technical analysis  previously approved by authorities. As a consequence, some fleet dynamic  analyses and sample programs have been implemented. In Coquimbo Bay the fleet  operates an average of 3 days per week (156 days per year) with annual landings  of around 1500tons per year. There is no information about the activity of “orilleros”,  but total landings of 600ton per year are estimated (Pérez <i>et al</i>., 1998).</font></span></p>     <p style="margin-top: 0px; margin-bottom: 0px" align="justify"> <font face="Verdana" size="2"><span lang="EN-US">&nbsp;</span></font></p>     <p style="margin-top: 0px; margin-bottom: 0px" align="justify"> <span lang="EN-US" style="font-family: Verdana"><font size="2">The area of  distribution of the resource on the bank is approximately 1.5x10⁶m2 (Ariz <i>et  al., </i>1994; Pérez, 1996; Chávez, 2000). The intensity of the fishery is  spatially heterogeneous (Pérez, 1996) and different harvesting grounds can be  clearly identified based on the CPUE of each area (Chávez, 2000). The method of  operation of a diver includes collecting <i>M. donacium </i>individuals and  placing them in tubular collector bags (“chinguillos”) which extend over the  substrate as the diver advances. Once the bag is completely extended the diver  returns to the initial position and repeats the collection in a different  direction. The process is continued until the diver’s daily quota is filled.  Pérez (1996) suggested that as the biomass diminished within a fishing ground,  the area harvested by each diver was increased until a satisfactory capture was  obtained; in this case the coefficient of catchability (<i>sensu </i>Baranov,  1918) increased as the resource decreased. This hypothesis was evaluated with  the fishermen, and the length and width of the swept area by each diver was  measured during his fishing operation. With this information it was possible to  place a value on q over time in relation to the swept area, and thus obtain a  value for q independent of it’s relation to either the CPUE or the biomass.</font></span></p>     <p style="margin-top: 0px; margin-bottom: 0px" align="justify"> <font face="Verdana" size="2"><span lang="EN-US">&nbsp;</span></font></p>     ]]></body>
<body><![CDATA[<p style="margin-top: 0px; margin-bottom: 0px" align="center"> <font face="Verdana" size="2"><span lang="EN-US"><a name="figura1"> <img src="/img/fbpe/inci/v29n4/art5figura1.jpg" width="559" height="477"></a></span></font></p>     
<p style="margin-top: 0px; margin-bottom: 0px" align="justify"> <font face="Verdana" size="2"><span lang="EN-US">&nbsp;</span></font></p>     <p style="margin-top: 0px; margin-bottom: 0px" align="justify"><i> <span lang="EN-US" style="font-family: Verdana"><font size="2">Dynamics of the  CPUE with constant Catchability</font></span></i></p>     <p style="margin-top: 0px; margin-bottom: 0px" align="justify"><i> <span lang="EN-US" style="font-family: Verdana"><font size="2">&nbsp;</font></span></i></p>     <p style="margin-top: 0px; margin-bottom: 0px" align="justify"> <span lang="EN-US" style="font-family: Verdana"><font size="2">If the  catchability does not change over time, the biomass at each time t is given by</font></span></p>     <p style="margin-top: 0px; margin-bottom: 0px" align="justify"> <span lang="EN-US" style="font-family: Verdana"><font size="2">&nbsp;</font></span></p>     <p style="margin-top: 0px; margin-bottom: 0px" align="center"> <span style="font-family: Verdana"><font size="2">B<sub>t+1</sub>= (B<sub>t</sub>+R<sub>t</sub>)exp<sup>-M</sup>  - C<sub>t</sub>&nbsp;&nbsp;&nbsp; (1)</font></span></p>     <p style="margin-top: 0px; margin-bottom: 0px" align="justify"> <span lang="EN-US" style="font-family: Verdana"><font size="2">&nbsp;</font></span></p>     <p style="margin-top: 0px; margin-bottom: 0px" align="justify"><font size="2"> <span lang="EN-US" style="font-family: Verdana">where B<sub>t</sub>: biomass  (tons) and C<sub>t</sub>: the previous capture at time t (in weeks, for this  particular model), R<sub>t</sub>: recruitment (in biomass terms) in time t, and  M: natural weekly mortality as obtained by Pérez (1996) for the <i>M. donacium </i>bank in Coquimbo Bay (Ms=0.00865 per week). The use of the expression B exp<sup>–M/2</sup>  in equation (1) is based on the assumption that all individuals in the stock  have an average length and weight. This lets the above expression be equivalent  to</span><span lang="es" style="font-family: Verdana"> </span> <span style="font-family: Verdana"> <img src="/img/fbpe/inci/v29n4/art5formula0.jpg" width="128" height="21"></span><span lang="EN-US" style="font-family: Verdana">,  where </span><span style="font-family: Verdana"> <img src="/img/fbpe/inci/v29n4/art5formula01.jpg" width="37" height="21"> </span> <span lang="EN-US" style="font-family: Verdana">is the number of individuals of  average length, and </span> <span style="font-family: Verdana; text-decoration: overline">w</span><span lang="EN-US" style="font-family: Verdana">  is the average weight at that length. In this way equation (1) becomes  equivalent to the usual expression in terms of number of individuals (Kirkwood <i>et al</i>., 2001; Restrepo, 2001).</span></font></p>     
<p style="margin-top: 0px; margin-bottom: 0px" align="justify"> <span lang="EN-US" style="font-family: Verdana"><font size="2">&nbsp;</font></span></p>     ]]></body>
<body><![CDATA[<p style="margin-top: 0px; margin-bottom: 0px" align="justify"> <span style="font-family: Verdana"><font size="2">The catch is obtained as</font></span></p>     <p style="margin-top: 0px; margin-bottom: 0px" align="justify"> <span lang="EN-US" style="font-family: Verdana"><font size="2">&nbsp;</font></span></p>     <p style="margin-top: 0px; margin-bottom: 0px" align="center"> <span style="font-family: Verdana"><font size="2">C<sub>t</sub> = q E<sub>t</sub>  B<sub>t</sub>&nbsp;&nbsp;&nbsp;&nbsp;&nbsp; (2)</font></span></p>     <p style="margin-top: 0px; margin-bottom: 0px" align="justify"> <span lang="EN-US" style="font-family: Verdana"><font size="2">&nbsp;</font></span></p>     <p style="margin-top: 0px; margin-bottom: 0px" align="justify"> <span lang="EN-US" style="font-family: Verdana"><font size="2">where q:  catchability (per hour) and E<sub>t</sub>: effort observed (hours of collection  by diving) in time t.</font></span></p>     <p style="margin-top: 0px; margin-bottom: 0px" align="justify"> <span lang="EN-US" style="font-family: Verdana"><font size="2">&nbsp;</font></span></p>     <p style="margin-top: 0px; margin-bottom: 0px" align="justify"> <span lang="EN-US" style="font-family: Verdana"><font size="2">The CPUE (kg per  hour) is obtained using</font></span></p>     <p style="margin-top: 0px; margin-bottom: 0px" align="justify"> <span lang="EN-US" style="font-family: Verdana"><font size="2">&nbsp;</font></span></p>     <p style="margin-top: 0px; margin-bottom: 0px" align="center"> <span style="font-family: Verdana"><font size="2">CPUE<sub>t</sub> = B<sub>t</sub>  q&nbsp;&nbsp;&nbsp; (3)</font></span></p>     <p style="margin-top: 0px; margin-bottom: 0px" align="justify"> <span lang="EN-US" style="font-family: Verdana"><font size="2">&nbsp;</font></span></p>     ]]></body>
<body><![CDATA[<p style="margin-top: 0px; margin-bottom: 0px" align="justify"> <span lang="EN-US" style="font-family: Verdana"><font size="2">The DeLury  estimator was used for calculation of the static coefficient of catchability (Hilborn  and Walters, 1992). This is based on a linear model to obtain the coefficient by  relating the CPUE values observed and the cumulative effort observed by means of  the expression</font></span></p>     <p style="margin-top: 0px; margin-bottom: 0px" align="justify"> <span lang="EN-US" style="font-family: Verdana"><font size="2">&nbsp;</font></span></p>     <p style="margin-top: 0px; margin-bottom: 0px" align="center"> <span lang="EN-US" style="font-family: Verdana"><font size="2"> <img src="/img/fbpe/inci/v29n4/art5formula1.jpg" width="255" height="46"></font></span></p>     
<p style="margin-top: 0px; margin-bottom: 0px" align="justify"> <span lang="EN-US" style="font-family: Verdana"><font size="2">&nbsp;</font></span></p>     <p style="margin-top: 0px; margin-bottom: 0px" align="justify"> <span lang="EN-US" style="font-family: Verdana"><font size="2">where ln(CPUE<sub>t</sub>):  natural log of the observed CPUE (kg per hour of diving) at time t, q: slope, B<sub>1</sub>:  biomass available before the first harvest, and&nbsp; <span style="background-image: url('http://150.185.136.100/none'); background-repeat: repeat; background-attachment: scroll; background-position: 0% 0%"> <img src="http:/img/fbpe/inci/v29n4/art5formula2.jpg" width="53" height="43"></span> cumulative effort  observed (hours diving) of divers from port j at time t. This is required since  two organizations of artisanal fishermen operate in Coquimbo Bay. The main group  operates in the Peñuelas sector using approximately 50 boats; a second fleet of  about 14 boats operates in the Coquimbo sector about 8km north from the first (<a href="#figura1">Figure  1</a>). The efforts of both fleets were summed and considered in the  calculations.</font></span></p>     <p style="margin-top: 0px; margin-bottom: 0px" align="justify"> <span lang="EN-US" style="font-family: Verdana"><font size="2">&nbsp;</font></span></p>     <p style="margin-top: 0px; margin-bottom: 0px" align="justify"><i> <span lang="EN-US" style="font-family: Verdana"><font size="2">Dynamic of the  CPUE with variable catchability</font></span></i></p>     <p style="margin-top: 0px; margin-bottom: 0px" align="justify"> <span lang="EN-US" style="font-family: Verdana"><font size="2">&nbsp;</font></span></p>     <p style="margin-top: 0px; margin-bottom: 0px" align="justify"> <span lang="EN-US" style="font-family: Verdana"><font size="2">The variability  of the catchability coefficient was calculated weekly using the equation of  Baranov (1918) which established that</font></span></p>     <p style="margin-top: 0px; margin-bottom: 0px" align="justify"> <span lang="EN-US" style="font-family: Verdana"><font size="2">&nbsp;</font></span></p>     ]]></body>
<body><![CDATA[<p style="margin-top: 0px; margin-bottom: 0px" align="center"> <span style="font-family: Verdana"><font size="2">q<sub>t</sub> = a<sub>t</sub>  / A&nbsp;&nbsp;&nbsp;&nbsp; (5)</font></span></p>     <p style="margin-top: 0px; margin-bottom: 0px" align="justify"> <span lang="EN-US" style="font-family: Verdana"><font size="2">&nbsp;</font></span></p>     <p style="margin-top: 0px; margin-bottom: 0px" align="justify"> <span lang="EN-US" style="font-family: Verdana"><font size="2">where a<sub>t</sub>:  area harvested by the diver at time t. The expression A denotes the area of  distribution of the resource. Caddy (1975) and Seijo <i>et al</i>. (1994)  recommended this as a useful calculation tool for bottom-resource fisheries.  Following this, the change in the value of q would be given by the function  proposed by Pérez (1996), who defined the harvesting area of the diver as</font></span></p>     <p style="margin-top: 0px; margin-bottom: 0px" align="justify"> <span lang="EN-US" style="font-family: Verdana"><font size="2">&nbsp;</font></span></p>     <p style="margin-top: 0px; margin-bottom: 0px" align="center"> <span style="font-family: Verdana"><font size="2">a<sub>t</sub> = (SLC · W) NCC<sub>t</sub>&nbsp;&nbsp;&nbsp;  (6)</font></span></p>     <p style="margin-top: 0px; margin-bottom: 0px" align="justify"> <span lang="EN-US" style="font-family: Verdana"><font size="2">&nbsp;</font></span></p>     <p style="margin-top: 0px; margin-bottom: 0px" align="justify"> <span lang="EN-US" style="font-family: Verdana"><font size="2">where SLC:  standard length of the collector bag used by the diver, W: width of the strip  harvested by the diver in meters (W= 1m; Pérez, 1996), and NCCt: number of  changes in the position of the bag effected by the diver during his collection  over time t. The data required for the calculations were obtained in  coordination with divers according to a design agreed upon for collecting the  information. The area of distribution of the resource (A) was taken from Ariz <i> et al. </i>(1994) and Chávez (2000).</font></span></p>     <p style="margin-top: 0px; margin-bottom: 0px" align="justify"> <span lang="EN-US" style="font-family: Verdana"><font size="2">&nbsp;</font></span></p>     <p style="margin-top: 0px; margin-bottom: 0px" align="justify"> <span lang="EN-US" style="font-family: Verdana"><font size="2">In this case the  dependency relationship between CPUE and catchability over time is given  similarly to MacCall (1976), using CPUE as an indirect biomass index</font></span></p>     <p style="margin-top: 0px; margin-bottom: 0px" align="justify"> <span lang="EN-US" style="font-family: Verdana"><font size="2">&nbsp;</font></span></p>     ]]></body>
<body><![CDATA[<p style="margin-top: 0px; margin-bottom: 0px" align="center"><font size="2"> <span style="font-family: Verdana">q<sub>t</sub> = </span>&#945;<span style="font-family: Verdana">CPUE<sub>t</sub><sup>-</sup></span><sup>&#946;</sup><span style="font-family: Verdana">  &nbsp;&nbsp;&nbsp;&nbsp;&nbsp;&nbsp;&nbsp;&nbsp;(7)</span></font></p>     <p style="margin-top: 0px; margin-bottom: 0px" align="justify"> <span style="font-family: Verdana"><font size="2">&nbsp;</font></span></p>     <p style="margin-top: 0px; margin-bottom: 0px" align="justify"> <span lang="EN-US" style="font-family: Verdana"><font size="2">where </font> </span><font size="2">&#945;<span style="font-family: Verdana"> </span></font> <span lang="EN-US" style="font-family: Verdana"><font size="2">and </font> </span><font size="2">&#946;<span style="font-family: Verdana"> </span></font> <span lang="EN-US" style="font-family: Verdana"><font size="2">are parameters.  Given that CPUE<sub>t</sub> is, in our interpretation, an indicator of relative  abundance of the resource in time t, then the biomass at time t may be expressed  as</font></span></p>     <p style="margin-top: 0px; margin-bottom: 0px" align="justify"> <span lang="EN-US" style="font-family: Verdana"><font size="2">&nbsp;</font></span></p>     <p style="margin-top: 0px; margin-bottom: 0px" align="center"> <span style="font-family: Verdana"><font size="2">B<sub>t</sub> = CPUE<sub>t</sub>  / q<sub>t</sub>&nbsp;&nbsp;&nbsp;&nbsp;&nbsp; (8)</font></span></p>     <p style="margin-top: 0px; margin-bottom: 0px" align="justify"> <span style="font-family: Verdana"><font size="2">&nbsp;</font></span></p>     <p style="margin-top: 0px; margin-bottom: 0px" align="justify"> <span style="font-family: Verdana"><font size="2">Substituting Eq. (4) in (5)  leads to</font></span></p>     <p style="margin-top: 0px; margin-bottom: 0px" align="justify"> <span style="font-family: Verdana"><font size="2">&nbsp;</font></span></p>     <p style="margin-top: 0px; margin-bottom: 0px" align="center"> <span style="font-family: Verdana"><font size="2">B<sub>t</sub> = CPUE<sub>t</sub>  / </font></span><font size="2">&#945;</font><span style="font-family: Verdana"><font size="2">CPUE<sub>t</sub><sup>-</sup></font></span><font size="2"><sup>&#946;</sup>&nbsp;&nbsp;&nbsp;&nbsp; </font><span style="font-family: Verdana"><font size="2">&nbsp;(9)</font></span></p>     <p style="margin-top: 0px; margin-bottom: 0px" align="justify"> <span style="font-family: Verdana"><font size="2">&nbsp;</font></span></p>     ]]></body>
<body><![CDATA[<p style="margin-top: 0px; margin-bottom: 0px" align="justify"> <span lang="EN-US" style="font-family: Verdana"><font size="2">Similarly, in Eq.  (2) and (4) the relation between biomass and catchability over time t can be  directly modeled using equation (7) from MacCall (1976):</font></span></p>     <p style="margin-top: 0px; margin-bottom: 0px" align="justify"> <span lang="EN-US" style="font-family: Verdana"><font size="2">&nbsp;</font></span></p>     <p style="margin-top: 0px; margin-bottom: 0px" align="center"> <span style="font-family: Verdana"><font size="2">q<sub>t</sub> = &#967;B<sub>t</sub><sup>-&#948;</sup>&nbsp;&nbsp;&nbsp;&nbsp;&nbsp;  (10)</font></span></p>     <p style="margin-top: 0px; margin-bottom: 0px" align="justify"> <span lang="EN-US" style="font-family: Verdana"><font size="2">&nbsp;</font></span></p>     <p style="margin-top: 0px; margin-bottom: 0px" align="justify"> <span style="font-family: Verdana"><font size="2">where &#967; and &#948; are parameters.</font></span></p>     <p style="margin-top: 0px; margin-bottom: 0px" align="justify"> <span lang="EN-US" style="font-family: Verdana"><font size="2">&nbsp;</font></span></p>     <p style="margin-top: 0px; margin-bottom: 0px" align="justify"> <span lang="EN-US" style="font-family: Verdana"><font size="2">Analogous to the  dynamic biomass model described for the catchability constant (Eq. 1) the model  that considers q as a variable, which is a function of the availability of  biomass, would be given by</font></span></p>     <p style="margin-top: 0px; margin-bottom: 0px" align="justify"> <span lang="EN-US" style="font-family: Verdana"><font size="2">&nbsp;</font></span></p>     <p style="margin-top: 0px; margin-bottom: 0px" align="center"> <span lang="EN-US" style="font-family: Verdana"><font size="2"> <img src="/img/fbpe/inci/v29n4/art5formula3.jpg" width="317" height="57"></font></span></p>     
<p style="margin-top: 0px; margin-bottom: 0px" align="justify"> <span lang="EN-US" style="font-family: Verdana"><font size="2">&nbsp;</font></span></p>     ]]></body>
<body><![CDATA[<p style="margin-top: 0px; margin-bottom: 0px" align="justify"> <span lang="EN-US" style="font-family: Verdana"><font size="2">where fo<sub>j,t</sub>:  observed effort for the port j at time t. From Eq. (8) the CPUE can be estimated  as</font></span></p>     <p style="margin-top: 0px; margin-bottom: 0px" align="justify"> <span lang="EN-US" style="font-family: Verdana"><font size="2">&nbsp;</font></span></p>     <p style="margin-top: 0px; margin-bottom: 0px" align="center"> <span lang="EN-US" style="font-family: Verdana"><font size="2"> <img src="/img/fbpe/inci/v29n4/art5formula4.jpg" width="204" height="34"></font></span></p>     
<p style="margin-top: 0px; margin-bottom: 0px" align="justify"> <span lang="EN-US" style="font-family: Verdana"><font size="2">&nbsp;</font></span></p>     <p style="margin-top: 0px; margin-bottom: 0px" align="justify"> <span lang="EN-US" style="font-family: Verdana"><font size="2">Thus, the term <span style="background-image: url('http://150.185.136.100/none'); background-repeat: repeat; background-attachment: scroll; background-position: 0% 0%"> <img src="http:/img/fbpe/inci/v29n4/art5formula5.jpg" width="109" height="41"></span> represents total  catch at all ports j. The weekly catches, as well as the effort of both fleets  were summed and considered in the calculation.</font></span></p>     <p style="margin-top: 0px; margin-bottom: 0px" align="justify"> <span lang="EN-US" style="font-family: Verdana"><font size="2">&nbsp;</font></span></p>     <p style="margin-top: 0px; margin-bottom: 0px" align="justify"><i> <span lang="EN-US" style="font-family: Verdana"><font size="2">Inclusion of  variability in estimations of the q parameter</font></span></i></p>     <p style="margin-top: 0px; margin-bottom: 0px" align="justify"> <span lang="EN-US" style="font-family: Verdana"><font size="2">&nbsp;</font></span></p>     <p style="margin-top: 0px; margin-bottom: 0px" align="justify"> <span lang="EN-US" style="font-family: Verdana"><font size="2">The standard  error (Zar, 1995) for the parameters of Eq. (4), (7) and (10) was calculated  using non linear fit routines available in the SYSTAT 8.0 software. From these  estimates of variability, 800 possible values of q were calculated by Monte  Carlo analysis (Manly, 1991). Each of these values was entered into the  respective simulation model, and the results were interpreted using “box and  whiskers” plots.</font></span></p>     <p style="margin-top: 0px; margin-bottom: 0px" align="justify"> <span lang="EN-US" style="font-family: Verdana"><font size="2">&nbsp;</font></span></p>     ]]></body>
<body><![CDATA[<p style="margin-top: 0px; margin-bottom: 0px" align="justify"> <span lang="EN-US" style="font-family: Verdana"><font size="2">Eq. (1) and (10)  were parameterized using information based on the <i>M. donacium </i>fishery in  Coquimbo Bay on the Northern Chilean coast (<a href="#figura1">Figure 1</a>).</font></span></p>     <p style="margin-top: 0px; margin-bottom: 0px" align="justify"> <span lang="EN-US" style="font-family: Verdana"><font size="2">&nbsp;</font></span></p>     <p style="margin-top: 0px; margin-bottom: 0px" align="justify"> <span lang="EN-US" style="font-family: Verdana"><font size="2">More than 20  collecting grounds were identified within the bank (Pérez, 1996; Chávez, 2000).  However, in order to evaluate the usefulness of Eq. (1) and (11) only one of the  important grounds (termed “Zanahoria” by the fishermen, <a href="#figura1"> Figure 1</a>) was selected for study, based on its area and number of boat trips  observed (Chávez, 2000). Comparisons among the observed data and simulated  output were made using percentiles and medians.</font></span></p>     <p style="margin-top: 0px; margin-bottom: 0px" align="justify"> <span lang="EN-US" style="font-family: Verdana"><font size="2">&nbsp;</font></span></p>     <p style="margin-top: 0px; margin-bottom: 0px" align="center"> <span lang="EN-US" style="font-family: Verdana"><font size="2"> <a name="figura2"><img src="/img/fbpe/inci/v29n4/art5figura2.jpg" width="750" height="165"></a></font></span></p>     
<p style="margin-top: 0px; margin-bottom: 0px" align="justify"> <span lang="EN-US" style="font-family: Verdana"><font size="2">&nbsp;</font></span></p>     <p style="margin-top: 0px; margin-bottom: 0px" align="justify"><b> <span lang="EN-US" style="font-family: Verdana"><font size="2">Results</font></span></b></p>     <p style="margin-top: 0px; margin-bottom: 0px" align="justify"><b> <span lang="EN-US" style="font-family: Verdana"><font size="2">&nbsp;</font></span></b></p>     <p style="margin-top: 0px; margin-bottom: 0px" align="justify"><i> <span lang="EN-US" style="font-family: Verdana"><font size="2">Estimation of  static and dynamic Catchability</font></span></i></p>     <p style="margin-top: 0px; margin-bottom: 0px" align="justify"><i> <span lang="EN-US" style="font-family: Verdana"><font size="2">&nbsp;</font></span></i></p>     ]]></body>
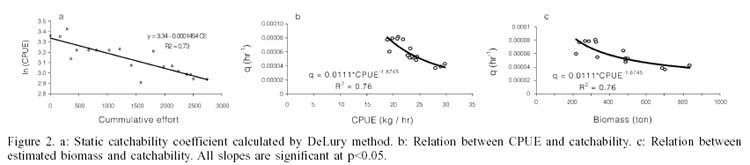
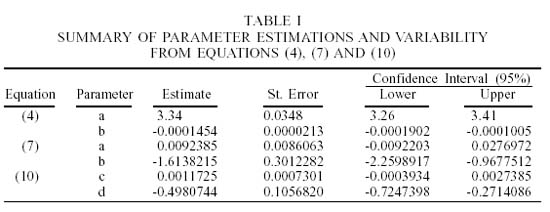
<body><![CDATA[<p style="margin-top: 0px; margin-bottom: 0px" align="justify"> <span lang="EN-US" style="font-family: Verdana"><font size="2">The analysis  performed showed lower values when q was estimated through a dynamic approach.  The DeLury method gave a catchability value of 0.0001454h<sup>-1</sup> (<a href="#figura2">Figure  2a</a>), while the method based on Eq. (7) showed an inverse relation with lower  values, between 0.00003 and 0.0008h<sup>-1</sup> (<a href="#figura2">Figure 2b</a>).  The same tendency was evident when contrasting catchability with estimated  biomass (<a href="#figura2">Figure 2c</a>).</font></span></p>     <p style="margin-top: 0px; margin-bottom: 0px" align="justify"> <span lang="EN-US" style="font-family: Verdana"><font size="2">&nbsp;</font></span></p>     <p style="margin-top: 0px; margin-bottom: 0px" align="justify"><i> <span style="font-family: Verdana"><font size="2">Error associated with the  estimations</font></span></i></p>     <p style="margin-top: 0px; margin-bottom: 0px" align="justify"> <span lang="EN-US" style="font-family: Verdana"><font size="2">&nbsp;</font></span></p>     <p style="margin-top: 0px; margin-bottom: 0px" align="justify"> <span lang="EN-US" style="font-family: Verdana"><font size="2">The standard  error of the estimations of Eq. (4) was less (<a href="#tabla1">Table I</a>)  than those calculated for Eq. (7) and (10). Thus, for the slopes of these  equations, the error with respect to the values estimated were 1% in the case of  static q (Eq. 4) and 19% and 21%, respectively, for Eq. (7) and (10) in which a  dynamic q was assumed.</font></span></p>     <p style="margin-top: 0px; margin-bottom: 0px" align="justify"> <span lang="EN-US" style="font-family: Verdana"><font size="2">&nbsp;</font></span></p>     <p style="margin-top: 0px; margin-bottom: 0px" align="center"> <span lang="EN-US" style="font-family: Verdana"><font size="2"><a name="tabla1"> <img src="/img/fbpe/inci/v29n4/art5tabla1.jpg" width="550" height="212"></a></font></span></p>     
<p style="margin-top: 0px; margin-bottom: 0px" align="center"> <span lang="EN-US" style="font-family: Verdana"><font size="2">&nbsp;</font></span></p>     <p style="margin-top: 0px; margin-bottom: 0px" align="center"> <span lang="EN-US" style="font-family: Verdana"><font size="2"> <a name="figura3"><img src="/img/fbpe/inci/v29n4/art5figura3.jpg" width="577" height="319"></a></font></span></p>     
<p style="margin-top: 0px; margin-bottom: 0px" align="center"> <span lang="EN-US" style="font-family: Verdana"><font size="2">&nbsp;</font></span></p>     ]]></body>
<body><![CDATA[<p style="margin-top: 0px; margin-bottom: 0px" align="center"> <span lang="EN-US" style="font-family: Verdana"><font size="2"> <a name="figura4"><img src="/img/fbpe/inci/v29n4/art5figura4.jpg" width="574" height="325"></a></font></span></p>     
<p style="margin-top: 0px; margin-bottom: 0px" align="center"> <span lang="EN-US" style="font-family: Verdana"><font size="2">&nbsp;</font></span></p>     <p style="margin-top: 0px; margin-bottom: 0px" align="center"> <span lang="EN-US" style="font-family: Verdana"><font size="2"> <a name="figura5"><img src="/img/fbpe/inci/v29n4/art5figura5.jpg" width="577" height="333"></a></font></span></p>     
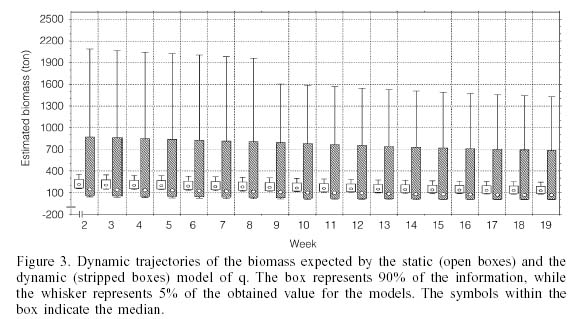
<p style="margin-top: 0px; margin-bottom: 0px" align="justify"> <span lang="EN-US" style="font-family: Verdana"><font size="2">&nbsp;</font></span></p>     <p style="margin-top: 0px; margin-bottom: 0px" align="justify"> <span lang="EN-US" style="font-family: Verdana"><font size="2">As a result of  the above, Eq. (7) and (10) produced negative values for the confidence  interval, which was lower than the parameters a and c respectively (<a href="#tabla1">Table  I</a>). This implies a result of negative biomass, which is obviously without  meaning. Of the 800 iterations, 38 values fell within this category for each  week simulated. These values were omitted from all subsequent calculations.</font></span></p>     <p style="margin-top: 0px; margin-bottom: 0px" align="justify"> <span lang="EN-US" style="font-family: Verdana"><font size="2">&nbsp;</font></span></p>     <p style="margin-top: 0px; margin-bottom: 0px" align="justify"><i> <span lang="EN-US" style="font-family: Verdana"><font size="2">Comparison  between results from the models and observations</font></span></i></p>     <p style="margin-top: 0px; margin-bottom: 0px" align="justify"> <span lang="EN-US" style="font-family: Verdana"><font size="2">&nbsp;</font></span></p>     <p style="margin-top: 0px; margin-bottom: 0px" align="justify"><i> <span lang="EN-US" style="font-family: Verdana"><font size="2">Biomass</font></span></i><span lang="EN-US" style="font-family: Verdana"><font size="2">. <a href="#figura3">Figure 3</a> shows the distribution of 95% of the calculated  data. Each “whisker” represents 2.5% of the information, while the “box”  represents the remaining 90%; within this is represented the median of the  results obtained using the Monte Carlo simulation. A larger variability was  observed in the model that included a dynamic q, with respect to the alternative  model in which q was static. With the latter condition, the range of biomass  values was 78-352tons (median=166ton), while with a dynamic q, this range was  2-5907tons (median= 103ton).</font></span></p>     <p style="margin-top: 0px; margin-bottom: 0px" align="justify"> <span lang="EN-US" style="font-family: Verdana"><font size="2">&nbsp;</font></span></p>     ]]></body>
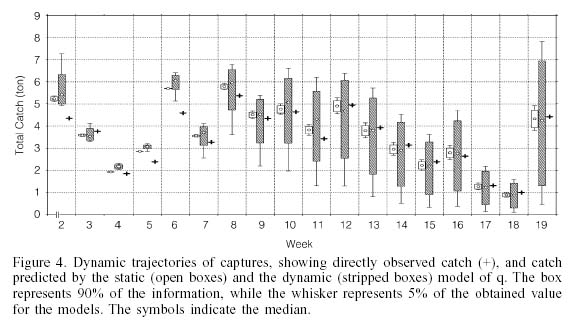
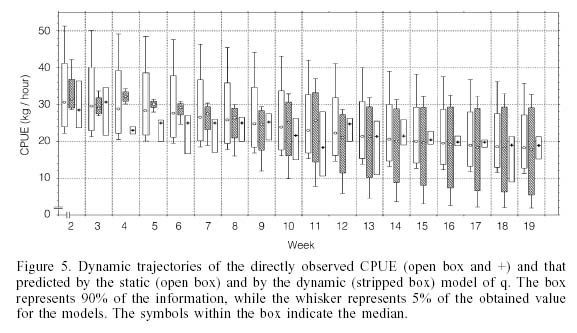
<body><![CDATA[<p style="margin-top: 0px; margin-bottom: 0px" align="justify"><i> <span lang="EN-US" style="font-family: Verdana"><font size="2">Catch</font></span></i><span lang="EN-US" style="font-family: Verdana"><font size="2">.  In most of the cases the catch observed was within the range of values expected  from both models (<a href="#figura4">Figure 4</a>). As observed for biomass, the  dynamic q model showed greater variation, while the variation was reduced with  the static q model. Another aspect to note is that with the dynamic q model the  tendency for the variability in the catch estimation increases from the 7th  week, a fact which was not observed with the other model.</font></span></p>     <p style="margin-top: 0px; margin-bottom: 0px" align="justify"> <span lang="EN-US" style="font-family: Verdana"><font size="2">&nbsp;</font></span></p>     <p style="margin-top: 0px; margin-bottom: 0px" align="justify"><i> <span lang="EN-US" style="font-family: Verdana"><font size="2">Catch per unit of  effort</font></span></i><span lang="EN-US" style="font-family: Verdana"><font size="2">.  The range of values for the CPUE observed was within the range of variation  expected from both models (<a href="#figura5">Figure 5</a>), although its  variability was smaller. The tendency with this indicator showed that, in the  case of the dynamic q model, its variability increased progressively beginning  at the 5th week, a pattern that was not observed with the static q model.</font></span></p>     <p style="margin-top: 0px; margin-bottom: 0px" align="justify"> <span lang="EN-US" style="font-family: Verdana"><font size="2">&nbsp;</font></span></p>     <p style="margin-top: 0px; margin-bottom: 0px" align="justify"><b> <span style="font-family: Verdana"><font size="2">Discussion</font></span></b></p>     <p style="margin-top: 0px; margin-bottom: 0px" align="justify"> <span lang="EN-US" style="font-family: Verdana"><font size="2">&nbsp;</font></span></p>     <p style="margin-top: 0px; margin-bottom: 0px" align="justify"> <span lang="EN-US" style="font-family: Verdana"><font size="2">The results  support the hypothesis of temporal variability in the catchability coefficient,  associated with variations in local abundance of the resource, as higher q  values were associated to lower biomass levels. This finding is against the  general assumption that this coefficient is a constant. On the other hand, the  standard error associated with the estimation of parameters by regression  analysis caused the variability calculated for the performance variables to be  higher with the variable q model than for those obtained with the static q  model.</font></span></p>     <p style="margin-top: 0px; margin-bottom: 0px" align="justify"> <span lang="EN-US" style="font-family: Verdana"><font size="2">&nbsp;</font></span></p>     <p style="margin-top: 0px; margin-bottom: 0px" align="justify"> <span lang="EN-US" style="font-family: Verdana"><font size="2">Although temporal  variation in catchability has been demonstrated in diverse pelagic and demersal  fisheries (MacCall, 1976; Peterman and Sterr, 1981; Bannerot and Austin, 1983;  Crecco and Savoy, 1985; Gordoa and Hightower, 1991; Swain <i>et al</i>., 2000),  and for crustaceans (Ye and Mohammed, 1999; Pérez and Defeo, 2003), we have  found no references to the behavior of q in artisanal fisheries for benthic  resources, specifically mollusks.</font></span></p>     <p style="margin-top: 0px; margin-bottom: 0px" align="justify"> <span lang="EN-US" style="font-family: Verdana"><font size="2">&nbsp;</font></span></p>     ]]></body>
<body><![CDATA[<p style="margin-top: 0px; margin-bottom: 0px" align="justify"> <span lang="EN-US" style="font-family: Verdana"><font size="2">Various  explanations have been proposed for the observed variability. Atran and Loesch  (1995) carried out an analysis of weekly fluctuations in catchability of <i> Brevoortia tyrannus</i>, assuming that variations in the q coefficient could  remain relatively constant when measured on an annual scale. This condition is  generally violated, if ever fulfilled at all, when the analysis is carried out  seasonally, as is verified in the present study by the finding of temporal  variations in catchability when analyzed over short periods of time. This fact  raises questions about the correct time scales needed to account for small  variations in catchability which may affect the evaluation of the resource under  study.</font></span></p>     <p style="margin-top: 0px; margin-bottom: 0px" align="justify"> <span lang="EN-US" style="font-family: Verdana"><font size="2">&nbsp;</font></span></p>     <p style="margin-top: 0px; margin-bottom: 0px" align="justify"> <span lang="EN-US" style="font-family: Verdana"><font size="2">A second  explanation has been associated with behavioral aspects of the resource (Arreguin-Sánchez,  1996, Godo <i>et al., </i>1999; Swain <i>et al</i>., 2000). Species that form  schools show strong inverse correlation between biomass and catchability (Paloheimo  and Dickie, 1964; MacCall, 1976; Ulltang, 1976; Peterman and Steer, 1981; Crecco  and Savoy, 1985; Angelsen and Olsen, 1987; Crecco and Overholtz, 1990; Hansen <i> et al., </i>2000). Following drops in abundance per unit area after extraction  efforts, the schools tend to regroup and maintain their density. When  maintaining density with declining biomass, each unit of effort extracts a  greater proportion of the remaining stock, so that as catchability increases,  the stock is reduced. The preceding becomes evident as a strong  density-dependent relationship.</font></span></p>     <p style="margin-top: 0px; margin-bottom: 0px" align="justify"> <span lang="EN-US" style="font-family: Verdana"><font size="2">&nbsp;</font></span></p>     <p style="margin-top: 0px; margin-bottom: 0px" align="justify"> <span lang="EN-US" style="font-family: Verdana"><font size="2">In the case of <i> M. donacium</i>, however, the explanation seems to be related to the behavior of  the divers, more than to the behavior of the resource. Pérez (1996) postulated a  densitydependent effect between q and the abundance of this resource, since upon  declines in abundance the diver must harvest a greater surface area to obtain  the same catch. In this way the numerator in Eq. (11) increases, the denominator  remaining constant. Thus, the catchability increases. This characteristic is  present in the dynamic estimations of catchability in each fishery ground; as  CPUE increases catchability decreases and vice-versa (Chávez, 2000).</font></span></p>     <p style="margin-top: 0px; margin-bottom: 0px" align="justify"> <span lang="EN-US" style="font-family: Verdana"><font size="2">&nbsp;</font></span></p>     <p style="margin-top: 0px; margin-bottom: 0px" align="justify"> <span lang="EN-US" style="font-family: Verdana"><font size="2">Another aspect  that emerges from the results obtained relates to the assumption that  establishes that the CPUE would be a relative estimator of the resource  abundance. Seijo <i>et al. </i>(1997) indicated that the assumption that the  CPUE was a relative index of abundance for sedentary species would be limited,  given changes in the value for catchability (Collins, 1987; Swain <i>et al., </i> 2000). Thus, in quantitative terms, the CPUE estimated on the basis of the  dynamic model of q (Eq. 10) always showed a better fit of CPUE to the values  obtained directly than did the CPUE obtained for these values using constant  catchability. Thus, the CPUE may be considered as an efficient estimator of the  abundance if and only if the b parameter in Eq. (7) is significantly less than  and statistically different to zero. This conclusion is the same as that reached  by Ulltang (1976) for <i>Clupea harengus</i>.</font></span></p>     <p style="margin-top: 0px; margin-bottom: 0px" align="justify"> <span lang="EN-US" style="font-family: Verdana"><font size="2">&nbsp;</font></span></p>     <p style="margin-top: 0px; margin-bottom: 0px" align="justify"> <span lang="EN-US" style="font-family: Verdana"><font size="2">However, despite  the above statements, the results suggest that although there was a significant  inverse relation between biomass and catchability, the variability in the  observations that serve as inputs to the regression equations cause the dynamic  q model to have weaknesses (<i>ie. </i>negative biomass values) associated with  the high standard error of the calculated parameters. In contrast, although the  hypothesis of the constancy of q was falsified, the results of the model based  on this assumption produced numbers within the range of values observed for the  performance values (catch, CPUE) with greater precision than that of the model  using dynamic q. As a consequence, for the case of the <i>M. donacium </i> fishery in Coquimbo Bay, it is possible to work with a “biomass depletion” model  using a static q without making an important estimation error. In this sense,  this result represents an advantage, as it is simpler to estimate this  coefficient from routine information of fishery activities instead of producing  new records for the area harvested by each diver. In relation to the variability  in the harvested area, it is possible that within the fishery zone analyzed  (known to the fishermen as “Zanahoria”) there are <i>loci </i>characterized by  particular density and size structures. <i>Loci </i>were defined under the basic  assumption that the stock can be subdivided into different such <i>loci</i>,  each assuming different resource densities. A <i>locus </i>becomes the smallest  geographical unit considered in which the population density can be considered  effectively uniform (Caddy, 1975). Each <i>locus </i>would contain several age  classes, all of which would have different densities. Thus, the distribution of  the resource may be heterogeneous, even within the same fishery area, and may  produce a high degree of variability within the area harvested by each diver  and, therefore, a higher error in the model.</font></span></p>     <p style="margin-top: 0px; margin-bottom: 0px" align="justify"> <span lang="EN-US" style="font-family: Verdana"><font size="2">&nbsp;</font></span></p>     ]]></body>
<body><![CDATA[<p style="margin-top: 0px; margin-bottom: 0px" align="justify"> <span lang="EN-US" style="font-family: Verdana"><font size="2">In a management  context these results can be useful to make decisions with a relatively simple  predictive model. This is particularly important when only historical data about  CPUE are available for fisheries analysts. Furthermore, CPUE requires lower  costs (in money and time consumed) compared with a more sophisticated  statistical design. In order to evaluate the best tools to support management  decisions, all these aspects must be considered in discussing a fishery  monitoring system.</font></span></p>     <p style="margin-top: 0px; margin-bottom: 0px" align="justify"> <span lang="EN-US" style="font-family: Verdana"><font size="2">&nbsp;</font></span></p>     <p style="margin:0cm;margin-bottom:.0001pt"><b> <span lang="EN-US" style="font-size: 10.0pt; font-family: Verdana">REFERENCES</span></b></p>     <p style="margin:0cm;margin-bottom:.0001pt"><b> <span lang="EN-US" style="font-size: 10.0pt; font-family: Verdana">&nbsp;</span></b></p>     <!-- ref --><p style="margin:0cm;margin-bottom:.0001pt"> <span lang="EN-US" style="font-size: 10.0pt; font-family: Verdana">1. Angelsen  KK, Olsen S (1987) Impact of fish density and effort level on catching  efficiency of fishing gear. </span><i> <span style="font-size:10.0pt;font-family:Verdana">Fish. Res. 5</span></i><span style="font-size:10.0pt;font-family:Verdana">:  2171- 2178.</span>&nbsp;&nbsp;&nbsp;&nbsp;&nbsp;&nbsp;&nbsp;&nbsp;[&#160;<a href="javascript:void(0);" onclick="javascript: window.open('/scielo.php?script=sci_nlinks&ref=981630&pid=S0378-1844200400040000600001&lng=','','width=640,height=500,resizable=yes,scrollbars=1,menubar=yes,');">Links</a>&#160;]<!-- end-ref --><p style="margin:0cm;margin-bottom:.0001pt"> <span style="font-size:10.0pt; font-family:Verdana">&nbsp;</span></p>     <!-- ref --><p style="margin:0cm;margin-bottom:.0001pt"> <span style="font-size:10.0pt; font-family:Verdana">2. Ariz L, Jerez G, Pérez E, Potocnjack C (1994) <i>Bases  para la ordenación y desarrollo de las pesquerías artesanales del recurso macha </i>(M donacium) <i>en Chile Central</i>. Informe Final. Instituto de Fomento  Pesquero (IFOP): Valparaiso, Chile. 61 pp.</span>&nbsp;&nbsp;&nbsp;&nbsp;&nbsp;&nbsp;&nbsp;&nbsp;[&#160;<a href="javascript:void(0);" onclick="javascript: window.open('/scielo.php?script=sci_nlinks&ref=981632&pid=S0378-1844200400040000600002&lng=','','width=640,height=500,resizable=yes,scrollbars=1,menubar=yes,');">Links</a>&#160;]<!-- end-ref --><p style="margin:0cm;margin-bottom:.0001pt"> <span style="font-size:10.0pt; font-family:Verdana">&nbsp;</span></p>     <!-- ref --><p style="margin:0cm;margin-bottom:.0001pt"> <span lang="EN-US" style="font-size: 10.0pt; font-family: Verdana">3.  Arreguín-Sánchez F (1996) Catchability: a key parameter for fish stock  assessment. <i>Rev.Fish. Biol.Fisheries 6</i>: 221-242.<i> </i></span>&nbsp;&nbsp;&nbsp;&nbsp;&nbsp;&nbsp;&nbsp;&nbsp;[&#160;<a href="javascript:void(0);" onclick="javascript: window.open('/scielo.php?script=sci_nlinks&ref=981634&pid=S0378-1844200400040000600003&lng=','','width=640,height=500,resizable=yes,scrollbars=1,menubar=yes,');">Links</a>&#160;]<!-- end-ref --><p style="margin:0cm;margin-bottom:.0001pt"> <span lang="EN-US" style="font-size: 10.0pt; font-family: Verdana">&nbsp;</span></p>     ]]></body>
<body><![CDATA[<!-- ref --><p style="margin:0cm;margin-bottom:.0001pt"> <span lang="EN-US" style="font-size: 10.0pt; font-family: Verdana">4. Atran SM,  Loesch JG (1995) An analysis of weekly fluctuations in catchability  coefficients. <i>Fish.Bull. 93</i>: 562-567.</span>&nbsp;&nbsp;&nbsp;&nbsp;&nbsp;&nbsp;&nbsp;&nbsp;[&#160;<a href="javascript:void(0);" onclick="javascript: window.open('/scielo.php?script=sci_nlinks&ref=981636&pid=S0378-1844200400040000600004&lng=','','width=640,height=500,resizable=yes,scrollbars=1,menubar=yes,');">Links</a>&#160;]<!-- end-ref --><p style="margin:0cm;margin-bottom:.0001pt"> <span lang="EN-US" style="font-size: 10.0pt; font-family: Verdana">&nbsp;</span></p>     <!-- ref --><p style="margin:0cm;margin-bottom:.0001pt"> <span lang="EN-US" style="font-size: 10.0pt; font-family: Verdana">5. Bannerot  SP, Austin CB (1983) Using frequency distribution of catch per unit of fishing  effort to measure fish-stock abundance. <i>Trans.Am.Fish.Soc. 112</i>: 608-617.</span>&nbsp;&nbsp;&nbsp;&nbsp;&nbsp;&nbsp;&nbsp;&nbsp;[&#160;<a href="javascript:void(0);" onclick="javascript: window.open('/scielo.php?script=sci_nlinks&ref=981638&pid=S0378-1844200400040000600005&lng=','','width=640,height=500,resizable=yes,scrollbars=1,menubar=yes,');">Links</a>&#160;]<!-- end-ref --><p style="margin:0cm;margin-bottom:.0001pt"> <span lang="EN-US" style="font-size: 10.0pt; font-family: Verdana">&nbsp;</span></p>     <!-- ref --><p style="margin:0cm;margin-bottom:.0001pt"> <span lang="EN-US" style="font-size: 10.0pt; font-family: Verdana">6. Baranov TY  (1918) On the question of the biological basis of fisheries. <i> Proc.Inst.Icht.Invest. 1</i>: 81-128.</span>&nbsp;&nbsp;&nbsp;&nbsp;&nbsp;&nbsp;&nbsp;&nbsp;[&#160;<a href="javascript:void(0);" onclick="javascript: window.open('/scielo.php?script=sci_nlinks&ref=981640&pid=S0378-1844200400040000600006&lng=','','width=640,height=500,resizable=yes,scrollbars=1,menubar=yes,');">Links</a>&#160;]<!-- end-ref --><p style="margin:0cm;margin-bottom:.0001pt"> <span lang="EN-US" style="font-size: 10.0pt; font-family: Verdana">&nbsp;</span></p>     <!-- ref --><p style="margin:0cm;margin-bottom:.0001pt"> <span lang="EN-US" style="font-size: 10.0pt; font-family: Verdana">7. Caddy JF  (1975) Spatial models for an exploited shellfish population, and its application  to Georges Bank scallop fishery. <i>J.Fish.Res.Board.Can. 32</i>: 1305-1328.</span>&nbsp;&nbsp;&nbsp;&nbsp;&nbsp;&nbsp;&nbsp;&nbsp;[&#160;<a href="javascript:void(0);" onclick="javascript: window.open('/scielo.php?script=sci_nlinks&ref=981642&pid=S0378-1844200400040000600007&lng=','','width=640,height=500,resizable=yes,scrollbars=1,menubar=yes,');">Links</a>&#160;]<!-- end-ref --><p style="margin:0cm;margin-bottom:.0001pt"> <span lang="EN-US" style="font-size: 10.0pt; font-family: Verdana">&nbsp;</span></p>     <!-- ref --><p style="margin:0cm;margin-bottom:.0001pt"> <span lang="EN-US" style="font-size: 10.0pt; font-family: Verdana">8. Castilla  JC (1994) The Chilean small-scale benthic shellfisheries and the  institutionalization of new management practices. </span><i> <span style="font-size:10.0pt;font-family:Verdana">Ecol.Internat.Bull. 21</span></i><span style="font-size:10.0pt;font-family:Verdana">:  47-63.</span>&nbsp;&nbsp;&nbsp;&nbsp;&nbsp;&nbsp;&nbsp;&nbsp;[&#160;<a href="javascript:void(0);" onclick="javascript: window.open('/scielo.php?script=sci_nlinks&ref=981644&pid=S0378-1844200400040000600008&lng=','','width=640,height=500,resizable=yes,scrollbars=1,menubar=yes,');">Links</a>&#160;]<!-- end-ref --><p style="margin:0cm;margin-bottom:.0001pt"> <span style="font-size:10.0pt; font-family:Verdana">&nbsp;</span></p>     ]]></body>
<body><![CDATA[<!-- ref --><p style="margin:0cm;margin-bottom:.0001pt"> <span style="font-size:10.0pt; font-family:Verdana">9. Chávez &nbsp;J (2000) <i>Análisis dinámico del coeficiente de  capturabilidad y sus implicancias en la modelación de pesquerías</i>: Mesodesma  donacium <i>en el banco de bahía Coquimbo, un estudio de caso</i>. </span> <span lang="EN-US" style="font-size: 10.0pt; font-family: Verdana">Tesis.  Universidad Católica del Norte. Chile. 90 pp.</span>&nbsp;&nbsp;&nbsp;&nbsp;&nbsp;&nbsp;&nbsp;&nbsp;[&#160;<a href="javascript:void(0);" onclick="javascript: window.open('/scielo.php?script=sci_nlinks&ref=981646&pid=S0378-1844200400040000600009&lng=','','width=640,height=500,resizable=yes,scrollbars=1,menubar=yes,');">Links</a>&#160;]<!-- end-ref --><p style="margin:0cm;margin-bottom:.0001pt"> <span lang="EN-US" style="font-size: 10.0pt; font-family: Verdana">&nbsp;</span></p>     <!-- ref --><p style="margin:0cm;margin-bottom:.0001pt"> <span lang="EN-US" style="font-size: 10.0pt; font-family: Verdana">10. Collins  JJ (1987) Increased catchability of the deep monofilament nylon gillnet and its  expression in a simulated fishery. <i>Can.J.Fish.Aquat.Sci. 44</i> ( Suppl. 2):  129-135.</span>&nbsp;&nbsp;&nbsp;&nbsp;&nbsp;&nbsp;&nbsp;&nbsp;[&#160;<a href="javascript:void(0);" onclick="javascript: window.open('/scielo.php?script=sci_nlinks&ref=981648&pid=S0378-1844200400040000600010&lng=','','width=640,height=500,resizable=yes,scrollbars=1,menubar=yes,');">Links</a>&#160;]<!-- end-ref --><p style="margin:0cm;margin-bottom:.0001pt"> <span lang="EN-US" style="font-size: 10.0pt; font-family: Verdana">&nbsp;</span></p>     <!-- ref --><p style="margin:0cm;margin-bottom:.0001pt"> <span lang="EN-US" style="font-size: 10.0pt; font-family: Verdana">11. Crecco  VA, Overholtz W (1990) Causes of density- dependent catchability for Georges  Bank haddock <i>Melanogrammus aeglefinus</i>. <i>Can.J.Fish.Aquat.Sci. 47</i>:  385-394.</span>&nbsp;&nbsp;&nbsp;&nbsp;&nbsp;&nbsp;&nbsp;&nbsp;[&#160;<a href="javascript:void(0);" onclick="javascript: window.open('/scielo.php?script=sci_nlinks&ref=981650&pid=S0378-1844200400040000600011&lng=','','width=640,height=500,resizable=yes,scrollbars=1,menubar=yes,');">Links</a>&#160;]<!-- end-ref --><p style="margin:0cm;margin-bottom:.0001pt"> <span lang="EN-US" style="font-size: 10.0pt; font-family: Verdana">&nbsp;</span></p>     <!-- ref --><p style="margin:0cm;margin-bottom:.0001pt"> <span lang="EN-US" style="font-size: 10.0pt; font-family: Verdana">12. Crecco  VA, Savoy TF (1985) Density-dependent catchability and its potential causes and  consequences on Connecticut River American Shad, <i>Alosa sapidissima</i>. <i> Can.J.Fish.Aquat.Sci. 42</i>: 1649-1657.</span>&nbsp;&nbsp;&nbsp;&nbsp;&nbsp;&nbsp;&nbsp;&nbsp;[&#160;<a href="javascript:void(0);" onclick="javascript: window.open('/scielo.php?script=sci_nlinks&ref=981652&pid=S0378-1844200400040000600012&lng=','','width=640,height=500,resizable=yes,scrollbars=1,menubar=yes,');">Links</a>&#160;]<!-- end-ref --><p style="margin:0cm;margin-bottom:.0001pt"> <span lang="EN-US" style="font-size: 10.0pt; font-family: Verdana">&nbsp;</span></p>     <!-- ref --><p style="margin:0cm;margin-bottom:.0001pt"> <span lang="EN-US" style="font-size: 10.0pt; font-family: Verdana">13. Godo OR,  Walsh SJ, Engas A (1999) Investigating density dependent catchability in bottom  trawl surveys. <i>ICES. J.Mar.Sci. 56</i>: 292- 298.</span>&nbsp;&nbsp;&nbsp;&nbsp;&nbsp;&nbsp;&nbsp;&nbsp;[&#160;<a href="javascript:void(0);" onclick="javascript: window.open('/scielo.php?script=sci_nlinks&ref=981654&pid=S0378-1844200400040000600013&lng=','','width=640,height=500,resizable=yes,scrollbars=1,menubar=yes,');">Links</a>&#160;]<!-- end-ref --><p style="margin:0cm;margin-bottom:.0001pt"> <span lang="EN-US" style="font-size: 10.0pt; font-family: Verdana">&nbsp;</span></p>     ]]></body>
<body><![CDATA[<!-- ref --><p style="margin:0cm;margin-bottom:.0001pt"> <span lang="EN-US" style="font-size: 10.0pt; font-family: Verdana">14. Gordoa A,  Hightower JE (1991) Changes in catchability in a bottom-trawl fishery for Cape  Hake (<i>Merluccius capensis</i>). <i>Can.J Fish.Aquat.Sci. 48</i>: 1887-1895.</span>&nbsp;&nbsp;&nbsp;&nbsp;&nbsp;&nbsp;&nbsp;&nbsp;[&#160;<a href="javascript:void(0);" onclick="javascript: window.open('/scielo.php?script=sci_nlinks&ref=981656&pid=S0378-1844200400040000600014&lng=','','width=640,height=500,resizable=yes,scrollbars=1,menubar=yes,');">Links</a>&#160;]<!-- end-ref --><p style="margin:0cm;margin-bottom:.0001pt"> <span lang="EN-US" style="font-size: 10.0pt; font-family: Verdana">&nbsp;</span></p>     <!-- ref --><p style="margin:0cm;margin-bottom:.0001pt"> <span lang="EN-US" style="font-size: 10.0pt; font-family: Verdana">15. Gulland  &nbsp;JA &nbsp;( 1983) <i>Fish Stock Assessment. A manual for basic Methods</i>. Wiley.  New York, USA. 223 pp.</span>&nbsp;&nbsp;&nbsp;&nbsp;&nbsp;&nbsp;&nbsp;&nbsp;[&#160;<a href="javascript:void(0);" onclick="javascript: window.open('/scielo.php?script=sci_nlinks&ref=981658&pid=S0378-1844200400040000600015&lng=','','width=640,height=500,resizable=yes,scrollbars=1,menubar=yes,');">Links</a>&#160;]<!-- end-ref --><p style="margin:0cm;margin-bottom:.0001pt"> <span lang="EN-US" style="font-size: 10.0pt; font-family: Verdana">&nbsp;</span></p>     <!-- ref --><p style="margin:0cm;margin-bottom:.0001pt"> <span lang="EN-US" style="font-size: 10.0pt; font-family: Verdana">16. Hansen MJ,  Beard TD, Hewett SW (2000) Catch rates and catchability of walleyes in angling  and spearing fisheries in Northern Wisconsin lakes. <i>North Am.J.Fish.Manag. 20</i>:  109-118.</span>&nbsp;&nbsp;&nbsp;&nbsp;&nbsp;&nbsp;&nbsp;&nbsp;[&#160;<a href="javascript:void(0);" onclick="javascript: window.open('/scielo.php?script=sci_nlinks&ref=981660&pid=S0378-1844200400040000600016&lng=','','width=640,height=500,resizable=yes,scrollbars=1,menubar=yes,');">Links</a>&#160;]<!-- end-ref --><p style="margin:0cm;margin-bottom:.0001pt"> <span lang="EN-US" style="font-size: 10.0pt; font-family: Verdana">&nbsp;</span></p>     <!-- ref --><p style="margin:0cm;margin-bottom:.0001pt"> <span lang="EN-US" style="font-size: 10.0pt; font-family: Verdana">17. Hilborn  RF, Walters CJ (1992) <i>Quantitative fisheries stock assessment. Choice,  dynamics and uncertainty</i>. Routledeg, Chapman and Hall: New York, USA. 570  pp.</span>&nbsp;&nbsp;&nbsp;&nbsp;&nbsp;&nbsp;&nbsp;&nbsp;[&#160;<a href="javascript:void(0);" onclick="javascript: window.open('/scielo.php?script=sci_nlinks&ref=981662&pid=S0378-1844200400040000600017&lng=','','width=640,height=500,resizable=yes,scrollbars=1,menubar=yes,');">Links</a>&#160;]<!-- end-ref --><p style="margin:0cm;margin-bottom:.0001pt"> <span lang="EN-US" style="font-size: 10.0pt; font-family: Verdana">&nbsp;</span></p>     <!-- ref --><p style="margin:0cm;margin-bottom:.0001pt"> <span lang="EN-US" style="font-size: 10.0pt; font-family: Verdana">18. Kirkwood  GP, Aukland R, Zara SJ (2001) <i>Catch effort data analysis (CEDA)</i>,. Version  30</span><span lang="EN-US" style="font-size: 11.0pt; font-family: Arial; color: red"> </span><span lang="EN-US" style="font-size: 10.0pt; font-family: Verdana">&nbsp;MRAG:  London, UK..</span>&nbsp;&nbsp;&nbsp;&nbsp;&nbsp;&nbsp;&nbsp;&nbsp;[&#160;<a href="javascript:void(0);" onclick="javascript: window.open('/scielo.php?script=sci_nlinks&ref=981664&pid=S0378-1844200400040000600018&lng=','','width=640,height=500,resizable=yes,scrollbars=1,menubar=yes,');">Links</a>&#160;]<!-- end-ref --><p style="margin:0cm;margin-bottom:.0001pt"> <span lang="EN-US" style="font-size: 10.0pt; font-family: Verdana">&nbsp;</span></p>     ]]></body>
<body><![CDATA[<!-- ref --><p style="margin:0cm;margin-bottom:.0001pt"> <span lang="EN-US" style="font-size: 10.0pt; font-family: Verdana">19. MacCall  AD (1976) Density-dependence of catchability coefficient in the California  Pacific sardine, <i>Sardinops sagax caerulea</i>, purse seine fishery.  California Coop. Ocean. <i>Fish.Inv.Rep. 18</i>: 136-148.</span>&nbsp;&nbsp;&nbsp;&nbsp;&nbsp;&nbsp;&nbsp;&nbsp;[&#160;<a href="javascript:void(0);" onclick="javascript: window.open('/scielo.php?script=sci_nlinks&ref=981666&pid=S0378-1844200400040000600019&lng=','','width=640,height=500,resizable=yes,scrollbars=1,menubar=yes,');">Links</a>&#160;]<!-- end-ref --><p style="margin:0cm;margin-bottom:.0001pt"> <span lang="EN-US" style="font-size: 10.0pt; font-family: Verdana">&nbsp;</span></p>     <!-- ref --><p style="margin:0cm;margin-bottom:.0001pt"> <span lang="EN-US" style="font-size: 10.0pt; font-family: Verdana">20. Manly BFJ  (1991) Randomization and Monte Carlo methods in biology. Chapman and Hall: New  York, USA. 281 pp.</span>&nbsp;&nbsp;&nbsp;&nbsp;&nbsp;&nbsp;&nbsp;&nbsp;[&#160;<a href="javascript:void(0);" onclick="javascript: window.open('/scielo.php?script=sci_nlinks&ref=981668&pid=S0378-1844200400040000600020&lng=','','width=640,height=500,resizable=yes,scrollbars=1,menubar=yes,');">Links</a>&#160;]<!-- end-ref --><p style="margin:0cm;margin-bottom:.0001pt"> <span lang="EN-US" style="font-size: 10.0pt; font-family: Verdana">&nbsp;</span></p>     <!-- ref --><p style="margin:0cm;margin-bottom:.0001pt"> <span lang="EN-US" style="font-size: 10.0pt; font-family: Verdana">21. Paloheimo  &nbsp;JE, Dickie &nbsp;LM &nbsp;( 1964) Abundance and fishing success. </span> <span style="font-size:10.0pt;font-family: Verdana">In <i>ICES Rapp. P. - v. Réun. 155</i>: 152-162.</span>&nbsp;&nbsp;&nbsp;&nbsp;&nbsp;&nbsp;&nbsp;&nbsp;[&#160;<a href="javascript:void(0);" onclick="javascript: window.open('/scielo.php?script=sci_nlinks&ref=981670&pid=S0378-1844200400040000600021&lng=','','width=640,height=500,resizable=yes,scrollbars=1,menubar=yes,');">Links</a>&#160;]<!-- end-ref --><p style="margin:0cm;margin-bottom:.0001pt"> <span style="font-size:10.0pt; font-family:Verdana">&nbsp;</span></p>     <!-- ref --><p style="margin:0cm;margin-bottom:.0001pt"> <span style="font-size:10.0pt; font-family:Verdana">22. Pérez &nbsp;EP &nbsp;( 1996) <i>Análisis de la pesquería de </i> Mesodesma donacium <i>en el banco de Peñuelas</i> <i>(Chile, IV región), bajo  condiciones de riesgo e incertidumbre</i>. </span> <span lang="EN-US" style="font-size: 10.0pt; font-family: Verdana">Thesis.  CINVESTAVIPN. Merida, Yucatan. Mexico. 82pp.</span>&nbsp;&nbsp;&nbsp;&nbsp;&nbsp;&nbsp;&nbsp;&nbsp;[&#160;<a href="javascript:void(0);" onclick="javascript: window.open('/scielo.php?script=sci_nlinks&ref=981672&pid=S0378-1844200400040000600022&lng=','','width=640,height=500,resizable=yes,scrollbars=1,menubar=yes,');">Links</a>&#160;]<!-- end-ref --><p style="margin:0cm;margin-bottom:.0001pt"> <span lang="EN-US" style="font-size: 10.0pt; font-family: Verdana">&nbsp;</span></p>     <!-- ref --><p style="margin:0cm;margin-bottom:.0001pt"> <span lang="EN-US" style="font-size: 10.0pt; font-family: Verdana">23. Pérez EP,  Defeo O (2003) Time-space variation in the catchability coefficient as a  function of match per unit of effort in <i>Heterocarpus reedi </i>(Decapoda,  Pandalidae) in North-Central Chile. </span><i> <span style="font-size: 10.0pt;font-family:Verdana">Interciencia 28</span></i><span style="font-size: 10.0pt;font-family:Verdana">: 178-182.</span>&nbsp;&nbsp;&nbsp;&nbsp;&nbsp;&nbsp;&nbsp;&nbsp;[&#160;<a href="javascript:void(0);" onclick="javascript: window.open('/scielo.php?script=sci_nlinks&ref=981674&pid=S0378-1844200400040000600023&lng=','','width=640,height=500,resizable=yes,scrollbars=1,menubar=yes,');">Links</a>&#160;]<!-- end-ref --><p style="margin:0cm;margin-bottom:.0001pt"> <span style="font-size:10.0pt; font-family:Verdana">&nbsp;</span></p>     ]]></body>
<body><![CDATA[<!-- ref --><p style="margin:0cm;margin-bottom:.0001pt"> <span style="font-size:10.0pt; font-family:Verdana">24. Pérez E, Arias JL, Arias E, Defeo O, Stotz W,  Valdebenito M (1998) Caraterización bioeconómica de la pesquería del recurso  macha en la zona norte y centro sur de Chile. Final Report. Universidad Católica  del Norte/Fondo de Investigación Pesquera (FIP): Coquimbo, Chile. </span> <span lang="EN-US" style="font-size: 10.0pt; font-family: Verdana">232 pp.</span>&nbsp;&nbsp;&nbsp;&nbsp;&nbsp;&nbsp;&nbsp;&nbsp;[&#160;<a href="javascript:void(0);" onclick="javascript: window.open('/scielo.php?script=sci_nlinks&ref=981676&pid=S0378-1844200400040000600024&lng=','','width=640,height=500,resizable=yes,scrollbars=1,menubar=yes,');">Links</a>&#160;]<!-- end-ref --><p style="margin:0cm;margin-bottom:.0001pt"> <span lang="EN-US" style="font-size: 10.0pt; font-family: Verdana">&nbsp;</span></p>     <!-- ref --><p style="margin:0cm;margin-bottom:.0001pt"> <span lang="EN-US" style="font-size: 10.0pt; font-family: Verdana">25. Peterman  RM, Steer GJ (1981) Relation between sportfishing catchability coefficients and  salmon abundance. <i>Trans.Am.Fish.Soc. 114</i>: 436-440.</span>&nbsp;&nbsp;&nbsp;&nbsp;&nbsp;&nbsp;&nbsp;&nbsp;[&#160;<a href="javascript:void(0);" onclick="javascript: window.open('/scielo.php?script=sci_nlinks&ref=981678&pid=S0378-1844200400040000600025&lng=','','width=640,height=500,resizable=yes,scrollbars=1,menubar=yes,');">Links</a>&#160;]<!-- end-ref --><p style="margin:0cm;margin-bottom:.0001pt"> <span lang="EN-US" style="font-size: 10.0pt; font-family: Verdana">&nbsp;</span></p>     <!-- ref --><p style="margin:0cm;margin-bottom:.0001pt"> <span lang="EN-US" style="font-size: 10.0pt; font-family: Verdana">26. Richards  LJ, Schnute JT (1986) An experimental and statistical approach to the question:  Is CPUE an index of abundance ?. </span><i> <span lang="FR" style="font-size: 10.0pt; font-family: Verdana"> Can.J.Fish.Aquat.Sci. 43</span></i><span lang="FR" style="font-size: 10.0pt; font-family: Verdana">:  1214-1227.</span>&nbsp;&nbsp;&nbsp;&nbsp;&nbsp;&nbsp;&nbsp;&nbsp;[&#160;<a href="javascript:void(0);" onclick="javascript: window.open('/scielo.php?script=sci_nlinks&ref=981680&pid=S0378-1844200400040000600026&lng=','','width=640,height=500,resizable=yes,scrollbars=1,menubar=yes,');">Links</a>&#160;]<!-- end-ref --><p style="margin:0cm;margin-bottom:.0001pt"> <span lang="FR" style="font-size: 10.0pt; font-family: Verdana">&nbsp;</span></p>     <!-- ref --><p style="margin:0cm;margin-bottom:.0001pt"> <span lang="FR" style="font-size: 10.0pt; font-family: Verdana">27. Restrepo &nbsp;VR  &nbsp;( 2001) Dynamic depletion models. </span> <span lang="EN-US" style="font-size: 10.0pt; font-family: Verdana">In <i> &nbsp;Regional Workshop on the assessment of the Caribbean spiny lobster </i>(Panulirus  argus). FAO &nbsp;Fisheries Report Nº619. Rome, Italy. pp. 345-356.</span>&nbsp;&nbsp;&nbsp;&nbsp;&nbsp;&nbsp;&nbsp;&nbsp;[&#160;<a href="javascript:void(0);" onclick="javascript: window.open('/scielo.php?script=sci_nlinks&ref=981682&pid=S0378-1844200400040000600027&lng=','','width=640,height=500,resizable=yes,scrollbars=1,menubar=yes,');">Links</a>&#160;]<!-- end-ref --><p style="margin:0cm;margin-bottom:.0001pt"> <span lang="EN-US" style="font-size: 10.0pt; font-family: Verdana">&nbsp;</span></p>     <!-- ref --><p style="margin:0cm;margin-bottom:.0001pt"> <span lang="EN-US" style="font-size: 10.0pt; font-family: Verdana">28. Seijo &nbsp;JC,  Caddy &nbsp;JF, Euán &nbsp;J (1994) <i>SPATIAL: space-time dynamics in marine fisheries. A  software package for sedentary species</i>. Comp. Inf. Ser. Fish. </span> <span style="font-size:10.0pt;font-family:Verdana">Nº6. FAO. Rome, Italy. 116  pp.</span>&nbsp;&nbsp;&nbsp;&nbsp;&nbsp;&nbsp;&nbsp;&nbsp;[&#160;<a href="javascript:void(0);" onclick="javascript: window.open('/scielo.php?script=sci_nlinks&ref=981684&pid=S0378-1844200400040000600028&lng=','','width=640,height=500,resizable=yes,scrollbars=1,menubar=yes,');">Links</a>&#160;]<!-- end-ref --><p style="margin:0cm;margin-bottom:.0001pt"> <span style="font-size:10.0pt; font-family:Verdana">&nbsp;</span></p>     ]]></body>
<body><![CDATA[<!-- ref --><p style="margin:0cm;margin-bottom:.0001pt"> <span style="font-size:10.0pt; font-family:Verdana">29. Seijo &nbsp;JC, Defeo &nbsp;O, Salas &nbsp;S (1997) <i>Bioeconomía  pesquera: Teoría, modelación y manejo</i>. </span> <span lang="EN-US" style="font-size: 10.0pt; font-family: Verdana">Documento  técnico de pesca Nº 368. FAO. Rome, Italy. 176 pp.</span>&nbsp;&nbsp;&nbsp;&nbsp;&nbsp;&nbsp;&nbsp;&nbsp;[&#160;<a href="javascript:void(0);" onclick="javascript: window.open('/scielo.php?script=sci_nlinks&ref=981686&pid=S0378-1844200400040000600029&lng=','','width=640,height=500,resizable=yes,scrollbars=1,menubar=yes,');">Links</a>&#160;]<!-- end-ref --><p style="margin:0cm;margin-bottom:.0001pt"> <span lang="EN-US" style="font-size: 10.0pt; font-family: Verdana">&nbsp;</span></p>     <!-- ref --><p style="margin:0cm;margin-bottom:.0001pt"> <span lang="EN-US" style="font-size: 10.0pt; font-family: Verdana">30. Swain DP,  Poirier GA, Sinclair AF (2000) Effect of water temperature on catchability of  Atlantic cod <i>Gadus morhua) </i>to the bottomtrawl survey in the southern Gulf  of St Lawrence. <i>ICES J.Mar.Sci. 57</i>: 56-68.</span>&nbsp;&nbsp;&nbsp;&nbsp;&nbsp;&nbsp;&nbsp;&nbsp;[&#160;<a href="javascript:void(0);" onclick="javascript: window.open('/scielo.php?script=sci_nlinks&ref=981688&pid=S0378-1844200400040000600030&lng=','','width=640,height=500,resizable=yes,scrollbars=1,menubar=yes,');">Links</a>&#160;]<!-- end-ref --><p style="margin:0cm;margin-bottom:.0001pt"> <span lang="EN-US" style="font-size: 10.0pt; font-family: Verdana">&nbsp;</span></p>     <!-- ref --><p style="margin:0cm;margin-bottom:.0001pt"> <span lang="EN-US" style="font-size: 10.0pt; font-family: Verdana">31. Ulltang Ø  (1976) Catch per unit of effort in the Norwegian purse seine fishery for Atlanto-  Scandinavian herring. <i>Fao Fish.Tech.Pap. 155</i>: 91-101.</span>&nbsp;&nbsp;&nbsp;&nbsp;&nbsp;&nbsp;&nbsp;&nbsp;[&#160;<a href="javascript:void(0);" onclick="javascript: window.open('/scielo.php?script=sci_nlinks&ref=981690&pid=S0378-1844200400040000600031&lng=','','width=640,height=500,resizable=yes,scrollbars=1,menubar=yes,');">Links</a>&#160;]<!-- end-ref --><p style="margin:0cm;margin-bottom:.0001pt"> <span lang="EN-US" style="font-size: 10.0pt; font-family: Verdana">&nbsp;</span></p>     <!-- ref --><p style="margin:0cm;margin-bottom:.0001pt"> <span lang="EN-US" style="font-size: 10.0pt; font-family: Verdana">32. Winters  GH, Wheeler JP (1985) Interaction between stock area, stock abundance, and  catchability coefficient. <i>Can.J.Fish.Aquat.Sci. 42</i>: 989-998.</span>&nbsp;&nbsp;&nbsp;&nbsp;&nbsp;&nbsp;&nbsp;&nbsp;[&#160;<a href="javascript:void(0);" onclick="javascript: window.open('/scielo.php?script=sci_nlinks&ref=981692&pid=S0378-1844200400040000600032&lng=','','width=640,height=500,resizable=yes,scrollbars=1,menubar=yes,');">Links</a>&#160;]<!-- end-ref --><p style="margin:0cm;margin-bottom:.0001pt"> <span lang="EN-US" style="font-size: 10.0pt; font-family: Verdana">&nbsp;</span></p>     <!-- ref --><p style="margin:0cm;margin-bottom:.0001pt"> <span lang="EN-US" style="font-size: 10.0pt; font-family: Verdana">33. Ye Y,  Mohammed H (1999) An analysis of variation in catchability of green tiger prawn, <i>Penaeus semisulcatus </i>in waters off Kuwait. <i>Fish.Bull. 97</i>: 702-712.</span>&nbsp;&nbsp;&nbsp;&nbsp;&nbsp;&nbsp;&nbsp;&nbsp;[&#160;<a href="javascript:void(0);" onclick="javascript: window.open('/scielo.php?script=sci_nlinks&ref=981694&pid=S0378-1844200400040000600033&lng=','','width=640,height=500,resizable=yes,scrollbars=1,menubar=yes,');">Links</a>&#160;]<!-- end-ref --><p style="margin:0cm;margin-bottom:.0001pt"> <span lang="EN-US" style="font-size: 10.0pt; font-family: Verdana">&nbsp;</span></p>     ]]></body>
<body><![CDATA[<!-- ref --><p><span lang="EN-US" style="font-size: 10.0pt; font-family: Verdana">34. Zar J  (1995) <i>Biostatistical Analysis</i>.. 3rd ed</span><span lang="EN-US" style="font-size: 11.0pt; font-family: Arial; color: red"> </span><span lang="EN-US" style="font-size: 10.0pt; font-family: Verdana"> &nbsp;Prentice-Hall. Englewood Cliffs: NJ, USA. 718 pp.</span>&nbsp;&nbsp;&nbsp;&nbsp;&nbsp;&nbsp;&nbsp;&nbsp;[&#160;<a href="javascript:void(0);" onclick="javascript: window.open('/scielo.php?script=sci_nlinks&ref=981696&pid=S0378-1844200400040000600034&lng=','','width=640,height=500,resizable=yes,scrollbars=1,menubar=yes,');">Links</a>&#160;]<!-- end-ref --> ]]></body>
<back>
<ref-list>
<ref id="B1">
<label>1</label><nlm-citation citation-type="journal">
<person-group person-group-type="author">
<name>
<surname><![CDATA[Angelsen]]></surname>
<given-names><![CDATA[KK]]></given-names>
</name>
<name>
<surname><![CDATA[Olsen]]></surname>
<given-names><![CDATA[S]]></given-names>
</name>
</person-group>
<article-title xml:lang="en"><![CDATA[Impact of fish density and effort level on catching efficiency of fishing gear]]></article-title>
<source><![CDATA[Fish. Res]]></source>
<year>1987</year>
<volume>. 5</volume>
<page-range>2171- 2178</page-range></nlm-citation>
</ref>
<ref id="B2">
<label>2</label><nlm-citation citation-type="book">
<person-group person-group-type="author">
<name>
<surname><![CDATA[Ariz]]></surname>
<given-names><![CDATA[L]]></given-names>
</name>
<name>
<surname><![CDATA[Jerez]]></surname>
<given-names><![CDATA[G]]></given-names>
</name>
<name>
<surname><![CDATA[Pérez]]></surname>
<given-names><![CDATA[E]]></given-names>
</name>
<name>
<surname><![CDATA[Potocnjack]]></surname>
<given-names><![CDATA[C]]></given-names>
</name>
</person-group>
<source><![CDATA[Bases para la ordenación y desarrollo de las pesquerías artesanales del recurso macha (M donacium) en Chile Central]]></source>
<year>1994</year>
<page-range>61 pp</page-range><publisher-loc><![CDATA[Valparaiso ]]></publisher-loc>
<publisher-name><![CDATA[Informe Final. Instituto de Fomento Pesquero (IFOP)]]></publisher-name>
</nlm-citation>
</ref>
<ref id="B3">
<label>3</label><nlm-citation citation-type="journal">
<person-group person-group-type="author">
<name>
<surname><![CDATA[Arreguín-Sánchez]]></surname>
<given-names><![CDATA[F]]></given-names>
</name>
</person-group>
<article-title xml:lang="en"><![CDATA[Catchability: a key parameter for fish stock assessment]]></article-title>
<source><![CDATA[Rev.Fish. Biol.Fisheries]]></source>
<year>1996</year>
<volume>6</volume>
<page-range>221-242</page-range></nlm-citation>
</ref>
<ref id="B4">
<label>4</label><nlm-citation citation-type="journal">
<person-group person-group-type="author">
<name>
<surname><![CDATA[Atran]]></surname>
<given-names><![CDATA[SM]]></given-names>
</name>
<name>
<surname><![CDATA[Loesch]]></surname>
<given-names><![CDATA[JG]]></given-names>
</name>
</person-group>
<article-title xml:lang="en"><![CDATA[An analysis of weekly fluctuations in catchability coefficients]]></article-title>
<source><![CDATA[Fish.Bull.]]></source>
<year>1995</year>
<volume>93</volume>
<page-range>562-567</page-range></nlm-citation>
</ref>
<ref id="B5">
<label>5</label><nlm-citation citation-type="journal">
<person-group person-group-type="author">
<name>
<surname><![CDATA[Bannerot]]></surname>
<given-names><![CDATA[SP]]></given-names>
</name>
<name>
<surname><![CDATA[Austin]]></surname>
<given-names><![CDATA[CB]]></given-names>
</name>
</person-group>
<article-title xml:lang="en"><![CDATA[Using frequency distribution of catch per unit of fishing effort to measure fish-stock abundance]]></article-title>
<source><![CDATA[Trans.Am.Fish.Soc.]]></source>
<year>1983</year>
<volume>112</volume>
<page-range>608-617</page-range></nlm-citation>
</ref>
<ref id="B6">
<label>6</label><nlm-citation citation-type="journal">
<person-group person-group-type="author">
<name>
<surname><![CDATA[Baranov]]></surname>
<given-names><![CDATA[TY]]></given-names>
</name>
</person-group>
<article-title xml:lang="en"><![CDATA[On the question of the biological basis of fisheries]]></article-title>
<source><![CDATA[Proc.Inst.Icht.Invest.]]></source>
<year>1918</year>
<volume>1</volume>
<page-range>81-128</page-range></nlm-citation>
</ref>
<ref id="B7">
<label>7</label><nlm-citation citation-type="journal">
<person-group person-group-type="author">
<name>
<surname><![CDATA[Caddy]]></surname>
<given-names><![CDATA[JF]]></given-names>
</name>
</person-group>
<article-title xml:lang="en"><![CDATA[Spatial models for an exploited shellfish population, and its application to Georges Bank scallop fishery]]></article-title>
<source><![CDATA[J.Fish.Res.Board.Can.]]></source>
<year>1975</year>
<volume>32</volume>
<page-range>1305-1328</page-range></nlm-citation>
</ref>
<ref id="B8">
<label>8</label><nlm-citation citation-type="journal">
<person-group person-group-type="author">
<name>
<surname><![CDATA[Castilla]]></surname>
<given-names><![CDATA[JC]]></given-names>
</name>
</person-group>
<article-title xml:lang="en"><![CDATA[The Chilean small-scale benthic shellfisheries and the institutionalization of new management practices]]></article-title>
<source><![CDATA[Ecol.Internat.Bull.]]></source>
<year>1994</year>
<volume>21</volume>
<page-range>47-63</page-range></nlm-citation>
</ref>
<ref id="B9">
<label>9</label><nlm-citation citation-type="">
<person-group person-group-type="author">
<name>
<surname><![CDATA[Chávez]]></surname>
<given-names><![CDATA[J]]></given-names>
</name>
</person-group>
<source><![CDATA[Análisis dinámico del coeficiente de capturabilidad y sus implicancias en la modelación de pesquerías: Mesodesma donacium en el banco de bahía Coquimbo, un estudio de caso]]></source>
<year>2000</year>
<page-range>90</page-range></nlm-citation>
</ref>
<ref id="B10">
<label>10</label><nlm-citation citation-type="journal">
<person-group person-group-type="author">
<name>
<surname><![CDATA[Collins]]></surname>
<given-names><![CDATA[JJ]]></given-names>
</name>
</person-group>
<article-title xml:lang="en"><![CDATA[Increased catchability of the deep monofilament nylon gillnet and its expression in a simulated fishery]]></article-title>
<source><![CDATA[Can.J.Fish.Aquat.Sci.]]></source>
<year>1987</year>
<volume>44</volume>
<numero>^s2</numero>
<issue>^s2</issue>
<supplement>2</supplement>
<page-range>129-135</page-range></nlm-citation>
</ref>
<ref id="B11">
<label>11</label><nlm-citation citation-type="journal">
<person-group person-group-type="author">
<name>
<surname><![CDATA[Crecco]]></surname>
<given-names><![CDATA[VA]]></given-names>
</name>
<name>
<surname><![CDATA[Overholtz]]></surname>
<given-names><![CDATA[W]]></given-names>
</name>
</person-group>
<article-title xml:lang="en"><![CDATA[Causes of density- dependent catchability for Georges Bank haddock Melanogrammus aeglefinus]]></article-title>
<source><![CDATA[Can.J.Fish.Aquat.Sci.]]></source>
<year>1990</year>
<volume>47</volume>
<page-range>385-394</page-range></nlm-citation>
</ref>
<ref id="B12">
<label>12</label><nlm-citation citation-type="journal">
<person-group person-group-type="author">
<name>
<surname><![CDATA[Crecco]]></surname>
<given-names><![CDATA[VA]]></given-names>
</name>
<name>
<surname><![CDATA[Savoy]]></surname>
<given-names><![CDATA[TF]]></given-names>
</name>
</person-group>
<article-title xml:lang="en"><![CDATA[Density-dependent catchability and its potential causes and consequences on Connecticut River American Shad, Alosa sapidissima]]></article-title>
<source><![CDATA[Can.J.Fish.Aquat.Sci.]]></source>
<year>1985</year>
<volume>42</volume>
<page-range>1649-1657</page-range></nlm-citation>
</ref>
<ref id="B13">
<label>13</label><nlm-citation citation-type="journal">
<person-group person-group-type="author">
<name>
<surname><![CDATA[Godo]]></surname>
<given-names><![CDATA[OR]]></given-names>
</name>
<name>
<surname><![CDATA[Walsh]]></surname>
<given-names><![CDATA[SJ]]></given-names>
</name>
<name>
<surname><![CDATA[Engas]]></surname>
<given-names><![CDATA[A]]></given-names>
</name>
</person-group>
<article-title xml:lang="en"><![CDATA[Investigating density dependent catchability in bottom trawl surveys]]></article-title>
<source><![CDATA[ICES.]]></source>
<year>1999</year>
<volume>J.Mar.Sci. 56</volume>
<page-range>292- 298</page-range></nlm-citation>
</ref>
<ref id="B14">
<label>14</label><nlm-citation citation-type="journal">
<person-group person-group-type="author">
<name>
<surname><![CDATA[Gordoa]]></surname>
<given-names><![CDATA[A]]></given-names>
</name>
<name>
<surname><![CDATA[Hightower]]></surname>
<given-names><![CDATA[JE]]></given-names>
</name>
</person-group>
<article-title xml:lang="en"><![CDATA[Changes in catchability in a bottom-trawl fishery for Cape Hake (Merluccius capensis)]]></article-title>
<source><![CDATA[Can.J]]></source>
<year>1991</year>
<volume>Fish.Aquat.Sci. 48</volume>
<page-range>1887-1895</page-range></nlm-citation>
</ref>
<ref id="B15">
<label>15</label><nlm-citation citation-type="book">
<person-group person-group-type="author">
<name>
<surname><![CDATA[Gulland]]></surname>
<given-names><![CDATA[JA]]></given-names>
</name>
</person-group>
<source><![CDATA[Fish Stock Assessment: A manual for basic Methods]]></source>
<year>1983</year>
<page-range>223</page-range><publisher-loc><![CDATA[New York ]]></publisher-loc>
<publisher-name><![CDATA[Wiley]]></publisher-name>
</nlm-citation>
</ref>
<ref id="B16">
<label>16</label><nlm-citation citation-type="journal">
<person-group person-group-type="author">
<name>
<surname><![CDATA[Hansen]]></surname>
<given-names><![CDATA[MJ]]></given-names>
</name>
<name>
<surname><![CDATA[Beard]]></surname>
<given-names><![CDATA[TD]]></given-names>
</name>
<name>
<surname><![CDATA[Hewett]]></surname>
<given-names><![CDATA[SW]]></given-names>
</name>
</person-group>
<article-title xml:lang="en"><![CDATA[Catch rates and catchability of walleyes in angling and spearing fisheries in Northern Wisconsin lakes]]></article-title>
<source><![CDATA[North]]></source>
<year>2000</year>
<volume>Am.J.Fish.Manag. 20</volume>
<page-range>109-118</page-range></nlm-citation>
</ref>
<ref id="B17">
<label>17</label><nlm-citation citation-type="book">
<person-group person-group-type="author">
<name>
<surname><![CDATA[Hilborn]]></surname>
<given-names><![CDATA[RF]]></given-names>
</name>
<name>
<surname><![CDATA[Walters]]></surname>
<given-names><![CDATA[CJ]]></given-names>
</name>
</person-group>
<source><![CDATA[Quantitative fisheries stock assessment]]></source>
<year>1992</year>
<page-range>570 pp</page-range><publisher-loc><![CDATA[New York ]]></publisher-loc>
<publisher-name><![CDATA[Choice, dynamics and uncertainty. Routledeg, Chapman and Hall]]></publisher-name>
</nlm-citation>
</ref>
<ref id="B18">
<label>18</label><nlm-citation citation-type="book">
<person-group person-group-type="author">
<name>
<surname><![CDATA[Kirkwood]]></surname>
<given-names><![CDATA[GP]]></given-names>
</name>
<name>
<surname><![CDATA[Aukland]]></surname>
<given-names><![CDATA[R]]></given-names>
</name>
<name>
<surname><![CDATA[Zara]]></surname>
<given-names><![CDATA[SJ]]></given-names>
</name>
</person-group>
<source><![CDATA[Catch effort data analysis (CEDA),]]></source>
<year>2001</year>
<publisher-loc><![CDATA[London ]]></publisher-loc>
<publisher-name><![CDATA[MRAG]]></publisher-name>
</nlm-citation>
</ref>
<ref id="B19">
<label>19</label><nlm-citation citation-type="journal">
<person-group person-group-type="author">
<name>
<surname><![CDATA[MacCall]]></surname>
<given-names><![CDATA[AD]]></given-names>
</name>
</person-group>
<article-title xml:lang="en"><![CDATA[Density-dependence of catchability coefficient in the California Pacific sardine, Sardinops sagax caerulea, purse seine fishery]]></article-title>
<source><![CDATA[California]]></source>
<year>1976</year>
<volume>Coop. Ocean. Fish.Inv.Rep. 18</volume>
<page-range>136-148</page-range></nlm-citation>
</ref>
<ref id="B20">
<label>20</label><nlm-citation citation-type="book">
<person-group person-group-type="author">
<name>
<surname><![CDATA[Manly]]></surname>
<given-names><![CDATA[BFJ]]></given-names>
</name>
</person-group>
<source><![CDATA[Randomization and Monte Carlo methods in biology]]></source>
<year>1991</year>
<page-range>281 pp</page-range><publisher-loc><![CDATA[New York ]]></publisher-loc>
<publisher-name><![CDATA[Chapman and Hall]]></publisher-name>
</nlm-citation>
</ref>
<ref id="B21">
<label>21</label><nlm-citation citation-type="">
<person-group person-group-type="author">
<name>
<surname><![CDATA[Paloheimo]]></surname>
<given-names><![CDATA[JE]]></given-names>
</name>
<name>
<surname><![CDATA[Dickie]]></surname>
<given-names><![CDATA[LM]]></given-names>
</name>
</person-group>
<source><![CDATA[Abundance and fishing success.]]></source>
<year>1964</year>
<volume>155</volume>
<page-range>152-162</page-range></nlm-citation>
</ref>
<ref id="B22">
<label>22</label><nlm-citation citation-type="">
<person-group person-group-type="author">
<name>
<surname><![CDATA[Pérez]]></surname>
<given-names><![CDATA[EP]]></given-names>
</name>
</person-group>
<source><![CDATA[Análisis de la pesquería de Mesodesma donacium en el banco de Peñuelas (Chile, IV región), bajo condiciones de riesgo e incertidumbre]]></source>
<year>1996</year>
<page-range>82pp</page-range></nlm-citation>
</ref>
<ref id="B23">
<label>23</label><nlm-citation citation-type="journal">
<person-group person-group-type="author">
<name>
<surname><![CDATA[Pérez]]></surname>
<given-names><![CDATA[EP]]></given-names>
</name>
<name>
<surname><![CDATA[Defeo]]></surname>
<given-names><![CDATA[O]]></given-names>
</name>
</person-group>
<article-title xml:lang="en"><![CDATA[Time-space variation in the catchability coefficient as a function of match per unit of effort in Heterocarpus reedi (Decapoda, Pandalidae) in North-Central Chile]]></article-title>
<source><![CDATA[Interciencia]]></source>
<year>2003</year>
<volume>28</volume>
<page-range>178-182</page-range></nlm-citation>
</ref>
<ref id="B24">
<label>24</label><nlm-citation citation-type="book">
<person-group person-group-type="author">
<name>
<surname><![CDATA[Pérez]]></surname>
<given-names><![CDATA[E]]></given-names>
</name>
<name>
<surname><![CDATA[Arias]]></surname>
<given-names><![CDATA[JL]]></given-names>
</name>
<name>
<surname><![CDATA[Arias]]></surname>
<given-names><![CDATA[E]]></given-names>
</name>
<name>
<surname><![CDATA[Defeo]]></surname>
<given-names><![CDATA[O]]></given-names>
</name>
<name>
<surname><![CDATA[Stotz]]></surname>
<given-names><![CDATA[W]]></given-names>
</name>
<name>
<surname><![CDATA[Valdebenito]]></surname>
<given-names><![CDATA[M]]></given-names>
</name>
</person-group>
<source><![CDATA[Caraterización bioeconómica de la pesquería del recurso macha en la zona norte y centro sur de Chile]]></source>
<year>1998</year>
<page-range>232 pp</page-range><publisher-loc><![CDATA[Coquimbo ]]></publisher-loc>
<publisher-name><![CDATA[Universidad Católica del Norte/Fondo de Investigación Pesquera (FIP)]]></publisher-name>
</nlm-citation>
</ref>
<ref id="B25">
<label>25</label><nlm-citation citation-type="journal">
<person-group person-group-type="author">
<name>
<surname><![CDATA[Peterman]]></surname>
<given-names><![CDATA[RM]]></given-names>
</name>
<name>
<surname><![CDATA[Steer]]></surname>
<given-names><![CDATA[GJ]]></given-names>
</name>
</person-group>
<article-title xml:lang="en"><![CDATA[Relation between sportfishing catchability coefficients and salmon abundance]]></article-title>
<source><![CDATA[Trans.Am.Fish.Soc.]]></source>
<year>1981</year>
<volume>114</volume>
<page-range>436-440</page-range></nlm-citation>
</ref>
<ref id="B26">
<label>26</label><nlm-citation citation-type="journal">
<person-group person-group-type="author">
<name>
<surname><![CDATA[Richards]]></surname>
<given-names><![CDATA[LJ]]></given-names>
</name>
<name>
<surname><![CDATA[Schnute]]></surname>
<given-names><![CDATA[JT]]></given-names>
</name>
</person-group>
<article-title xml:lang="en"><![CDATA[An experimental and statistical approach to the question: Is CPUE an index of abundance ?]]></article-title>
<source><![CDATA[Can.J.Fish.Aquat.Sci.]]></source>
<year>1986</year>
<volume>43</volume>
<page-range>1214-1227</page-range></nlm-citation>
</ref>
<ref id="B27">
<label>27</label><nlm-citation citation-type="book">
<person-group person-group-type="author">
<name>
<surname><![CDATA[Restrepo]]></surname>
<given-names><![CDATA[VR]]></given-names>
</name>
</person-group>
<article-title xml:lang="en"><![CDATA[Dynamic depletion models]]></article-title>
<source><![CDATA[Regional Workshop on the assessment of the Caribbean spiny lobster (Panulirus argus).]]></source>
<year>2001</year>
<page-range>345-356</page-range><publisher-loc><![CDATA[^eRome Rome]]></publisher-loc>
<publisher-name><![CDATA[FAO]]></publisher-name>
</nlm-citation>
</ref>
<ref id="B28">
<label>28</label><nlm-citation citation-type="book">
<person-group person-group-type="author">
<name>
<surname><![CDATA[Seijo]]></surname>
<given-names><![CDATA[JC]]></given-names>
</name>
<name>
<surname><![CDATA[Caddy]]></surname>
<given-names><![CDATA[JF]]></given-names>
</name>
<name>
<surname><![CDATA[Euán]]></surname>
<given-names><![CDATA[J]]></given-names>
</name>
</person-group>
<source><![CDATA[SPATIAL: space-time dynamics in marine fisheries]]></source>
<year>1994</year>
<page-range>116</page-range><publisher-loc><![CDATA[^eRome Rome]]></publisher-loc>
<publisher-name><![CDATA[FAO]]></publisher-name>
</nlm-citation>
</ref>
<ref id="B29">
<label>29</label><nlm-citation citation-type="book">
<person-group person-group-type="author">
<name>
<surname><![CDATA[Seijo]]></surname>
<given-names><![CDATA[JC]]></given-names>
</name>
<name>
<surname><![CDATA[Defeo]]></surname>
<given-names><![CDATA[O]]></given-names>
</name>
<name>
<surname><![CDATA[Salas]]></surname>
<given-names><![CDATA[S]]></given-names>
</name>
</person-group>
<source><![CDATA[]]></source>
<year>1997</year>
<page-range>176</page-range><publisher-loc><![CDATA[Rome ]]></publisher-loc>
<publisher-name><![CDATA[FAO]]></publisher-name>
</nlm-citation>
</ref>
<ref id="B30">
<label>30</label><nlm-citation citation-type="journal">
<person-group person-group-type="author">
<name>
<surname><![CDATA[Swain]]></surname>
<given-names><![CDATA[DP]]></given-names>
</name>
<name>
<surname><![CDATA[Poirier]]></surname>
<given-names><![CDATA[GA]]></given-names>
</name>
<name>
<surname><![CDATA[Sinclair]]></surname>
<given-names><![CDATA[AF]]></given-names>
</name>
</person-group>
<article-title xml:lang="en"><![CDATA[Effect of water temperature on catchability of Atlantic cod Gadus morhua) to the bottomtrawl survey in the southern Gulf of St Lawrence]]></article-title>
<source><![CDATA[ICES]]></source>
<year>2000</year>
<volume>J.Mar.Sci. 57</volume>
<page-range>56-68</page-range></nlm-citation>
</ref>
<ref id="B31">
<label>31</label><nlm-citation citation-type="journal">
<person-group person-group-type="author">
<name>
<surname><![CDATA[Ulltang]]></surname>
<given-names><![CDATA[Ø]]></given-names>
</name>
</person-group>
<article-title xml:lang="en"><![CDATA[Catch per unit of effort in the Norwegian purse seine fishery for Atlanto- Scandinavian herring]]></article-title>
<source><![CDATA[Fao]]></source>
<year>1976</year>
<volume>Fish.Tech.Pap. 155</volume>
<page-range>91-101</page-range></nlm-citation>
</ref>
<ref id="B32">
<label>32</label><nlm-citation citation-type="journal">
<person-group person-group-type="author">
<name>
<surname><![CDATA[Winters]]></surname>
<given-names><![CDATA[GH]]></given-names>
</name>
<name>
<surname><![CDATA[Wheeler]]></surname>
<given-names><![CDATA[JP]]></given-names>
</name>
</person-group>
<article-title xml:lang="en"><![CDATA[Interaction between stock area, stock abundance, and catchability coefficient]]></article-title>
<source><![CDATA[Can.J.Fish.Aquat.Sci.]]></source>
<year>1985</year>
<volume>42</volume>
<page-range>989-998</page-range></nlm-citation>
</ref>
<ref id="B33">
<label>33</label><nlm-citation citation-type="journal">
<person-group person-group-type="author">
<name>
<surname><![CDATA[Ye]]></surname>
<given-names><![CDATA[Y]]></given-names>
</name>
<name>
<surname><![CDATA[Mohammed]]></surname>
<given-names><![CDATA[H]]></given-names>
</name>
</person-group>
<article-title xml:lang="en"><![CDATA[An analysis of variation in catchability of green tiger prawn, Penaeus semisulcatus in waters off Kuwait]]></article-title>
<source><![CDATA[Fish.Bull.]]></source>
<year>1999</year>
<volume>97</volume>
<page-range>702-712</page-range></nlm-citation>
</ref>
<ref id="B34">
<label>34</label><nlm-citation citation-type="book">
<person-group person-group-type="author">
<name>
<surname><![CDATA[Zar]]></surname>
<given-names><![CDATA[J]]></given-names>
</name>
</person-group>
<source><![CDATA[Biostatistical Analysis.]]></source>
<year>1995</year>
<edition>3rd ed</edition>
<page-range>718 pp</page-range><publisher-loc><![CDATA[NJ ]]></publisher-loc>
<publisher-name><![CDATA[Prentice-Hall. Englewood Cliffs]]></publisher-name>
</nlm-citation>
</ref>
</ref-list>
</back>
</article>