<?xml version="1.0" encoding="ISO-8859-1"?><article xmlns:mml="http://www.w3.org/1998/Math/MathML" xmlns:xlink="http://www.w3.org/1999/xlink" xmlns:xsi="http://www.w3.org/2001/XMLSchema-instance">
<front>
<journal-meta>
<journal-id>0004-0622</journal-id>
<journal-title><![CDATA[Archivos Latinoamericanos de Nutrición]]></journal-title>
<abbrev-journal-title><![CDATA[ALAN]]></abbrev-journal-title>
<issn>0004-0622</issn>
<publisher>
<publisher-name><![CDATA[Sociedad Latinoamericana de Nutrición]]></publisher-name>
</publisher>
</journal-meta>
<article-meta>
<article-id>S0004-06222015000300006</article-id>
<title-group>
<article-title xml:lang="en"><![CDATA[Percentile distribution for anthropometric variables used to estimate body composition in pregnant women]]></article-title>
</title-group>
<contrib-group>
<contrib contrib-type="author">
<name>
<surname><![CDATA[Rached-Sosa]]></surname>
<given-names><![CDATA[Ingrid]]></given-names>
</name>
<xref ref-type="aff" rid="A01"/>
</contrib>
<contrib contrib-type="author">
<name>
<surname><![CDATA[Henríquez-Pérez]]></surname>
<given-names><![CDATA[Gladys]]></given-names>
</name>
<xref ref-type="aff" rid="A01"/>
</contrib>
</contrib-group>
<aff id="A01">
<institution><![CDATA[,CANIA Centro de Atención Nutricional Infantil Antímano ]]></institution>
<addr-line><![CDATA[Caracas ]]></addr-line>
<country>Venezuela</country>
</aff>
<pub-date pub-type="pub">
<day>00</day>
<month>09</month>
<year>2015</year>
</pub-date>
<pub-date pub-type="epub">
<day>00</day>
<month>09</month>
<year>2015</year>
</pub-date>
<volume>65</volume>
<numero>3</numero>
<fpage>173</fpage>
<lpage>180</lpage>
<copyright-statement/>
<copyright-year/>
<self-uri xlink:href="http://ve.scielo.org/scielo.php?script=sci_arttext&amp;pid=S0004-06222015000300006&amp;lng=en&amp;nrm=iso"></self-uri><self-uri xlink:href="http://ve.scielo.org/scielo.php?script=sci_abstract&amp;pid=S0004-06222015000300006&amp;lng=en&amp;nrm=iso"></self-uri><self-uri xlink:href="http://ve.scielo.org/scielo.php?script=sci_pdf&amp;pid=S0004-06222015000300006&amp;lng=en&amp;nrm=iso"></self-uri><abstract abstract-type="short" xml:lang="en"><p><![CDATA[Anthropometric indicators of body composition, reflective of fat and lean compartments in pregnant women, undergo changes throughout gestation. The adequate interpretation of these indicators requires the availability of percentile distribution values for each week of gestational age. The objective was to determine the percentile distribution for subcutaneous skin-fold thicknesses: biceps, triceps, subscapular, mid-thigh, and both arm fat and arm muscle areas for each week of gestational age. This descriptive and cross-sectional study included 4,481 measurements of anthropometric variables obtained from 745 pregnancies out of 719 subjects aged between 19 and 39 years, well-nourished, healthy, without clinical edema, single pregnancy, and validated gestational age. Evaluations were conducted at the Centro de Atención Nutricional Infantil Antímano, between 1998 and 2012. The anthropometric measurements were performed by standardized anthropometrists. Descriptive statistics, bivariant correlations, and percentiles 3, 10, 25, 50, 75, 90, and 97 were calculated for each week of pregnancy between weeks 8 thru 37. The number of measurements performed for each variable studied at each week of gestation ranged between 100 and 236. The behavior of the variables reflecting the fat component showed increases as the gestational age advanced (1.86 cm2), whereas the muscle area showed decreases (-0.02 cm2). The most noticeable variations were seen in the subscapular and mid-thigh skin-fold thicknesses 2.90 mm and 5.0 mm, respectively. The availability of percentile distributions of the anthropometric variables used in the evaluation of body composition for pregnant women per gestational age, contributes to optimizing the nutritional categorization in this population group.]]></p></abstract>
<abstract abstract-type="short" xml:lang="es"><p><![CDATA[Distribución percentilar de variables antropométricas aplicadas en la estimación de la composición corporal en gestantes adultas. Los indicadores antropométricos de composición corporal que reflejan los compartimientos corporales magro y graso de la gestante se modifican a lo largo de la gestación. Para una interpretación adecuada de los mismos se requeriria disponer de sus valores para cada edad gestacional. El objetivo de la investigación fue determinar la distribución percentilar de los pliegues subcutáneos: bicipital, tricipital, subescapular y muslo, así como las áreas: grasa y muscular en cada semana de gestacion. Estudio descriptivo, de corte transversal, incluyó 4.481 mediciones de las variables antropométricas obtenidas de 745 embarazos, provenientes de 719 mujeres entre 19 y 39 años de edad, sanas, eutróficas, sin edema, con embarazo simple y edad gestacional validada, evaluadas en el Centro de Atención Nutricional Infantil Antímano, entre 1998 y 2012. Las mediciones antropométricas fueron realizadas por antropometristas estandarizadas. Se calcularon descriptivos, correlaciones bivariantes y percentiles 3, 10, 25, 50, 75, 90 y 97 para cada edad gestacional, entre las 8 y 37 semanas de gestación. El número de mediciones para cada variable estudiada en cada edad gestacional varió entre 100 y 236. El comportamiento de las variables que reflejan el componente graso demostró incrementos a medida que aumenta la edad gestacional (1,86 cm2), mientras que el área muscular manifestó decrementos (-0,02 cm2). Los mayores cambios se observaron en los pliegues subescapular 2,90 mm y muslo 5,00 mm. La distribución percentilar de para cada semana de gestación de las variables antropométricas que miden la composición corporal, constituye un aporte a la optimización de la categorización nutricional en este grupo de población.]]></p></abstract>
<kwd-group>
<kwd lng="en"><![CDATA[Percentile distribution]]></kwd>
<kwd lng="en"><![CDATA[Pregnancy]]></kwd>
<kwd lng="en"><![CDATA[Anthropometry]]></kwd>
<kwd lng="en"><![CDATA[Body composition]]></kwd>
<kwd lng="en"><![CDATA[Nutritional assessment]]></kwd>
<kwd lng="es"><![CDATA[Distribución percentilar]]></kwd>
<kwd lng="es"><![CDATA[Embarazo]]></kwd>
<kwd lng="es"><![CDATA[Antropometría]]></kwd>
<kwd lng="es"><![CDATA[Composición corporal]]></kwd>
<kwd lng="es"><![CDATA[Evaluación nutricional]]></kwd>
</kwd-group>
</article-meta>
</front><body><![CDATA[   <b>     <p ALIGN="center" style="word-spacing: 0; line-height: 100%">  <font face="Verdana" size="3" COLOR="#191919">Percentile distribution for anthropometric variables used</font> </b><font size="3" face="Verdana"> </font><b> <font face="Verdana" size="2" COLOR="#191919">to estimate body composition in pregnant women</font></p> </b><i>     <p ALIGN="center" style="word-spacing: 0; line-height: 100%"><font face="Verdana" size="2" COLOR="#191919"> <b>Ingrid Rached-Sosa, Gladys Henríquez-Pérez</b> </font></p> </i>     <p ALIGN="center" style="word-spacing: 0; line-height: 100%"><font face="Verdana" size="2">Centro de Atención Nutricional Infantil Antímano (CANIA). Caracas, Venezuela.</font></p>     <p ALIGN="justify" style="word-spacing: 0; line-height: 100%"><b><font face="Verdana" size="2">SUMMARY.</font></b></p>     <p ALIGN="justify" style="word-spacing: 0; line-height: 100%"><font face="Verdana" size="2">Anthropometric indicators of body composition, reflective of fat and lean compartments in pregnant women, undergo changes throughout gestation. The adequate interpretation of these indicators requires the availability of percentile distribution values for each week of gestational age. The objective was to determine the percentile distribution for subcutaneous skin-fold thicknesses: biceps, triceps, subscapular, mid-thigh, and both arm fat and arm muscle areas for each week of gestational age. This descriptive and cross-sectional study included 4,481 measurements of anthropometric variables obtained from 745 pregnancies out of 719 subjects aged between 19 and 39 years, well-nourished, healthy, without clinical edema, single pregnancy, and validated gestational age. Evaluations were conducted at the Centro de Atención Nutricional Infantil Antímano, between 1998 and 2012. The anthropometric measurements were performed by standardized anthropometrists. Descriptive statistics, bivariant correlations, and percentiles 3, 10, 25, 50, 75, 90, and 97 were calculated for each week of pregnancy between weeks 8 thru 37. The number of measurements performed for each variable studied at each week of gestation ranged between 100 and 236. The behavior of the variables reflecting the fat component showed increases as the gestational age advanced (1.86 cm2), whereas the muscle area showed decreases (-0.02 cm2). The most noticeable variations were seen in the subscapular and mid-thigh skin-fold thicknesses 2.90 mm and 5.0 mm, respectively. The availability of percentile distributions of the anthropometric variables used in the evaluation of body composition for pregnant women per gestational age, contributes to optimizing the nutritional categorization in this population group.</font></p>     <p ALIGN="center" style="word-spacing: 0; line-height: 100%"><font face="Verdana" size="2"><b>Key words:</b> Percentile distribution, Pregnancy, Anthropometry, Body composition, Nutritional assessment.</font></p>     <p ALIGN="justify" style="word-spacing: 0; line-height: 100%"><b><font face="Verdana" size="2">RESUMEN.</font></b></p>     <p ALIGN="justify" style="word-spacing: 0; line-height: 100%"><font face="Verdana" size="2">Distribución percentilar de variables antropométricas aplicadas en la estimación de la composición corporal en gestantes adultas. Los indicadores antropométricos de composición corporal que reflejan los compartimientos corporales magro y graso de la gestante se modifican a lo largo de la gestación. Para una interpretación adecuada de los mismos se requeriria disponer de sus valores para cada edad gestacional. El objetivo de la investigación fue determinar la distribución percentilar de los pliegues subcutáneos: bicipital, tricipital, subescapular y muslo, así como las áreas: grasa y muscular en cada semana de gestacion. Estudio descriptivo, de corte transversal, incluyó 4.481 mediciones de las variables antropométricas obtenidas de 745 embarazos, provenientes de 719 mujeres entre 19 y 39 años de edad, sanas, eutróficas, sin edema, con embarazo simple y edad gestacional validada, evaluadas en el Centro de Atención Nutricional Infantil Antímano, entre 1998 y 2012. Las mediciones antropométricas fueron realizadas por antropometristas estandarizadas. Se calcularon descriptivos, correlaciones bivariantes y percentiles 3, 10, 25, 50, 75, 90 y 97 para cada edad gestacional, entre las 8 y 37 semanas de gestación. El número de mediciones para cada variable estudiada en cada edad gestacional varió entre 100 y 236. El comportamiento de las variables que reflejan el componente graso demostró incrementos a medida que aumenta la edad gestacional (1,86 cm2), mientras que el área muscular manifestó decrementos (-0,02 cm2). Los mayores cambios se observaron en los pliegues subescapular 2,90 mm y muslo 5,00 mm. La distribución percentilar de para cada semana de gestación de las variables antropométricas que miden la composición corporal, constituye un aporte a la optimización de la categorización nutricional en este grupo de población.</font></p>     <p ALIGN="justify" style="word-spacing: 0; line-height: 100%"><font face="Verdana" size="2"><b>Palabras clave: </b>Distribución percentilar, Embarazo, Antropometría, Composición corporal, Evaluación nutricional</font></p>     ]]></body>
<body><![CDATA[<p ALIGN="justify" style="word-spacing: 0; line-height: 100%"><font face="Verdana" size="2">Recibido: 30-01-2015 Aceptado: 08-06-2015</font></p>     <p ALIGN="justify" style="word-spacing: 0; line-height: 100%"><b><font face="Verdana" size="2">INTRODUCTION</font></b></p>     <p ALIGN="justify" style="word-spacing: 0; line-height: 100%"><font face="Verdana" size="2">During pregnancy, there is an important anabolic state which determines the weight gain in a pregnant woman by approximately 20% with respect to the preconceptional weight, out of which only a little over one third corresponds to the fetus and the amniotic fluid (1).</font></p>     <p ALIGN="justify" style="word-spacing: 0; line-height: 100%"><font face="Verdana" size="2">Maternal nutrition and metabolism suffer changes throughout gestation in such a manner that early-stage pregnancy is characterized by the deposit of substances, mainly in the adipose tissue, which is explained by the hyperphagia present in these women, in addition to endocrine changes, leading to a net increase in maternal weight (2). It is important to note that body composition studies based on the multi-compartment model have not been able to separate the weight increases related to the fetus from those of the mother; however, weight increase estimations relative to fat weight and fat-free weight in pregnant women have improved in the three and four-compartment models (3). The technical difficulties deriving from the application of the methods used for the study of such compartments along the entire vital cycle have determined the inclusion of other procedures such as anthropometry and bioimpedance analyses in body composition studies (4,5); however, there are few published studies addressing this matter in pregnant women (4,5).</font></p>     <p ALIGN="justify" style="word-spacing: 0; line-height: 100%"><font face="Verdana" size="2">On the other hand, the good results from using percentile distribution values for anthropometric variables for the categorization of the nutritional status in other stages of life (6), together with the existing evidences of the deleterious effects of nutritional alterations in the mother, either in deficit or in excess, on the product of conception (4,5,7,8), and which are reflected in the changes in both fat and lean compartments of a pregnant woman throughout gestation, suggest the importance of having reference values for such compartments in this physiological condition.</font></p>     <p ALIGN="justify" style="word-spacing: 0; line-height: 100%"><font face="Verdana" size="2">The aforementioned and the lack of reference values of these variables and indicators in pregnant women form the basis of this investigation, which purpose is to determine the percentile distribution of subcutaneous skin-fold thickness at different sites, namely: Biceps (BS), triceps (TS), subscapular (SBS), midthigh (MTS), and at both arm fat (AFA) and arm muscle (AMA) areas in adult pregnant women for each week of gestational age in this population.</font></p> <b>     <p ALIGN="justify" style="word-spacing: 0; line-height: 100%"><font face="Verdana" size="2" COLOR="#191919"> MATERIALS AND METHODS </font></p> <i>     <p ALIGN="justify" style="word-spacing: 0; line-height: 100%"><font face="Verdana" size="2" COLOR="#191919"> Participants DESIGN </font></p> </i></b>     <p ALIGN="justify" style="word-spacing: 0; line-height: 100%"><font face="Verdana" size="2">This descriptive and cross-sectional study, with a field-based design, included measurements of BS (4,217), TS (4,481), SBS (4,469), and MTS (4,261) skinfold thicknesses obtained from 745 pregnancies out of 719 subjects aged between 19 and 39 years, and evaluated at the “Nutritional Care for Pregnant Women” unit of the Centro de Atención Nutricional Infantil Antímano (CANIA), between October 1998 and July 2012.</font></p>     <p ALIGN="justify" style="word-spacing: 0; line-height: 100%"><font face="Verdana" size="2">The inclusion criteria were: well-nourished and healthy pregnant women, with single pregnancy, and gestational age at admission to the study of „T13 weeks, according to the last menstrual period (LMP). The gestational age was calculated using the Battaglia clinical method. The gestational age was validated by obstetrical ultrasound, where the difference between both gestational age estimation methods could not exceed 2 weeks.</font></p>     ]]></body>
<body><![CDATA[<p ALIGN="justify" style="word-spacing: 0; line-height: 100%"><font face="Verdana" size="2">The exclusion criteria were: a difference of more than 2 weeks in the calculation of the gestational age, and change of the nutritional diagnosis (well-nourished) in any moment after inclusion of the patient in the study. The clinical edema was controlled during the entire study. It’s important to know that anthropometric measurements during the first two trimesters of pregnant women that showed clinical edema in the third trimester and change of the nutritional diagnosis were maintained in the study.</font></p>     <p ALIGN="justify" style="word-spacing: 0; line-height: 100%"><font face="Verdana" size="2">The nutritional classification of the subjects was made by applying the integral nutritional diagnosis based on clinical, anthropometric, dietary, and biochemical indicators, as previously established (9).</font></p>     <p ALIGN="justify" style="word-spacing: 0; line-height: 100%"><font face="Verdana" size="2">All of the required variables established in the protocol of the study were taken during the screening visit; dietary, clinical and anthropometric variables were registered in the following fortnight endpoints. The biochemical variables were only required according to the standards and procedures established for this if necessary.</font></p>     <p ALIGN="justify" style="word-spacing: 0; line-height: 100%"><font face="Verdana" size="2">With regard to the anthropometric indicators used in the nutritional classification, it should be noted that, for the interpretation of the body mass index (BMI), Frisancho´s classification criteria (6) were used in the first trimester due to the fact that they showed the best results for sensitivity and specificity in the diagnosis of the nutritional status in malnourished pregnant women by deficit and excess in previous studies of the same population (10). In the following trimesters, Atalah ´s reference values were used as these were the only ones available for the follow-up of this indicator (11). The study was approved by the Human Research Ethics Committee of CANIA.</font></p>     <p ALIGN="justify" style="word-spacing: 0; line-height: 100%"><b><i><font face="Verdana" size="2" COLOR="#191919">Anthropometric data collection</font></i></b></p>     <p ALIGN="justify" style="word-spacing: 0; line-height: 100%"><font face="Verdana" size="2">On average, 6 anthropometric measurements were performed for each subject, with values of minimum 1 and maximum 15. The number of measurements obtained for each studied variable ranged from a minimum of 100 to a maximum of 239 for each week of gestation, meeting the quality criterion set by Jelliffe &amp; Jelliffe in preparing reference values for these studies, which is a minimum of 100 measurements (12). These measurements were performed during the first study visit and subsequently every 15 days until pregnancy week 39; however, the percentile distribution for each variable was performed until pregnancy week 37 as the minimum required number of measurements was not available from that week on; however, this result did not affect the applicability of the percentile distribution for body composition anthropometric indicators in daily clinical practice.</font></p>     <p ALIGN="justify" style="word-spacing: 0; line-height: 100%"><font face="Verdana" size="2">The analyzed variables were the subcutaneous skinfold thicknesses at the following sites: BS, TS, SBS, MTS, and arm fat and arm muscle areas. The anthropometric measurements were conducted by anthropometric measurement technicians, previously trained and standardized every three months, as recommended by the International Biological Program (13).</font></p>     <p ALIGN="justify" style="word-spacing: 0; line-height: 100%"><font face="Verdana" size="2">The mean intraobserver measurement error (mm) for each variable was: 0.413 BS, 0.305 TS, 0.384 SBS, and 0.523 118 MTS. The mean interobserver measurement error (mm) values were: 0.157 and 0.186 for TS and SBS, respectively.</font></p>     <p ALIGN="justify" style="word-spacing: 0; line-height: 100%"><font face="Verdana" size="2">A Holtain LTD® caliper (precision: 0.2 mm) was used for the skinfold measurements, exerting a constant pressure of 10 g/mm2, and a Nasco® measuring tape (precision: 0.1 cm) was used to measure the mid-arm circumference (MAC) in centimeters. The latter was used to estimate both the AFA and AMA areas, using the following equations:</font></p>     <p ALIGN="center" style="word-spacing: 0; line-height: 100%"><img border="0" src="/img/fbpe/alan/v65n3/art06form1.gif" width="402" height="118"></p>     
]]></body>
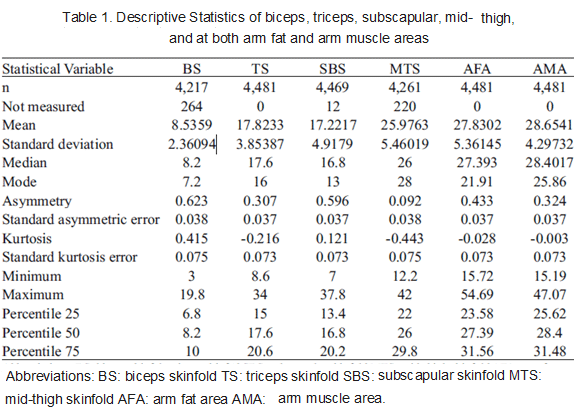
<body><![CDATA[<p ALIGN="justify" style="word-spacing: 0; line-height: 100%"><font face="Verdana" size="2">In women aged <span style="mso-bidi-font-family:Calibri;mso-bidi-theme-font: minor-latin">&#8805;</span><o:p> </o:p>  19 years, 6.5 cm2 (bone area) are subtracted from the estimated value (14).</font></p>     <p ALIGN="justify" style="word-spacing: 0; line-height: 100%"><b><i><font face="Verdana" size="2" COLOR="#191919">Statistical analysis</font></i></b></p>     <p ALIGN="justify" style="word-spacing: 0; line-height: 100%"><font face="Verdana" size="2">For the statistical analysis, the following descriptive statistics were obtained: mean, standard deviation, median, moden, asymmetry, standard asymmetric errors, kurtosis, standard kurtosis errors, and the maximum and minimum values. These were applied to all the studied variables.</font></p>     <p ALIGN="justify" style="word-spacing: 0; line-height: 100%"><font face="Verdana" size="2">Mean equality was evaluated using the Kolmogorov- Smirnov test, and the equality of variances was tested using the Levene test. Both tests were applied in all of the studied variables.</font></p>     <p ALIGN="justify" style="word-spacing: 0; line-height: 100%"><font face="Verdana" size="2">T-test and Mann-Whitney test were used to study the significance of differences between the means and the distributions, respectively for the analyzed variables. The established level of significance was 0.05.</font></p>     <p ALIGN="justify" style="word-spacing: 0; line-height: 100%"><font face="Verdana" size="2">In order to establish a linear relationship between all the studied anthropometric variables used to estimate body composition, bivariate correlations were calculated using the following values for their interpretation: weak correlation (. 0.49), medium correlation (0.50 . 0.74), strong correlation (0.75 . 0.89), and very strong correlation . 0.9.</font></p>     <p ALIGN="justify" style="word-spacing: 0; line-height: 100%"><font face="Verdana" size="2">Likewise, for each studied variable, percentiles 3, 10, 25, 50, 75, 90, and 97 were calculated for each gestational age week between weeks 8 and 37. The data presented for all of the analyzed percentiles in each week of pregnancy are the original. Data processing was carried out with the SPSS program (Version 19.0).</font></p>     <p ALIGN="justify" style="word-spacing: 0; line-height: 100%"><b><font face="Verdana" size="2">RESULTS</font></b></p>     <p ALIGN="justify" style="word-spacing: 0; line-height: 100%"><font face="Verdana" size="2">The distribution of the pregnant women by age shows a higher concentration of women aged between 19 and 23 years, which represent 49.5 % of the study group. This is due to the demographic characteristics of the population attending consultation (CANIA 2013).</font></p>      <p ALIGN="justify" style="word-spacing: 0; line-height: 100%"><font face="Verdana" size="2">The descriptive statistics for all of the analyzed variables: BS, TS, SBS and MTS skin-fold thicknesses, and at both AFA and AMA are shown in<a href="#tab1"> Table 1</a>.</font></p>     ]]></body>
<body><![CDATA[<p ALIGN="center" style="word-spacing: 0; line-height: 100%"><a name="tab1"><img border="0" src="/img/fbpe/alan/v65n3/art06tab1.gif" width="578" height="415"></a></p>     
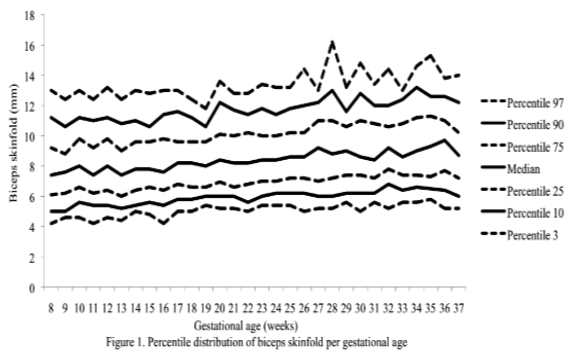
<p ALIGN="justify" style="word-spacing: 0; line-height: 100%"><font face="Verdana" size="2">The Kolmogorov-Smirnov test values evidence a normal distribution of the data. The coefficient of variation shows a dispersion proportion of the distribution with respect to the mean difference for each variable, with a smaller proportion for the AMA (15.13 %) and higher proportions for the SBS (29.27 %) and BS (28.79 %).</font></p>     <p ALIGN="justify" style="word-spacing: 0; line-height: 100%"><font face="Verdana" size="2">The correlation analysis showed a very strong correlation only between the TS and the AFA; a mean correlation between the TS and the remaining analyzed variables; and the same for the BS, SBS, and MTS with all of the variables, except for the AMA.</font></p>     <p ALIGN="justify" style="word-spacing: 0; line-height: 100%"><font face="Verdana" size="2">The percentiles for the distribution of the analyzed variables are presented in Figures 1 through 6. It is important to point out that statistical smoothing was not applied to the data presented per gestational age. </font></p>     <p ALIGN="justify" style="word-spacing: 0; line-height: 100%"><font face="Verdana" size="2">With respect to the behavior of the variables, the following was found:</font></p>     <blockquote>       <p ALIGN="justify" style="word-spacing: 0; line-height: 100%"><font face="Verdana" size="2">-   The BS values show slight increases and decreases from week 8 to week 13,   remaining stable after this period until week 17, from which a discretely   gradual increase is evidenced, and finally dropping at week 37 (<a href="#fig1">Figure   1</a>).</font></p> </blockquote>       <p ALIGN="center" style="word-spacing: 0; line-height: 100%"><a name="fig1"><img border="0" src="/img/fbpe/alan/v65n3/art06fig1.gif" width="580" height="358"></a></p>     
<blockquote>       <p ALIGN="justify" style="word-spacing: 0; line-height: 100%"><font face="Verdana" size="2">-   The TS data shows small decreases and increases throughout the analyzed weeks,   with the lowest values at week 9 and from week 11 throught 14, and again at   week 21 (<a href="#fig2">Figure 2</a>).</font></p> </blockquote>       ]]></body>
<body><![CDATA[<p ALIGN="center" style="word-spacing: 0; line-height: 100%"><a name="fig2"><img border="0" src="/img/fbpe/alan/v65n3/art06fig2.gif" width="563" height="328"></a></p>     
<blockquote>       <p ALIGN="justify" style="word-spacing: 0; line-height: 100%"><font face="Verdana" size="2">-   The SBS variable shows higher values from week 14 (<a href="#fig3">Figure 3</a>). The values shown   on these last two skinfolds decrease from week 36.</font></p> </blockquote>       <p ALIGN="center" style="word-spacing: 0; line-height: 100%"><a name="fig3"><img border="0" src="/img/fbpe/alan/v65n3/art06fig3.gif" width="548" height="355"></a></p>     
<blockquote>       <p ALIGN="justify" style="word-spacing: 0; line-height: 100%"><font face="Verdana" size="2">-   The MTS shows steady values until week 13, subsequently showing a sustained   increase until week 35, also decreasing after this week (<a href="#fig4">Figure   4</a>).</font></p> </blockquote>       <p ALIGN="center" style="word-spacing: 0; line-height: 100%"><a name="fig4"><img border="0" src="/img/fbpe/alan/v65n3/art06fig4.gif" width="563" height="327"></a></p>     
<blockquote>       <p ALIGN="justify" style="word-spacing: 0; line-height: 100%"><font face="Verdana" size="2">-   In general, apart from the weekly variations, it appears that the skinfold   values tend to increase until weeks 27 to 29 of gestation, maintaining at this   point the highest values for the entire term until week 37 for the BS, until   week 36 for the TS and SBS, and until week 35 for the MTS, and after these   weeks, the values for each skinfold decrease.</font></p>       <p ALIGN="justify" style="word-spacing: 0; line-height: 100%"><font face="Verdana" size="2">-   The behavior of the AFA indicator remains stable until week 25, dropping only   twice at weeks 17 and 20. A considerable increase is registered at week 27,   when its values are maintained above those registered before this week (<a href="#fig5">Figure   5</a>).</font></p> </blockquote>     ]]></body>
<body><![CDATA[<p ALIGN="center" style="word-spacing: 0; line-height: 100%"><a name="fig5"><img border="0" src="/img/fbpe/alan/v65n3/art06fig5.gif" width="565" height="301"></a></p>     
<blockquote>       <p ALIGN="justify" style="word-spacing: 0; line-height: 100%"><font face="Verdana" size="2">-   The AMA indicator shows steady values until week 28, thereafter presenting   slight increases and decreases until the end of gestation (<a href="#fig6">Figure   6</a>).</font></p> </blockquote>       <p ALIGN="center" style="word-spacing: 0; line-height: 100%"><a name="fig6"><img border="0" src="/img/fbpe/alan/v65n3/art06fig6.gif" width="541" height="315"></a></p>     
<p ALIGN="justify" style="word-spacing: 0; line-height: 100%"><font face="Verdana" size="2">The changes in variables from weeks 8 thru 37, referred to in the 50th percentile, were as follows: skin-folds (mm): biceps 1.30, triceps 1.40, subscapular 2.90, and thigh 5.00; and areas (cm2): fat 1.86 and muscle -0.02.</font></p>     <p ALIGN="justify" style="word-spacing: 0; line-height: 100%"><font face="Verdana" size="2">Anthropometric variables such as BS, TS, SBS, MTS, and AMA showed statistically significant variations during two consecutive weeks of gestational age as follows: BS during weeks 9-10, 12-13, and 19-20; TS only during weeks 21-22; SBS during weeks 21- 22, 27-28, and 28-29; MTS during weeks 27-28, 29- 30, and 34-35; and AMA during weeks 29-30, 32-33 and 34-35.</font></p>     <p ALIGN="justify" style="word-spacing: 0; line-height: 100%"><b><font face="Verdana" size="2">DISCUSSION</font></b></p>     <p ALIGN="justify" style="word-spacing: 0; line-height: 100%"><font face="Verdana" size="2">The progressive increase of all of the skin-fold thicknesses analyzed until week 36 ± 1, agrees with the pattern reported in other studies conducted in adult healthy pregnant women from various urban zones Villar et al. (5) in Guatemala, López et al. (15) in Argentina, as well as the Institute of Medicine of the United States (16), suggesting that the changes in the fat deposits throughout pregnancy have a characteristic biological pattern.</font></p>     <p ALIGN="justify" style="word-spacing: 0; line-height: 100%"><font face="Verdana" size="2">Notably, the overall increase of the triceps skinfold, which was statistically significant in this study group, was higher than those reported by Villar et al. (5) and by Forsum et al. (17) in Swedish pregnant women. Both studies consisted of adult, healthy women.</font></p>     <p ALIGN="justify" style="word-spacing: 0; line-height: 100%"><font face="Verdana" size="2">It has been demonstrated that the reduction of subcutaneous skin-fold thickness at the end of pregnancy is the result of the mobilization of the fat stored in the first and second trimesters to be used by the fetus in the third trimester, which is the period of maximum growth (17).</font></p>     ]]></body>
<body><![CDATA[<p ALIGN="justify" style="word-spacing: 0; line-height: 100%"><font face="Verdana" size="2">Additionally, in a study conducted in Indonesia in women of low socioeconomic status, with a caloric intake of 70 % of the RDA during the first trimester and 80 % during the second and third trimesters, the triceps skin-folds showed small inter-weekly variations as to increases or decreases, but did not change completely throughout pregnancy (18), and the same was demonstrated in a study conducted in India (19). The results reported in both publications may be attributed to a caloric intake too poor to cover the increased calorie requirements during pregnancy. This emphasizes the importance of an adequate nutritional status and caloric intake in pregnant women, particularly because of the above mentioned use of the fat stores by the fetus for its growth and development.</font></p>     <p ALIGN="justify" style="word-spacing: 0; line-height: 100%"><font face="Verdana" size="2">The overall increase in skin-fold thickness, which is statistically significant and characteristic in healthy pregnant women when the intake of macronutrients is adequate (20), was below that reported in other studies (5,15,17).</font></p>     <p ALIGN="justify" style="word-spacing: 0; line-height: 100%"><font face="Verdana" size="2">The highest subcutaneous fat build-up at the thigh was in agreement with the findings of Taggart et al. (21), Forsum et al.(17), and by Stuebe et al. (22), who reported that during pregnancy, the fat storage is seen mainly in this area. Likewise, some investigators have determined that the fat storage in this area during pregnancy represents an important source of energy to be used later during lactation (23,24). This is corroborated by the characteristic metabolic activity of fat cells in the femoral region during gestation, which show an increase in the lipoprotein lipase activity, accompanied by a decrease in lipolysis, which leads to the accumulation of triglycerides in the fat stores of this region, thus originating larger fat cells. This characteristic pattern during pregnancy changes during lactation (23).</font></p>     <p ALIGN="justify" style="word-spacing: 0; line-height: 100%"><font face="Verdana" size="2">Finally, the mean changes and the significant increase in the arm fat area in the 50th percentile were expected due to the fact that these variables, when calculated, involve the triceps skin-fold. As mentioned previously, these changes are physiological as it has been demonstrated that the fat stored during the first two trimesters of gestation is intended to prepare a pregnant woman for the high energy demand in her last trimester of pregnancy and subsequently for lactation (21).</font></p>     <p ALIGN="justify" style="word-spacing: 0; line-height: 100%"><font face="Verdana" size="2">Even though this study group underwent controls to prevent pregnancy edema, it is thought that the changes in subcutaneous tissue intravascular and extravascular water can also play a role in these changes, as has been reported by other investigators (17,25), based on the rapid loss of one third of the increase in subcutaneous skin-fold thickness during pregnancy, occurring immediately after the birth (16,26). Also, it is important to note that the changes in subcutaneous tissue during the gestation period, resulting from a state of hydration, could overestimate actual fat deposits during this period of life (17).</font></p>     <p ALIGN="justify" style="word-spacing: 0; line-height: 100%"><font face="Verdana" size="2">The significance of changes in subcutaneous skinfold thickness, particularly during the weeks of the third trimester of gestation, analyzed within the context of typical metabolic changes during pregnancy, could be interpreted as an increase in fat reserves in the bodies of these women; however, in pregnant women, this interpretation of changes in subcutaneous skin-fold</font></p>     <p ALIGN="justify" style="word-spacing: 0; line-height: 100%"><font face="Verdana" size="2">thickness reflecting the body fat reserves, and consequently the nutritional status, becomes complicated due to the presence of other factors such as the redistribution of existing fat stores from central to peripheral zones in order to make room for the fetus in the abdominal cavity and to store the additional fat required during pregnancy and subsequently during lactation (16,22,27).</font></p>     <p ALIGN="justify" style="word-spacing: 0; line-height: 100%"><font face="Verdana" size="2">In addition, even though the presence of clinical edema is controlled as was done in this study, the existence of growing concentrations of estrogen promote changes in the water retention capacity of subcutaneous tissues, enabling the existence of subclinical edema. On the other hand, such edema may increase the subcutaneous tissue resistance to compression, resulting in the enhanced thickness of skin-folds, which does not correspond to subcutaneous fat increases (27).</font></p>     <p ALIGN="justify" style="word-spacing: 0; line-height: 100%"><font face="Verdana" size="2">With respect to the lean component, it is thought that the non-significant decrease in fat mass throughout gestation could be a consequence of the decrease of intracellular water contained in the muscle during pregnancy (25).</font></p>     <p ALIGN="justify" style="word-spacing: 0; line-height: 100%"><font face="Verdana" size="2">There are no published studies addressing this matter to allow for an external validation of these results. However, it is worth noting that this study meets the established requirements for obtaining reference anthropometric values (28) as follows: </font></p>     ]]></body>
<body><![CDATA[<p ALIGN="justify" style="word-spacing: 0; line-height: 100%"><font face="Verdana" size="2">The sample is adequate. It includes the minimum required data for this type of study. This is seen across the analyzed variables and is exceeded in most of them. Additionally, all studied women are healthy and wellnourished. </font></p>     <blockquote>       <p ALIGN="justify" style="word-spacing: 0; line-height: 100%"><font face="Verdana" size="2">•   The methodology is well described and ensures its reproducibility.</font></p>       <p ALIGN="justify" style="word-spacing: 0; line-height: 100%"><font face="Verdana" size="2">•   Errors regarding instruments (precision) and measurement techniques (bias)   have been controlled by calibrating the measuring instruments on the one hand,   and on the other hand by regularly standardizing the anthropometrists who   performed the measurements.</font></p> </blockquote>     <p ALIGN="justify" style="word-spacing: 0; line-height: 100%"><font face="Verdana" size="2">The gap in the existing knowledge about this particular topic and the limitations of accurate methods for body composition measurements in pregnant women justify this type of studies.</font></p>     <p ALIGN="justify" style="word-spacing: 0; line-height: 100%"><b><font face="Verdana" size="2">CONCLUSION</font></b></p>     <p ALIGN="justify" style="word-spacing: 0; line-height: 100%"><font face="Verdana" size="2">Even though the effectiveness (sensitivity and specificity) of the presented values has not been evaluated, the availability of percentile distributions of the anthropometric variables used in the evaluation of body composition for pregnant women per gestational age, contributes to optimizing the nutritional categorization in this population group.</font></p>     <p ALIGN="justify" style="word-spacing: 0; line-height: 100%"><font face="Verdana" size="2">This paper was sponsored by Empresas POLAR.</font></p>     <p ALIGN="justify" style="word-spacing: 0; line-height: 100%"><b><font face="Verdana" size="2">REFERENCES</font></b></p>     <p ALIGN="justify" style="word-spacing: 0; line-height: 100%"><font face="Verdana" size="2">1. Forbes GB. Human body composition growth: aging nutrition and activity. Human Kinetics: Champaign, 1987.</font></p>     ]]></body>
<body><![CDATA[<!-- ref --><p ALIGN="justify" style="word-spacing: 0; line-height: 100%"><font face="Verdana" size="2">2. Cetin I, Alvino G, Radaelli T, Pardi G. Fetal nutrition: a review. Act Pædiatr 2005;94(Suppl 449):7–13.</font>&nbsp;&nbsp;&nbsp;&nbsp;&nbsp;&nbsp;&nbsp;&nbsp;[&#160;<a href="javascript:void(0);" onclick="javascript: window.open('/scielo.php?script=sci_nlinks&ref=530719&pid=S0004-0622201500030000600002&lng=','','width=640,height=500,resizable=yes,scrollbars=1,menubar=yes,');">Links</a>&#160;]<!-- end-ref --><!-- ref --><p ALIGN="justify" style="word-spacing: 0; line-height: 100%"><font face="Verdana" size="2">3. Heophinson JM, Butte NF, Ellis KL, Wong WW, Puyan MR, O’Brian SE. Body fat estimation in late pregnancy and early postpartum: comparison of two-, there-, and four- component models. Am J Clin Nutr 1997;65:432- 438.</font>&nbsp;&nbsp;&nbsp;&nbsp;&nbsp;&nbsp;&nbsp;&nbsp;[&#160;<a href="javascript:void(0);" onclick="javascript: window.open('/scielo.php?script=sci_nlinks&ref=530720&pid=S0004-0622201500030000600003&lng=','','width=640,height=500,resizable=yes,scrollbars=1,menubar=yes,');">Links</a>&#160;]<!-- end-ref --><!-- ref --><p ALIGN="justify" style="word-spacing: 0; line-height: 100%"><font face="Verdana" size="2">4. Widem EM, Gallagher D. Body composition changes in pregnancy: measurement predictors and outcomes. Eur J Clin Nutr 2014;68(6): 643–652. doi:10.1038/ejcn.2014.40.</font>&nbsp;&nbsp;&nbsp;&nbsp;&nbsp;&nbsp;&nbsp;&nbsp;[&#160;<a href="javascript:void(0);" onclick="javascript: window.open('/scielo.php?script=sci_nlinks&ref=530721&pid=S0004-0622201500030000600004&lng=','','width=640,height=500,resizable=yes,scrollbars=1,menubar=yes,');">Links</a>&#160;]<!-- end-ref --><!-- ref --><p ALIGN="justify" style="word-spacing: 0; line-height: 100%"><font face="Verdana" size="2">5. Villar J, Cogswell M, Kestler E, Castillo P, Menendez R, Repke J. Effect of fat and fat-free mass deposition during pregnancy on birth weight. Am J Obstet Gynecol 1992;167(5):1344-1352.</font>&nbsp;&nbsp;&nbsp;&nbsp;&nbsp;&nbsp;&nbsp;&nbsp;[&#160;<a href="javascript:void(0);" onclick="javascript: window.open('/scielo.php?script=sci_nlinks&ref=530722&pid=S0004-0622201500030000600005&lng=','','width=640,height=500,resizable=yes,scrollbars=1,menubar=yes,');">Links</a>&#160;]<!-- end-ref --><!-- ref --><p ALIGN="justify" style="word-spacing: 0; line-height: 100%"><font face="Verdana" size="2">6. Frisancho AR, editor. Anthropometric standards for the assessment of growth and nutritional status. Washington, D.C.: The University of Michigan Press; 1993. p.168.</font>&nbsp;&nbsp;&nbsp;&nbsp;&nbsp;&nbsp;&nbsp;&nbsp;[&#160;<a href="javascript:void(0);" onclick="javascript: window.open('/scielo.php?script=sci_nlinks&ref=530723&pid=S0004-0622201500030000600006&lng=','','width=640,height=500,resizable=yes,scrollbars=1,menubar=yes,');">Links</a>&#160;]<!-- end-ref --><!-- ref --><p ALIGN="justify" style="word-spacing: 0; line-height: 100%"><font face="Verdana" size="2">7. McMillen IC, MacLaughlin SM, Muhlhausler BS, Gentili S, Duffield JL, Morrisor JL. Developmental origins of adult health and disease: the role of periconceptional and fetal nutrition. Basic Clin Pharmacol Toxicol 2008;102:82-89.</font>&nbsp;&nbsp;&nbsp;&nbsp;&nbsp;&nbsp;&nbsp;&nbsp;[&#160;<a href="javascript:void(0);" onclick="javascript: window.open('/scielo.php?script=sci_nlinks&ref=530724&pid=S0004-0622201500030000600007&lng=','','width=640,height=500,resizable=yes,scrollbars=1,menubar=yes,');">Links</a>&#160;]<!-- end-ref --><!-- ref --><p ALIGN="justify" style="word-spacing: 0; line-height: 100%"><font face="Verdana" size="2">8. Gabory A, Attig L, Junien C. Developmental programming and epigenetics. Am J Clin Nutr 2011;94(6 Suppl):1943S-952S.</font>&nbsp;&nbsp;&nbsp;&nbsp;&nbsp;&nbsp;&nbsp;&nbsp;[&#160;<a href="javascript:void(0);" onclick="javascript: window.open('/scielo.php?script=sci_nlinks&ref=530725&pid=S0004-0622201500030000600008&lng=','','width=640,height=500,resizable=yes,scrollbars=1,menubar=yes,');">Links</a>&#160;]<!-- end-ref --><!-- ref --><p ALIGN="justify" style="word-spacing: 0; line-height: 100%"><font face="Verdana" size="2">9. Rached I, Azuaje A, Henríquez G. Estado nutricional en gestantes de una comunidad menos privilegiada de Caracas. An Venez Nutr 2002;15(2):94-104. </font>&nbsp;&nbsp;&nbsp;&nbsp;&nbsp;&nbsp;&nbsp;&nbsp;[&#160;<a href="javascript:void(0);" onclick="javascript: window.open('/scielo.php?script=sci_nlinks&ref=530726&pid=S0004-0622201500030000600009&lng=','','width=640,height=500,resizable=yes,scrollbars=1,menubar=yes,');">Links</a>&#160;]<!-- end-ref --><!-- ref --><p ALIGN="justify" style="word-spacing: 0; line-height: 100%"><font face="Verdana" size="2">10. Rached-Paoli I, Henríquez-Pérez G, Azuaje-Sánchez A. Efectividad del índice de masa corporal en el diagnóstico nutricional de gestantes. Arch Latinoam Nutr. 2005;55(1):42-6.</font>&nbsp;&nbsp;&nbsp;&nbsp;&nbsp;&nbsp;&nbsp;&nbsp;[&#160;<a href="javascript:void(0);" onclick="javascript: window.open('/scielo.php?script=sci_nlinks&ref=530727&pid=S0004-0622201500030000600010&lng=','','width=640,height=500,resizable=yes,scrollbars=1,menubar=yes,');">Links</a>&#160;]<!-- end-ref --><!-- ref --><p ALIGN="justify" style="word-spacing: 0; line-height: 100%"><font face="Verdana" size="2">11. Frisancho AR, editor. Anthropometric standards for the assessment of growth and nutritional status. Washington, D.C.: The University of Michigan Press; 1993. p.168.</font>&nbsp;&nbsp;&nbsp;&nbsp;&nbsp;&nbsp;&nbsp;&nbsp;[&#160;<a href="javascript:void(0);" onclick="javascript: window.open('/scielo.php?script=sci_nlinks&ref=530728&pid=S0004-0622201500030000600011&lng=','','width=640,height=500,resizable=yes,scrollbars=1,menubar=yes,');">Links</a>&#160;]<!-- end-ref --><!-- ref --><p ALIGN="justify" style="word-spacing: 0; line-height: 100%"><font face="Verdana" size="2">12. Neumann CG. Referente data. In: Jelliffe DB, Jelliffe EF, editors. Human Nutrition. Nutrition and Growth. Plenum Press: New York, 1979. pp. 299-327.</font>&nbsp;&nbsp;&nbsp;&nbsp;&nbsp;&nbsp;&nbsp;&nbsp;[&#160;<a href="javascript:void(0);" onclick="javascript: window.open('/scielo.php?script=sci_nlinks&ref=530729&pid=S0004-0622201500030000600012&lng=','','width=640,height=500,resizable=yes,scrollbars=1,menubar=yes,');">Links</a>&#160;]<!-- end-ref --><p ALIGN="justify" style="word-spacing: 0; line-height: 100%"><font face="Verdana" size="2">13. Tanner JM, Hiernaux J, Jarman S. Growth and physique studies. In: Weiner JS, Lourie JA, editors. Human biology: A guide to field methods. Blackwell Scientific: Oxford, 1969. pp. 1-76.</font></p>     <!-- ref --><p ALIGN="justify" style="word-spacing: 0; line-height: 100%"><font face="Verdana" size="2">14. Heymsfield SB, Mc Manus C, Smith J, Stevens V, Nixon DW. Anthropometric measurement of muscle mass: revised equations for calculating bone-free arm muscle area. Am J Clin Nutr 1982;36:680-690.</font>&nbsp;&nbsp;&nbsp;&nbsp;&nbsp;&nbsp;&nbsp;&nbsp;[&#160;<a href="javascript:void(0);" onclick="javascript: window.open('/scielo.php?script=sci_nlinks&ref=530731&pid=S0004-0622201500030000600013&lng=','','width=640,height=500,resizable=yes,scrollbars=1,menubar=yes,');">Links</a>&#160;]<!-- end-ref --><!-- ref --><p ALIGN="justify" style="word-spacing: 0; line-height: 100%"><font face="Verdana" size="2">15. López LB, Calvo EB, Poy MS, del Valle Balmaceda Y, Cámera K. Changes in skinfolds and mid-upper arm circumference during pregnancy in Argentine women. Matern Child Nutr 2011;7(3):253-262.</font>&nbsp;&nbsp;&nbsp;&nbsp;&nbsp;&nbsp;&nbsp;&nbsp;[&#160;<a href="javascript:void(0);" onclick="javascript: window.open('/scielo.php?script=sci_nlinks&ref=530732&pid=S0004-0622201500030000600014&lng=','','width=640,height=500,resizable=yes,scrollbars=1,menubar=yes,');">Links</a>&#160;]<!-- end-ref --><!-- ref --><p ALIGN="justify" style="word-spacing: 0; line-height: 100%"><font face="Verdana" size="2">16. Institute of Medicine. Nutrition during pregnancy: Weight gain and nutrient supplements. National Academy Press: Washington, D.C., 1990.</font>&nbsp;&nbsp;&nbsp;&nbsp;&nbsp;&nbsp;&nbsp;&nbsp;[&#160;<a href="javascript:void(0);" onclick="javascript: window.open('/scielo.php?script=sci_nlinks&ref=530733&pid=S0004-0622201500030000600015&lng=','','width=640,height=500,resizable=yes,scrollbars=1,menubar=yes,');">Links</a>&#160;]<!-- end-ref --><!-- ref --><p ALIGN="justify" style="word-spacing: 0; line-height: 100%"><font face="Verdana" size="2">17. Forsum E, Sadurskis A, Wager J. Estimation of body fat in healthy Swedish women during pregnancy and lactation. Am J Clin Nutr 1989;50:465-473.</font>&nbsp;&nbsp;&nbsp;&nbsp;&nbsp;&nbsp;&nbsp;&nbsp;[&#160;<a href="javascript:void(0);" onclick="javascript: window.open('/scielo.php?script=sci_nlinks&ref=530734&pid=S0004-0622201500030000600016&lng=','','width=640,height=500,resizable=yes,scrollbars=1,menubar=yes,');">Links</a>&#160;]<!-- end-ref --><!-- ref --><p ALIGN="justify" style="word-spacing: 0; line-height: 100%"><font face="Verdana" size="2">18. Husaini Y, Husaini M, Sulaiman Z, Jahari A, Barizi Hudono S, Karyadi D. Maternal malnutrition, outcome of pregnancy, an a simple tool to identify women at risk. Food Nutr Bull 1984;8(1):71-76.</font>&nbsp;&nbsp;&nbsp;&nbsp;&nbsp;&nbsp;&nbsp;&nbsp;[&#160;<a href="javascript:void(0);" onclick="javascript: window.open('/scielo.php?script=sci_nlinks&ref=530735&pid=S0004-0622201500030000600017&lng=','','width=640,height=500,resizable=yes,scrollbars=1,menubar=yes,');">Links</a>&#160;]<!-- end-ref --><!-- ref --><p ALIGN="justify" style="word-spacing: 0; line-height: 100%"><font face="Verdana" size="2">19. Ghosh A. Anthropometric and body composition characteristics during pregnancy: a study from West Bengal, India. HOMO J Comparative Hum Biol 2012; 63(3):233-240.</font>&nbsp;&nbsp;&nbsp;&nbsp;&nbsp;&nbsp;&nbsp;&nbsp;[&#160;<a href="javascript:void(0);" onclick="javascript: window.open('/scielo.php?script=sci_nlinks&ref=530736&pid=S0004-0622201500030000600018&lng=','','width=640,height=500,resizable=yes,scrollbars=1,menubar=yes,');">Links</a>&#160;]<!-- end-ref --><!-- ref --><p ALIGN="justify" style="word-spacing: 0; line-height: 100%"><font face="Verdana" size="2">20. Arroyo P, García D, Llerena C, quiroz S. Subcutaneous fat accumulation during pregnancy in a malnourished population. Br J Nutr 1978;40:485-489.</font>&nbsp;&nbsp;&nbsp;&nbsp;&nbsp;&nbsp;&nbsp;&nbsp;[&#160;<a href="javascript:void(0);" onclick="javascript: window.open('/scielo.php?script=sci_nlinks&ref=530737&pid=S0004-0622201500030000600019&lng=','','width=640,height=500,resizable=yes,scrollbars=1,menubar=yes,');">Links</a>&#160;]<!-- end-ref --><!-- ref --><p ALIGN="justify" style="word-spacing: 0; line-height: 100%"><font face="Verdana" size="2">21. Taggart N, Holliday R, Billewicz W, Hytten F, Thomson A. Changes in skinfolds during pregnancy. Br J Nutr 1967;21:439-451.    &nbsp;&nbsp;&nbsp;&nbsp;&nbsp;&nbsp;&nbsp;&nbsp;[&#160;<a href="javascript:void(0);" onclick="javascript: window.open('/scielo.php?script=sci_nlinks&ref=530738&pid=S0004-0622201500030000600020&lng=','','width=640,height=500,resizable=yes,scrollbars=1,menubar=yes,');">Links</a>&#160;]<!-- end-ref --><!-- ref --> 22. Stuebe AM, Rich-Edwards JW. The reset hypothesis: Lactation and maternal metabolism. Am J Perinatol 2009;26(1):81-88.</font>&nbsp;&nbsp;&nbsp;&nbsp;&nbsp;&nbsp;&nbsp;&nbsp;[&#160;<a href="javascript:void(0);" onclick="javascript: window.open('/scielo.php?script=sci_nlinks&ref=530739&pid=S0004-0622201500030000600021&lng=','','width=640,height=500,resizable=yes,scrollbars=1,menubar=yes,');">Links</a>&#160;]<!-- end-ref --><!-- ref --><p ALIGN="justify" style="word-spacing: 0; line-height: 100%"><font face="Verdana" size="2">23. Rebuffé M, Enk L, Crona N, Lönnroth P, Abrahamson L, Smith U, Björntorp. Fat Cell metabolism in different regions in women: effect of menstrual cycle, pregnancy, and lactation. J Clin Invest 1985;75:1973-976.</font>&nbsp;&nbsp;&nbsp;&nbsp;&nbsp;&nbsp;&nbsp;&nbsp;[&#160;<a href="javascript:void(0);" onclick="javascript: window.open('/scielo.php?script=sci_nlinks&ref=530740&pid=S0004-0622201500030000600022&lng=','','width=640,height=500,resizable=yes,scrollbars=1,menubar=yes,');">Links</a>&#160;]<!-- end-ref --><!-- ref --><p ALIGN="justify" style="word-spacing: 0; line-height: 100%"><font face="Verdana" size="2">24. Scholl T, Hediger M, Cronk C, Schall J. Maternal growth during pregnancy and lactation. Horm Res 1993;39(Suppl 3):59S-67S.</font>&nbsp;&nbsp;&nbsp;&nbsp;&nbsp;&nbsp;&nbsp;&nbsp;[&#160;<a href="javascript:void(0);" onclick="javascript: window.open('/scielo.php?script=sci_nlinks&ref=530741&pid=S0004-0622201500030000600023&lng=','','width=640,height=500,resizable=yes,scrollbars=1,menubar=yes,');">Links</a>&#160;]<!-- end-ref --><!-- ref --><p ALIGN="justify" style="word-spacing: 0; line-height: 100%"><font face="Verdana" size="2">25. Hytten FE. Weight gain in pregnancy. In: Hytten FE, Chambuerlain F, editors. Clinical physiology in obstetrics. Blackwell Scientific Publications: Oxford, 1980, pp 193-233.</font>&nbsp;&nbsp;&nbsp;&nbsp;&nbsp;&nbsp;&nbsp;&nbsp;[&#160;<a href="javascript:void(0);" onclick="javascript: window.open('/scielo.php?script=sci_nlinks&ref=530742&pid=S0004-0622201500030000600024&lng=','','width=640,height=500,resizable=yes,scrollbars=1,menubar=yes,');">Links</a>&#160;]<!-- end-ref --><!-- ref --><p ALIGN="justify" style="word-spacing: 0; line-height: 100%"><font face="Verdana" size="2">26. Hopkinson J, Butte N, Ellis K, Wong W, Puyau M, Smith B. Body fat estimation in late pregnancy and early postpartum: comparison of two.-three, and four component models. Am J Clin Nutr 1997;65:432-438. </font>&nbsp;&nbsp;&nbsp;&nbsp;&nbsp;&nbsp;&nbsp;&nbsp;[&#160;<a href="javascript:void(0);" onclick="javascript: window.open('/scielo.php?script=sci_nlinks&ref=530743&pid=S0004-0622201500030000600025&lng=','','width=640,height=500,resizable=yes,scrollbars=1,menubar=yes,');">Links</a>&#160;]<!-- end-ref --><!-- ref --><p ALIGN="justify" style="word-spacing: 0; line-height: 100%"><font face="Verdana" size="2">27. WHO. Pregnant and lactating women. In: Physical status: the use and interpretation of anthropometry. WHO: Geneva, 1995, pp 37-120.    &nbsp;&nbsp;&nbsp;&nbsp;&nbsp;&nbsp;&nbsp;&nbsp;[&#160;<a href="javascript:void(0);" onclick="javascript: window.open('/scielo.php?script=sci_nlinks&ref=530744&pid=S0004-0622201500030000600026&lng=','','width=640,height=500,resizable=yes,scrollbars=1,menubar=yes,');">Links</a>&#160;]<!-- end-ref --><!-- ref --> 28. Lijmer JG, Mol BW, Heisterkamp S, Bonsel GJ, Prins MH, van der Meulen JH, et al. Empirical evidence of design-related bias in studies of diagnostic tests. JAMA 1999;282(11):1061-1066.</font>&nbsp;&nbsp;&nbsp;&nbsp;&nbsp;&nbsp;&nbsp;&nbsp;[&#160;<a href="javascript:void(0);" onclick="javascript: window.open('/scielo.php?script=sci_nlinks&ref=530745&pid=S0004-0622201500030000600027&lng=','','width=640,height=500,resizable=yes,scrollbars=1,menubar=yes,');">Links</a>&#160;]<!-- end-ref --> ]]></body>
<back>
<ref-list>
<ref id="B1">
<label>1</label><nlm-citation citation-type="book">
<person-group person-group-type="author">
<name>
<surname><![CDATA[Forbes]]></surname>
<given-names><![CDATA[GB]]></given-names>
</name>
</person-group>
<source><![CDATA[Human body composition growth: aging nutrition and activity]]></source>
<year>1987</year>
<publisher-name><![CDATA[Champaign]]></publisher-name>
</nlm-citation>
</ref>
<ref id="B2">
<label>2</label><nlm-citation citation-type="journal">
<person-group person-group-type="author">
<name>
<surname><![CDATA[Cetin]]></surname>
<given-names><![CDATA[I]]></given-names>
</name>
<name>
<surname><![CDATA[Alvino]]></surname>
<given-names><![CDATA[G]]></given-names>
</name>
<name>
<surname><![CDATA[Radaelli]]></surname>
<given-names><![CDATA[T]]></given-names>
</name>
<name>
<surname><![CDATA[Pardi]]></surname>
<given-names><![CDATA[G]]></given-names>
</name>
</person-group>
<article-title xml:lang="en"><![CDATA[Fetal nutrition: a review]]></article-title>
<source><![CDATA[Act Pædiatr]]></source>
<year>2005</year>
<volume>94</volume>
<numero>Suppl 449</numero>
<issue>Suppl 449</issue>
<page-range>7-13</page-range></nlm-citation>
</ref>
<ref id="B3">
<label>3</label><nlm-citation citation-type="journal">
<person-group person-group-type="author">
<name>
<surname><![CDATA[Heophinson]]></surname>
<given-names><![CDATA[JM]]></given-names>
</name>
<name>
<surname><![CDATA[Butte]]></surname>
<given-names><![CDATA[NF]]></given-names>
</name>
<name>
<surname><![CDATA[Ellis]]></surname>
<given-names><![CDATA[KL]]></given-names>
</name>
<name>
<surname><![CDATA[Wong]]></surname>
<given-names><![CDATA[WW]]></given-names>
</name>
<name>
<surname><![CDATA[Puyan]]></surname>
<given-names><![CDATA[MR]]></given-names>
</name>
<name>
<surname><![CDATA[O’Brian]]></surname>
<given-names><![CDATA[SE]]></given-names>
</name>
</person-group>
<article-title xml:lang="en"><![CDATA[Body fat estimation in late pregnancy and early postpartum: comparison of two-, there-, and four- component models]]></article-title>
<source><![CDATA[Am J Clin Nutr]]></source>
<year>1997</year>
<volume>65</volume>
<page-range>432- 438</page-range></nlm-citation>
</ref>
<ref id="B4">
<label>4</label><nlm-citation citation-type="journal">
<person-group person-group-type="author">
<name>
<surname><![CDATA[Widem]]></surname>
<given-names><![CDATA[EM]]></given-names>
</name>
<name>
<surname><![CDATA[Gallagher]]></surname>
<given-names><![CDATA[D]]></given-names>
</name>
</person-group>
<article-title xml:lang="en"><![CDATA[Body composition changes in pregnancy: measurement predictors and outcomes]]></article-title>
<source><![CDATA[Eur J Clin Nutr]]></source>
<year>2014</year>
<volume>68</volume>
<numero>6</numero>
<issue>6</issue>
<page-range>643-652</page-range></nlm-citation>
</ref>
<ref id="B5">
<label>5</label><nlm-citation citation-type="journal">
<person-group person-group-type="author">
<name>
<surname><![CDATA[Villar]]></surname>
<given-names><![CDATA[J]]></given-names>
</name>
<name>
<surname><![CDATA[Cogswell]]></surname>
<given-names><![CDATA[M]]></given-names>
</name>
<name>
<surname><![CDATA[Kestler]]></surname>
<given-names><![CDATA[E]]></given-names>
</name>
<name>
<surname><![CDATA[Castillo]]></surname>
<given-names><![CDATA[P]]></given-names>
</name>
<name>
<surname><![CDATA[Menendez]]></surname>
<given-names><![CDATA[R]]></given-names>
</name>
<name>
<surname><![CDATA[Repke]]></surname>
<given-names><![CDATA[J]]></given-names>
</name>
</person-group>
<article-title xml:lang="en"><![CDATA[Effect of fat and fat-free mass deposition during pregnancy on birth weight]]></article-title>
<source><![CDATA[Am J Obstet Gynecol]]></source>
<year>1992</year>
<volume>167</volume>
<numero>5</numero>
<issue>5</issue>
<page-range>1344-1352</page-range></nlm-citation>
</ref>
<ref id="B6">
<label>6</label><nlm-citation citation-type="book">
<person-group person-group-type="author">
<name>
<surname><![CDATA[Frisancho]]></surname>
<given-names><![CDATA[AR]]></given-names>
</name>
</person-group>
<source><![CDATA[Anthropometric standards for the assessment of growth and nutritional status]]></source>
<year>1993</year>
<page-range>168</page-range><publisher-loc><![CDATA[Washington ]]></publisher-loc>
<publisher-name><![CDATA[D.C.: The University of Michigan Press]]></publisher-name>
</nlm-citation>
</ref>
<ref id="B7">
<label>7</label><nlm-citation citation-type="journal">
<person-group person-group-type="author">
<name>
<surname><![CDATA[McMillen]]></surname>
<given-names><![CDATA[IC]]></given-names>
</name>
<name>
<surname><![CDATA[MacLaughlin]]></surname>
<given-names><![CDATA[SM]]></given-names>
</name>
<name>
<surname><![CDATA[Muhlhausler]]></surname>
<given-names><![CDATA[BS]]></given-names>
</name>
<name>
<surname><![CDATA[Gentili]]></surname>
<given-names><![CDATA[S]]></given-names>
</name>
<name>
<surname><![CDATA[Duffield]]></surname>
<given-names><![CDATA[JL]]></given-names>
</name>
<name>
<surname><![CDATA[Morrisor]]></surname>
<given-names><![CDATA[JL]]></given-names>
</name>
</person-group>
<article-title xml:lang="en"><![CDATA[Developmental origins of adult health and disease: the role of periconceptional and fetal nutrition]]></article-title>
<source><![CDATA[Basic Clin Pharmacol Toxicol]]></source>
<year>2008</year>
<volume>102</volume>
<page-range>82-89</page-range></nlm-citation>
</ref>
<ref id="B8">
<label>8</label><nlm-citation citation-type="journal">
<person-group person-group-type="author">
<name>
<surname><![CDATA[Gabory]]></surname>
<given-names><![CDATA[A]]></given-names>
</name>
<name>
<surname><![CDATA[Attig]]></surname>
<given-names><![CDATA[L]]></given-names>
</name>
<name>
<surname><![CDATA[Junien]]></surname>
<given-names><![CDATA[C]]></given-names>
</name>
</person-group>
<article-title xml:lang="en"><![CDATA[Developmental programming and epigenetics]]></article-title>
<source><![CDATA[Am J Clin Nutr]]></source>
<year>2011</year>
<volume>94</volume>
<numero>6 Suppl</numero>
<issue>6 Suppl</issue>
<page-range>1943S-952S</page-range></nlm-citation>
</ref>
<ref id="B9">
<label>9</label><nlm-citation citation-type="journal">
<person-group person-group-type="author">
<name>
<surname><![CDATA[Rached]]></surname>
<given-names><![CDATA[I]]></given-names>
</name>
<name>
<surname><![CDATA[Azuaje]]></surname>
<given-names><![CDATA[A]]></given-names>
</name>
<name>
<surname><![CDATA[Henríquez]]></surname>
<given-names><![CDATA[G]]></given-names>
</name>
</person-group>
<article-title xml:lang="es"><![CDATA[Estado nutricional en gestantes de una comunidad menos privilegiada de Caracas]]></article-title>
<source><![CDATA[An Venez Nutr]]></source>
<year>2002</year>
<volume>15</volume>
<numero>2</numero>
<issue>2</issue>
<page-range>94-104</page-range></nlm-citation>
</ref>
<ref id="B10">
<label>10</label><nlm-citation citation-type="journal">
<person-group person-group-type="author">
<name>
<surname><![CDATA[Rached-Paoli]]></surname>
<given-names><![CDATA[I]]></given-names>
</name>
<name>
<surname><![CDATA[Henríquez-Pérez]]></surname>
<given-names><![CDATA[G]]></given-names>
</name>
<name>
<surname><![CDATA[Azuaje-Sánchez]]></surname>
<given-names><![CDATA[A]]></given-names>
</name>
</person-group>
<article-title xml:lang="es"><![CDATA[Efectividad del índice de masa corporal en el diagnóstico nutricional de gestantes]]></article-title>
<source><![CDATA[Arch Latinoam Nutr.]]></source>
<year>2005</year>
<volume>55</volume>
<numero>1</numero>
<issue>1</issue>
<page-range>42-6</page-range></nlm-citation>
</ref>
<ref id="B11">
<label>11</label><nlm-citation citation-type="book">
<person-group person-group-type="author">
<name>
<surname><![CDATA[Frisancho]]></surname>
<given-names><![CDATA[AR]]></given-names>
</name>
</person-group>
<source><![CDATA[Anthropometric standards for the assessment of growth and nutritional status]]></source>
<year>1993</year>
<page-range>168</page-range><publisher-loc><![CDATA[Washington ]]></publisher-loc>
<publisher-name><![CDATA[D.C.: The University of Michigan Press]]></publisher-name>
</nlm-citation>
</ref>
<ref id="B12">
<label>12</label><nlm-citation citation-type="book">
<person-group person-group-type="author">
<name>
<surname><![CDATA[Neumann]]></surname>
<given-names><![CDATA[CG]]></given-names>
</name>
</person-group>
<article-title xml:lang="en"><![CDATA[Referente data]]></article-title>
<person-group person-group-type="editor">
<name>
<surname><![CDATA[Jelliffe]]></surname>
<given-names><![CDATA[DB]]></given-names>
</name>
<name>
<surname><![CDATA[Jelliffe]]></surname>
<given-names><![CDATA[EF]]></given-names>
</name>
</person-group>
<source><![CDATA[Human Nutrition. Nutrition and Growth]]></source>
<year>1979</year>
<publisher-loc><![CDATA[New York ]]></publisher-loc>
<publisher-name><![CDATA[Plenum Press]]></publisher-name>
</nlm-citation>
</ref>
<ref id="B13">
<label>14</label><nlm-citation citation-type="journal">
<person-group person-group-type="author">
<name>
<surname><![CDATA[Heymsfield]]></surname>
<given-names><![CDATA[SB]]></given-names>
</name>
<name>
<surname><![CDATA[Mc]]></surname>
<given-names><![CDATA[Manus C]]></given-names>
</name>
<name>
<surname><![CDATA[Smith]]></surname>
<given-names><![CDATA[J]]></given-names>
</name>
<name>
<surname><![CDATA[Stevens]]></surname>
<given-names><![CDATA[V]]></given-names>
</name>
<name>
<surname><![CDATA[Nixon]]></surname>
<given-names><![CDATA[DW]]></given-names>
</name>
</person-group>
<article-title xml:lang="en"><![CDATA[Anthropometric measurement of muscle mass: revised equations for calculating bone-free arm muscle area]]></article-title>
<source><![CDATA[Am J Clin Nutr]]></source>
<year>1982</year>
<volume>36</volume>
<page-range>680-690</page-range></nlm-citation>
</ref>
<ref id="B14">
<label>15</label><nlm-citation citation-type="journal">
<person-group person-group-type="author">
<name>
<surname><![CDATA[López]]></surname>
<given-names><![CDATA[LB]]></given-names>
</name>
<name>
<surname><![CDATA[Calvo]]></surname>
<given-names><![CDATA[EB]]></given-names>
</name>
<name>
<surname><![CDATA[Poy]]></surname>
<given-names><![CDATA[MS]]></given-names>
</name>
<name>
<surname><![CDATA[del]]></surname>
<given-names><![CDATA[Valle Balmaceda Y]]></given-names>
</name>
<name>
<surname><![CDATA[Cámera]]></surname>
<given-names><![CDATA[K]]></given-names>
</name>
</person-group>
<article-title xml:lang="en"><![CDATA[Changes in skinfolds and mid-upper arm circumference during pregnancy in Argentine women]]></article-title>
<source><![CDATA[Matern Child Nutr]]></source>
<year>2011</year>
<volume>7</volume>
<numero>3</numero>
<issue>3</issue>
<page-range>253-262</page-range></nlm-citation>
</ref>
<ref id="B15">
<label>16</label><nlm-citation citation-type="book">
<collab>Institute of Medicine</collab>
<source><![CDATA[Nutrition during pregnancy: Weight gain and nutrient supplements]]></source>
<year>1990</year>
<publisher-loc><![CDATA[^eWashington, D.C Washington, D.C]]></publisher-loc>
<publisher-name><![CDATA[National Academy Press]]></publisher-name>
</nlm-citation>
</ref>
<ref id="B16">
<label>17</label><nlm-citation citation-type="journal">
<person-group person-group-type="author">
<name>
<surname><![CDATA[Forsum]]></surname>
<given-names><![CDATA[E]]></given-names>
</name>
<name>
<surname><![CDATA[Sadurskis]]></surname>
<given-names><![CDATA[A]]></given-names>
</name>
<name>
<surname><![CDATA[Wager]]></surname>
<given-names><![CDATA[J]]></given-names>
</name>
</person-group>
<article-title xml:lang="en"><![CDATA[Estimation of body fat in healthy Swedish women during pregnancy and lactation]]></article-title>
<source><![CDATA[Am J Clin Nutr]]></source>
<year>1989</year>
<volume>50</volume>
<page-range>465-473</page-range></nlm-citation>
</ref>
<ref id="B17">
<label>18</label><nlm-citation citation-type="journal">
<person-group person-group-type="author">
<name>
<surname><![CDATA[Husaini]]></surname>
<given-names><![CDATA[Y]]></given-names>
</name>
<name>
<surname><![CDATA[Husaini]]></surname>
<given-names><![CDATA[M]]></given-names>
</name>
<name>
<surname><![CDATA[Sulaiman]]></surname>
<given-names><![CDATA[Z]]></given-names>
</name>
<name>
<surname><![CDATA[Jahari]]></surname>
<given-names><![CDATA[A]]></given-names>
</name>
<name>
<surname><![CDATA[Barizi]]></surname>
<given-names><![CDATA[Hudono S]]></given-names>
</name>
<name>
<surname><![CDATA[Karyadi]]></surname>
<given-names><![CDATA[D]]></given-names>
</name>
</person-group>
<article-title xml:lang="en"><![CDATA[Maternal malnutrition, outcome of pregnancy, an a simple tool to identify women at risk]]></article-title>
<source><![CDATA[Food Nutr Bull]]></source>
<year>1984</year>
<volume>8</volume>
<numero>1</numero>
<issue>1</issue>
<page-range>71-76</page-range></nlm-citation>
</ref>
<ref id="B18">
<label>19</label><nlm-citation citation-type="journal">
<person-group person-group-type="author">
<name>
<surname><![CDATA[Ghosh]]></surname>
<given-names><![CDATA[A]]></given-names>
</name>
</person-group>
<article-title xml:lang="en"><![CDATA[Anthropometric and body composition characteristics during pregnancy: a study from West Bengal, India]]></article-title>
<source><![CDATA[HOMO J Comparative Hum Biol]]></source>
<year>2012</year>
<volume>63</volume>
<numero>3</numero>
<issue>3</issue>
<page-range>233-240</page-range></nlm-citation>
</ref>
<ref id="B19">
<label>20</label><nlm-citation citation-type="journal">
<person-group person-group-type="author">
<name>
<surname><![CDATA[Arroyo]]></surname>
<given-names><![CDATA[P]]></given-names>
</name>
<name>
<surname><![CDATA[García]]></surname>
<given-names><![CDATA[D]]></given-names>
</name>
<name>
<surname><![CDATA[Llerena]]></surname>
<given-names><![CDATA[C]]></given-names>
</name>
<name>
<surname><![CDATA[quiroz]]></surname>
<given-names><![CDATA[S]]></given-names>
</name>
</person-group>
<article-title xml:lang="en"><![CDATA[Subcutaneous fat accumulation during pregnancy in a malnourished population]]></article-title>
<source><![CDATA[Br J Nutr]]></source>
<year>1978</year>
<volume>40</volume>
<page-range>485-489</page-range></nlm-citation>
</ref>
<ref id="B20">
<label>21</label><nlm-citation citation-type="journal">
<person-group person-group-type="author">
<name>
<surname><![CDATA[Taggart]]></surname>
<given-names><![CDATA[N]]></given-names>
</name>
<name>
<surname><![CDATA[Holliday]]></surname>
<given-names><![CDATA[R]]></given-names>
</name>
<name>
<surname><![CDATA[Billewicz]]></surname>
<given-names><![CDATA[W]]></given-names>
</name>
<name>
<surname><![CDATA[Hytten]]></surname>
<given-names><![CDATA[F]]></given-names>
</name>
<name>
<surname><![CDATA[Thomson]]></surname>
<given-names><![CDATA[A]]></given-names>
</name>
</person-group>
<article-title xml:lang="en"><![CDATA[Changes in skinfolds during pregnancy]]></article-title>
<source><![CDATA[Br J Nutr]]></source>
<year>1967</year>
<volume>21</volume>
<page-range>439-451</page-range></nlm-citation>
</ref>
<ref id="B21">
<label>22</label><nlm-citation citation-type="journal">
<person-group person-group-type="author">
<name>
<surname><![CDATA[Stuebe]]></surname>
<given-names><![CDATA[AM]]></given-names>
</name>
<name>
<surname><![CDATA[Rich-Edwards]]></surname>
<given-names><![CDATA[JW]]></given-names>
</name>
</person-group>
<article-title xml:lang="en"><![CDATA[The reset hypothesis: Lactation and maternal metabolism]]></article-title>
<source><![CDATA[Am J Perinatol]]></source>
<year>2009</year>
<volume>26</volume>
<numero>1</numero>
<issue>1</issue>
<page-range>81-88</page-range></nlm-citation>
</ref>
<ref id="B22">
<label>23</label><nlm-citation citation-type="journal">
<person-group person-group-type="author">
<name>
<surname><![CDATA[Rebuffé]]></surname>
<given-names><![CDATA[M]]></given-names>
</name>
<name>
<surname><![CDATA[Enk]]></surname>
<given-names><![CDATA[L]]></given-names>
</name>
<name>
<surname><![CDATA[Crona]]></surname>
<given-names><![CDATA[N]]></given-names>
</name>
<name>
<surname><![CDATA[Lönnroth]]></surname>
<given-names><![CDATA[P]]></given-names>
</name>
<name>
<surname><![CDATA[Abrahamson]]></surname>
<given-names><![CDATA[L]]></given-names>
</name>
<name>
<surname><![CDATA[Smith]]></surname>
<given-names><![CDATA[U, Björntorp]]></given-names>
</name>
</person-group>
<article-title xml:lang="en"><![CDATA[Fat Cell metabolism in different regions in women: effect of menstrual cycle, pregnancy, and lactation]]></article-title>
<source><![CDATA[J Clin Invest]]></source>
<year>1985</year>
<volume>75</volume>
<page-range>1973-976</page-range></nlm-citation>
</ref>
<ref id="B23">
<label>24</label><nlm-citation citation-type="journal">
<person-group person-group-type="author">
<name>
<surname><![CDATA[Scholl]]></surname>
<given-names><![CDATA[T]]></given-names>
</name>
<name>
<surname><![CDATA[Hediger]]></surname>
<given-names><![CDATA[M]]></given-names>
</name>
<name>
<surname><![CDATA[Cronk]]></surname>
<given-names><![CDATA[C]]></given-names>
</name>
<name>
<surname><![CDATA[Schall]]></surname>
<given-names><![CDATA[J]]></given-names>
</name>
</person-group>
<article-title xml:lang="en"><![CDATA[Maternal growth during pregnancy and lactation]]></article-title>
<source><![CDATA[Horm Res]]></source>
<year>1993</year>
<volume>39</volume>
<numero>Suppl 3</numero>
<issue>Suppl 3</issue>
<page-range>59S-67S</page-range></nlm-citation>
</ref>
<ref id="B24">
<label>25</label><nlm-citation citation-type="book">
<person-group person-group-type="author">
<name>
<surname><![CDATA[Hytten]]></surname>
<given-names><![CDATA[FE]]></given-names>
</name>
</person-group>
<article-title xml:lang="en"><![CDATA[Weight gain in pregnancy]]></article-title>
<person-group person-group-type="editor">
<name>
<surname><![CDATA[Hytten]]></surname>
<given-names><![CDATA[FE]]></given-names>
</name>
<name>
<surname><![CDATA[Chambuerlain]]></surname>
<given-names><![CDATA[F]]></given-names>
</name>
</person-group>
<source><![CDATA[Clinical physiology in obstetrics]]></source>
<year>1980</year>
<page-range>193-233</page-range><publisher-loc><![CDATA[Oxford ]]></publisher-loc>
<publisher-name><![CDATA[Blackwell Scientific Publications]]></publisher-name>
</nlm-citation>
</ref>
<ref id="B25">
<label>26</label><nlm-citation citation-type="journal">
<person-group person-group-type="author">
<name>
<surname><![CDATA[Hopkinson]]></surname>
<given-names><![CDATA[J]]></given-names>
</name>
<name>
<surname><![CDATA[Butte]]></surname>
<given-names><![CDATA[N]]></given-names>
</name>
<name>
<surname><![CDATA[Ellis]]></surname>
<given-names><![CDATA[K]]></given-names>
</name>
<name>
<surname><![CDATA[Wong]]></surname>
<given-names><![CDATA[W]]></given-names>
</name>
<name>
<surname><![CDATA[Puyau]]></surname>
<given-names><![CDATA[M]]></given-names>
</name>
<name>
<surname><![CDATA[Smith]]></surname>
<given-names><![CDATA[B]]></given-names>
</name>
</person-group>
<article-title xml:lang="en"><![CDATA[Body fat estimation in late pregnancy and early postpartum: comparison of two.-three, and four component models]]></article-title>
<source><![CDATA[Am J Clin Nutr]]></source>
<year>1997</year>
<volume>65</volume>
<page-range>432-438</page-range></nlm-citation>
</ref>
<ref id="B26">
<label>27</label><nlm-citation citation-type="book">
<collab>WHO</collab>
<article-title xml:lang="en"><![CDATA[Pregnant and lactating women]]></article-title>
<source><![CDATA[Physical status: the use and interpretation of anthropometry]]></source>
<year>1995</year>
<page-range>37-120</page-range><publisher-loc><![CDATA[Geneva ]]></publisher-loc>
<publisher-name><![CDATA[WHO]]></publisher-name>
</nlm-citation>
</ref>
<ref id="B27">
<label>28</label><nlm-citation citation-type="journal">
<person-group person-group-type="author">
<name>
<surname><![CDATA[Lijmer]]></surname>
<given-names><![CDATA[JG]]></given-names>
</name>
<name>
<surname><![CDATA[Mol]]></surname>
<given-names><![CDATA[BW]]></given-names>
</name>
<name>
<surname><![CDATA[Heisterkamp]]></surname>
<given-names><![CDATA[S]]></given-names>
</name>
<name>
<surname><![CDATA[Bonsel]]></surname>
<given-names><![CDATA[GJ]]></given-names>
</name>
<name>
<surname><![CDATA[Prins]]></surname>
<given-names><![CDATA[MH]]></given-names>
</name>
<name>
<surname><![CDATA[van]]></surname>
<given-names><![CDATA[der Meulen JH]]></given-names>
</name>
</person-group>
<article-title xml:lang="en"><![CDATA[Empirical evidence of design-related bias in studies of diagnostic tests]]></article-title>
<source><![CDATA[JAMA]]></source>
<year>1999</year>
<volume>282</volume>
<numero>11</numero>
<issue>11</issue>
<page-range>1061-1066</page-range></nlm-citation>
</ref>
</ref-list>
</back>
</article>