<?xml version="1.0" encoding="ISO-8859-1"?><article xmlns:mml="http://www.w3.org/1998/Math/MathML" xmlns:xlink="http://www.w3.org/1999/xlink" xmlns:xsi="http://www.w3.org/2001/XMLSchema-instance">
<front>
<journal-meta>
<journal-id>0004-0622</journal-id>
<journal-title><![CDATA[Archivos Latinoamericanos de Nutrición]]></journal-title>
<abbrev-journal-title><![CDATA[ALAN]]></abbrev-journal-title>
<issn>0004-0622</issn>
<publisher>
<publisher-name><![CDATA[Sociedad Latinoamericana de Nutrición]]></publisher-name>
</publisher>
</journal-meta>
<article-meta>
<article-id>S0004-06222004000200012</article-id>
<title-group>
<article-title xml:lang="es"><![CDATA[Evaluación de una metodología para determinar características de textura de tortilla de maíz (Zea mays L.)]]></article-title>
</title-group>
<contrib-group>
<contrib contrib-type="author">
<name>
<surname><![CDATA[Arámbula-Villa]]></surname>
<given-names><![CDATA[Gerónimo]]></given-names>
</name>
<xref ref-type="aff" rid="A01"/>
</contrib>
<contrib contrib-type="author">
<name>
<surname><![CDATA[Méndez-Albores]]></surname>
<given-names><![CDATA[J. Abraham]]></given-names>
</name>
</contrib>
<contrib contrib-type="author">
<name>
<surname><![CDATA[González-Hernández]]></surname>
<given-names><![CDATA[Jesús]]></given-names>
</name>
</contrib>
<contrib contrib-type="author">
<name>
<surname><![CDATA[Gutiérrez-Árias]]></surname>
<given-names><![CDATA[Edmundo]]></given-names>
</name>
</contrib>
<contrib contrib-type="author">
<name>
<surname><![CDATA[Moreno-Martínez]]></surname>
<given-names><![CDATA[Ernesto]]></given-names>
</name>
</contrib>
</contrib-group>
<aff id="A01">
<institution><![CDATA[,Centro de Investigacion y de Estudios Avanzados del IPN  ]]></institution>
<addr-line><![CDATA[ ]]></addr-line>
</aff>
<pub-date pub-type="pub">
<day>05</day>
<month>06</month>
<year>2004</year>
</pub-date>
<pub-date pub-type="epub">
<day>05</day>
<month>06</month>
<year>2004</year>
</pub-date>
<volume>54</volume>
<numero>2</numero>
<fpage>216</fpage>
<lpage>222</lpage>
<copyright-statement/>
<copyright-year/>
<self-uri xlink:href="http://ve.scielo.org/scielo.php?script=sci_arttext&amp;pid=S0004-06222004000200012&amp;lng=en&amp;nrm=iso"></self-uri><self-uri xlink:href="http://ve.scielo.org/scielo.php?script=sci_abstract&amp;pid=S0004-06222004000200012&amp;lng=en&amp;nrm=iso"></self-uri><self-uri xlink:href="http://ve.scielo.org/scielo.php?script=sci_pdf&amp;pid=S0004-06222004000200012&amp;lng=en&amp;nrm=iso"></self-uri><abstract abstract-type="short" xml:lang="es"><p><![CDATA[La tortilla de maíz (Zea mays L.), es el principal alimento de la población Mexicana, con un consumo anual de 12 millones de toneladas. A pesar de su alto consumo, existe una gran variabilidad en las características de calidad de la tortilla producida comercialmente, principalmente las de textura. Para evaluar la textura de las tortillas se han reportado algunos métodos, pero los parámetros y valores obtenidos han sido muy variados y no comparten una base adecuada para su comparación. Además, la confiabilidad de los parámetros reportados, utilizando un texturómetro, tampoco ha sido evaluada. En este estudio se seleccionaron dos formas de la muestra, rectangular y probeta, así como la de varios parámetros de calidad obtenidos con el texturómetro (fuerza máxima, área total, área hasta fuerza máxima, elasticidad y elongación) y se evaluó su confiabilidad con base a su repetibilidad. De acuerdo a los resultados, la forma de "probeta" fue la más adecuada para las pruebas de tensión y elasticidad. Para la fuerza al corte, las dos formas resultaron con buena repetibilidad. La fuerza máxima fue el parámetro de mayor confiabilidad para las pruebas de tensión y corte, con una repetibilidad de 0.95 y 0.99 respectivamente. La elasticidad resultó con buena repetibilidad cuando la prueba se realizó con la forma de probeta (0.94). Utilizando el texturómetro y la forma de muestra tipo probeta, los parámetros determinados muestran alto grado de confiabilidad y facilitan la comparación de datos de textura para tortillas de maíz.]]></p></abstract>
<abstract abstract-type="short" xml:lang="en"><p><![CDATA[Maize (Zea mays L.) tortilla is the primary staple food of the Mexican people, with annual consumption estimated at 12 millions tons. Despite this huge volume of consumption, tortillas are commercially produced with inconsistent quality, mainly in terms of texture characteristics. Different methods to evaluate the texture of maize tortillas have been reported, but the values obtained and their parameters have not yielded reliable results, largely because the methods used do not reflect homogeneous elements for comparison. In addition, evaluation of the reliability of methods for comparing tortilla texture as well as the equipment used has been difficult, as such information perhaps remains largely unpublished. In this study, the reliability of two tortilla sample shapes (rectangle and briquet) and some of the quality parameters (maximum force, total area under curve, area to reach maximum force, elasticity and elongation) from tensile and cut force tested with a texture meter were evaluated. According to the results, the briquet shape of the tortilla samples was better (than the rectangle shape) for determining tensile and elasticity. In regard to cutting force, both the rectangle and the briquet shape presented good repeatability. For tensile and cutting force curves, the maximum force was the parameter with the highest reliability, 0.95 and 0.99, respectively. The elasticity showed an adequate reliability with the tortilla briquet shape (0.94). The evaluated parameters with the texture meter and the sample shape type briquet, showed a high reliability degree what makes possible the comparison of maize tortilla texture data.]]></p></abstract>
<kwd-group>
<kwd lng="es"><![CDATA[Parámetros de calidad]]></kwd>
<kwd lng="es"><![CDATA[confiabilidad]]></kwd>
<kwd lng="es"><![CDATA[nixtamalización]]></kwd>
<kwd lng="es"><![CDATA[repetibilidad]]></kwd>
<kwd lng="en"><![CDATA[Quality parameters]]></kwd>
<kwd lng="en"><![CDATA[reliability]]></kwd>
<kwd lng="en"><![CDATA[nixtamalization]]></kwd>
<kwd lng="en"><![CDATA[repeatability]]></kwd>
</kwd-group>
</article-meta>
</front><body><![CDATA[   <B><FONT SIZE=4>    <P ALIGN="CENTER"><font face="Times New Roman">Evaluaci&oacute;n de una metodolog&iacute;a para determinar caracter&iacute;sticas de textura de tortilla de ma&iacute;z (Zea mays L.)</font></P> </B></FONT>    <P ALIGN="CENTER">Ger&oacute;nimo Ar&aacute;mbula-Villa<sup>1</sup>, J. Abraham M&eacute;ndez-Albores<sup>1</sup> , Jes&uacute;s Gonz&aacute;lez-Hern&aacute;ndez<sup>1</sup>, Edmundo Guti&eacute;rrez-&Aacute;rias<sup>1</sup> y Ernesto Moreno-Mart&iacute;nez<sup>2</sup></P>     <P ALIGN="CENTER">Centro de Investigaci&oacute;n y de Estudios Avanzados del IPN. Unidad Quer&eacute;taro. Quer&eacute;taro, Qro. M&eacute;xico<sup>1</sup> - Facultad de Estudios Superiores Cuautitl&aacute;n. Universidad Nacional Aut&oacute;noma de M&eacute;xico<sup>2</sup></P> <B>    <P ALIGN="JUSTIFY">RESUMEN. </B>La tortilla de ma&iacute;z (<I>Zea mays L.</I>), es el principal alimento de la poblaci&oacute;n Mexicana, con un consumo anual de 12 millones de toneladas. A pesar de su alto consumo, existe una gran variabilidad en las caracter&iacute;sticas de calidad de la tortilla producida comercialmente, principalmente las de textura. Para evaluar la textura de las tortillas se han reportado algunos m&eacute;todos, pero los par&aacute;metros y valores obtenidos han sido muy variados y no comparten una base adecuada para su comparaci&oacute;n. Adem&aacute;s, la confiabilidad de los par&aacute;metros reportados, utilizando un textur&oacute;metro, tampoco ha sido evaluada. En este estudio se seleccionaron dos formas de la muestra, rectangular y probeta, as&iacute; como la de varios par&aacute;metros de calidad obtenidos con el textur&oacute;metro (fuerza m&aacute;xima, &aacute;rea total, &aacute;rea hasta fuerza m&aacute;xima, elasticidad y elongaci&oacute;n) y se evalu&oacute; su confiabilidad con base a su repetibilidad. De acuerdo a los resultados, la forma de "probeta" fue la m&aacute;s adecuada para las pruebas de tensi&oacute;n y elasticidad. Para la fuerza al corte, las dos formas resultaron con buena repetibilidad. La fuerza m&aacute;xima fue el par&aacute;metro de mayor confiabilidad para las pruebas de tensi&oacute;n y corte, con una repetibilidad de 0.95 y 0.99 respectivamente. La elasticidad result&oacute; con buena repetibilidad cuando la prueba se realiz&oacute; con la forma de probeta (0.94). Utilizando el textur&oacute;metro y la forma de muestra tipo probeta, los par&aacute;metros determinados muestran alto grado de confiabilidad y facilitan la comparaci&oacute;n de datos de textura para tortillas de ma&iacute;z.</P> <B>    <P ALIGN="JUSTIFY">Palabras clave</B>: Par&aacute;metros de calidad, confiabilidad, nixtamalizaci&oacute;n, repetibilidad.</P> <B>    <P ALIGN="JUSTIFY">SUMMARY</B>. <B>Evaluation of a methodology to determine texture characteristics of maize (<I>Zea mays </I>L<I>.</I>) tortilla. </B>Maize (<I>Zea mays L.</I>) tortilla is the primary staple food of the Mexican people, with annual consumption estimated at 12 millions tons. Despite this huge volume of consumption, tortillas are commercially produced with inconsistent quality, mainly in terms of texture characteristics. Different methods to evaluate the texture of maize tortillas have been reported, but the values obtained and their parameters have not yielded reliable results, largely because the methods used do not reflect homogeneous elements for comparison. In addition, evaluation of the reliability of methods for comparing tortilla texture as well as the equipment used has been difficult, as such information perhaps remains largely unpublished. In this study, the reliability of two tortilla sample shapes (rectangle and briquet) and some of the quality parameters (maximum force, total area under curve, area to reach maximum force, elasticity and elongation) from tensile and cut force tested with a texture meter were evaluated. According to the results, the briquet shape of the tortilla samples was better (than the rectangle shape) for determining tensile and elasticity. In regard to cutting force, both the rectangle and the briquet shape presented good repeatability. For tensile and cutting force curves, the maximum force was the parameter with the highest reliability, 0.95 and 0.99, respectively. The elasticity showed an adequate reliability with the tortilla briquet shape (0.94). The evaluated parameters with the texture meter and the sample shape type briquet, showed a high reliability degree what makes possible the comparison of maize tortilla texture data.</P> <B>    <P ALIGN="JUSTIFY">Key words</B>: Quality parameters, reliability, nixtamalization, repeatability.</P>      <P ALIGN="JUSTIFY"><b>Recibido:</b>04-09-2003&nbsp; <b>Aceptado:</b> 22-04-2004</P>      <P ALIGN="JUSTIFY"><B>INTRODUCCION</P> </B>    ]]></body>
<body><![CDATA[<P ALIGN="JUSTIFY">La tortilla de ma&iacute;z es el alimento m&aacute;s consumido en M&eacute;xico, y este se ha incrementado en los Estados Unidos de Am&eacute;rica y en parte de Am&eacute;rica Central. En zonas rurales de M&eacute;xico, la tortilla provee aproximadamente el 50% de las prote&iacute;nas, 70% de las calor&iacute;as y 49% del calcio consumido por la poblaci&oacute;n (1,2). En M&eacute;xico la tortilla forma parte de la dieta de todos los estratos sociales, con un consumo anual aproximado de 12 millones de toneladas (3).</P>     <P ALIGN="JUSTIFY">Aunque el consumo de este producto es alto, no existe homogeneidad en las caracter&iacute;sticas de calidad finales de las tortillas producidas comercialmente. Esta variabilidad se debe, en parte, a la falta de control de calidad, a la baja calidad del grano, a la utilizaci&oacute;n de equipo de proceso obsoleto y a la deficiencia en equipos/m&eacute;todos/t&eacute;cnicas probadas, para determinar objetivamente las caracter&iacute;sticas de textura de las tortillas.</P>     <P ALIGN="JUSTIFY">Algunos investigadores (4) reportaron la textura de la tortilla como la fuerza m&aacute;xima y el &aacute;rea total de la curva de tensi&oacute;n obtenida con el equipo Instron Universal, utilizando como muestra una tortilla completa, pero las conclusiones fueron hechas con base a un an&aacute;lisis sensorial desarrollado paralelamente. Bedolla y Rooney (5) utilizaron el t&eacute;rmino "rolabilidad", como una forma subjetiva de evaluar la textura de la tortilla. Esta prueba consisti&oacute; en enrollar una tortilla, en forma de taco, y medir el grado de rompimiento de acuerdo a una escala hed&oacute;nica de 3 puntos. Estos autores reportaron adem&aacute;s la fuerza m&aacute;xima a la tensi&oacute;n (ruptura) utilizando el equipo Instron Universal empleando una tortilla completa. Twillman y White (6) realizaron mediciones en masa y tortilla con el mismo tipo de equipo, utilizando la celda de corte de cuchillas m&uacute;ltiples Ag Canad&aacute;, reportando valores de fuerza m&aacute;xima al corte. Reyes et al. (7) utilizaron un accesorio similar empleando tres tortillas juntas, y reportaron la fuerza m&aacute;xima como una medida de textura.</P>     <P ALIGN="JUSTIFY">Otros autores (8,9,10) propusieron algunos m&eacute;todos y accesorios para medir textura de tortilla utilizando el textur&oacute;metro TA-XT2. Estos determinaron el trabajo requerido para romper la tortilla completa aplicando una fuerza de tensi&oacute;n, reportando el &aacute;rea bajo la curva, la fuerza m&aacute;xima requerida y la distancia hasta la ruptura. Flores-Far&iacute;as et al. (2) reportaron valores de fuerza m&aacute;xima a la tensi&oacute;n y al corte, para medir la textura de tortillas, utilizando el mismo instrumento con muestras de tortillas con forma rectangular.</P>     <P ALIGN="JUSTIFY">Aunque se encuentran publicadas investigaciones de mediciones de textura de tortillas, utilizando textur&oacute;metros (Instron Universal y Texture Analyzer), no se han reportado las evaluaciones de los m&eacute;todos utilizados, as&iacute; como tampoco de los par&aacute;metros de las curvas obtenidas, que demuestren el grado de confiabilidad y/o repetibilidad de las mediciones de calidad realizadas. Pruebas de calidad confiables, son aquellas que tienen exactitud, precisi&oacute;n y reproducibilidad para los prop&oacute;sitos de la medici&oacute;n. La exactitud es el grado de aproximaci&oacute;n de la medici&oacute;n al valor verdadero, que en el caso de los textur&oacute;metros est&aacute; determinada por la sensibilidad propia del equipo. La precisi&oacute;n o repetibilidad puede determinarse como una estimaci&oacute;n de la correlaci&oacute;n entre los valores verdaderos de las muestras y los valores observados (11). Tanto la exactitud como la precisi&oacute;n son afectadas principalmente por los procedimientos de prueba, la homogeneidad de la muestra y por el tipo de equipo utilizado para la prueba. La evaluaci&oacute;n de la confiabilidad de pruebas de calidad ha sido utilizada principalmente en la determinaci&oacute;n de m&eacute;todos y t&eacute;cnicas para evaluar los par&aacute;metros de calidad en granos y semillas de cereales (12-14), aunque su potencial de utilizaci&oacute;n ha sido comprobado en otros campos donde se realizan mediciones de este tipo.</P>     <P ALIGN="JUSTIFY">Para las tortillas de ma&iacute;z no se han reportado pruebas de calidad que estandaricen los valores reportados, ya que las mediciones que se han recomendado en la literatura (fuerza m&aacute;xima, &aacute;rea bajo la curva, distancia, etc.), son determinaciones realizadas con diferentes equipos, accesorios y condiciones, por lo que los resultados son muy variables. Se tiene reportado (2) la inexistencia de par&aacute;metros de procesamiento y de calidad estandarizados, de las harinas instant&aacute;neas para producir tortillas, entre las diferentes marcas comerciales existentes en M&eacute;xico, por lo que las caracter&iacute;sticas de las tortillas producidas presentan tambi&eacute;n alta variabilidad en su calidad. Adem&aacute;s, tampoco se tiene homogeneidad en los valores de los par&aacute;metros de calidad de la tortilla reportados, medidos con textur&oacute;metros, debido a que no se cuenta con m&eacute;todos oficiales de medici&oacute;n de la textura de las tortillas, que son necesarios para producir tortillas de buena calidad y especialmente de una calidad est&aacute;ndar.</P>     <P ALIGN="JUSTIFY">Con base a lo anterior, se consider&oacute; importante realizar esta investigaci&oacute;n tendiente a obtener informaci&oacute;n que permita definir la metodolog&iacute;a adecuada en t&eacute;rminos de precisi&oacute;n y repetibilidad, para estandarizar algunas determinaciones de las caracter&iacute;sticas de textura de las tortillas de ma&iacute;z.</P> <B>    <P ALIGN="left">MATERIALES Y METODOS</P>     <P ALIGN="JUSTIFY">Materiales</P> </B>    <P ALIGN="JUSTIFY">Se utilizaron lotes de 2kg de tortillas de ma&iacute;z nixtamalizado, reci&eacute;n elaboradas, producidas comercialmente a partir de harinas instant&aacute;neas comerciales solas o combinadas con masa fresca de nixtamal casero, de 40 tortiller&iacute;as de ciudades de la regi&oacute;n centro de M&eacute;xico, recolectadas en d&iacute;as diferentes.</P> <B>    ]]></body>
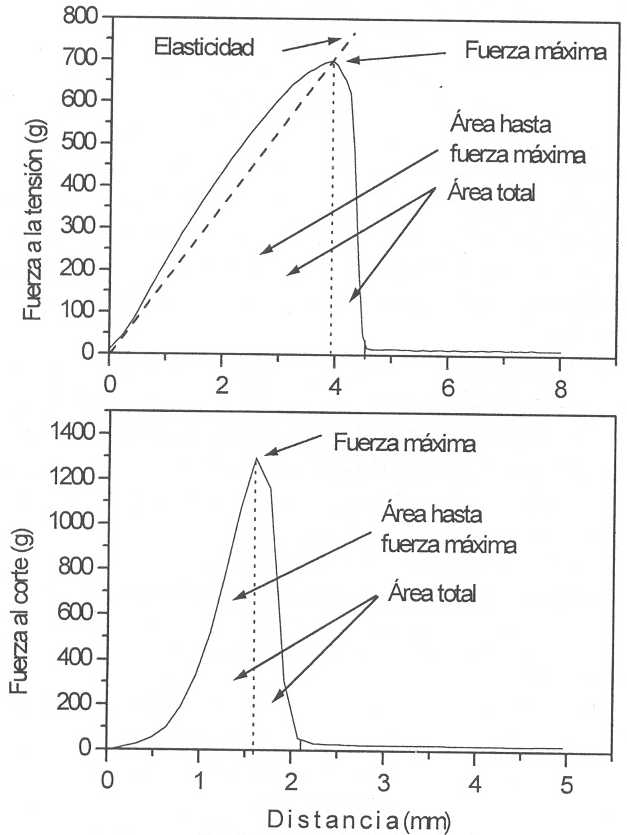
<body><![CDATA[<P ALIGN="JUSTIFY">M&eacute;todos</P>     <P ALIGN="JUSTIFY">Gr&aacute;ficos de fuerza de tensi&oacute;n y de corte obtenidas con el Texture Analyzer</P> </B>    <P ALIGN="JUSTIFY">En la <a href="#FIGURA 1"> Figura 1</a> se presentan las formas de las curvas que se obtienen al realizar pruebas de fuerza a la tensi&oacute;n y de corte con el equipo Texture Analyzer (modelo TA-XT2; Texture Technologies, Corp., Scarsdale, N.Y., USA./Stable Micro System, Godalming, Surrey, UK). De las dos gr&aacute;ficas se pueden determinar los siguientes par&aacute;metros: fuerza m&aacute;xima a la tensi&oacute;n o al corte, &aacute;rea total bajo la curva, &aacute;rea bajo la curva desde el punto cero hasta el punto m&aacute;ximo &oacute; de ruptura (&aacute;rea hasta fuerza m&aacute;xima), pendiente de la curva de tensi&oacute;n, desde el inicio hasta el punto de ruptura, la cual nos representa la elasticidad, y la elongaci&oacute;n, que es la distancia de estiramiento de la tortilla (curva de tensi&oacute;n) desde cero hasta el punto de ruptura o de fuerza m&aacute;xima.</P>     <P ALIGN="CENTER"><a name="FIGURA 1">FIGURA 1</a></P>     <P ALIGN="CENTER">Curvas t&iacute;picas de fuerza a la tensi&oacute;n y al corte de tortillas de ma&iacute;z, obtenidas con textur&oacute;metro</P> <B>    <P ALIGN="center"><img border="0" src="/img/fbpe/Alan/v54n2/Art12fig1.jpg" width="557" height="738" align="center">&nbsp;&nbsp;&nbsp;&nbsp;&nbsp;&nbsp;&nbsp;&nbsp;&nbsp;&nbsp;&nbsp;&nbsp;&nbsp;&nbsp;&nbsp;&nbsp;&nbsp;&nbsp;&nbsp;&nbsp;&nbsp;&nbsp;&nbsp;&nbsp;&nbsp;&nbsp;&nbsp;&nbsp;</P>     
<P ALIGN="JUSTIFY">Determinaci&oacute;n y evaluaci&oacute;n de la forma de la muestra</P> </B>    <P ALIGN="JUSTIFY">Se evaluaron dos formas de muestra de tortilla, rectangular y "probeta", para realizar las determinaciones de fuerza a la tensi&oacute;n y al corte utilizando el equipo Texture Analyzer TA-XT2, con las dimensiones se&ntilde;aladas en la <a href="#FIGURA 2"> Figura 2</a>. Las formas, rectangular (3,75 x 8,7 cm), y de "probeta" (3,75 cm en los extremos, 1,5 cm en la parte central y 8,7 de largo), fueron cortadas de la parte central de la tortilla, evitando los bordes.</P>     <P ALIGN="CENTER"><a name="FIGURA 2">FIGURA 2</a></P>     <P ALIGN="CENTER">Formas de las muestras para determinar fuerza a la tensi&oacute;n y corte de tortillas de ma&iacute;z</P> <B>    ]]></body>
<body><![CDATA[<P ALIGN="center"><img border="0" src="/img/fbpe/Alan/v54n2/Art12fig2.jpg" width="297" height="271"></P>     
<P ALIGN="JUSTIFY">Pruebas de textura de tortillas</P>     <P ALIGN="JUSTIFY">Rolabilidad</P> </B>    <P ALIGN="JUSTIFY">La rolabilidad de las tortillas se determin&oacute; usando el m&eacute;todo propuesto por Bedolla y Rooney (5). La tortilla completa se enroll&oacute; alrededor de una varilla de vidrio de 2 cm de di&aacute;metro, 30 min despu&eacute;s de elaborada y se midi&oacute; el grado de rompimiento. El grado de rompimiento de las tortillas se evalu&oacute; en forma subjetiva utilizando una escala del 1 al 5, donde 1 correspondi&oacute; a un rompimiento de 0%, 2, a un rompimiento de 1 a 25%, 3, de 26 a 50%, 4, de 51 a 75% y 5 desde 76 a 100% de rompimiento de la longitud de la tortilla. Se realizaron tres mediciones de cada lote de tortillas. Para el resto de las mediciones, las tortillas se guardaron, a temperatura ambiente, dentro de bolsas de polietileno selladas hasta su utilizaci&oacute;n.</P> <B>    <P ALIGN="JUSTIFY">Fuerza a la tensi&oacute;n</P> </B>    <P ALIGN="JUSTIFY">Para determinar la fuerza a la tensi&oacute;n se cort&oacute; una pieza, con cada forma a evaluar (rectangular y probeta), de la parte central de la tortilla, evitando los bordes. Las dimensiones de la pieza son las se&ntilde;aladas en la <a href="#FIGURA 2"> Figura 2</a>. La prueba de tensi&oacute;n se obtuvo utilizando el equipo Texture Analyzer TA-XT2, con el accesorio TA-65. Este accesorio consiste en unas pinzas de retenci&oacute;n en las que se coloc&oacute; la pieza de tortilla y se someti&oacute; a tensi&oacute;n hasta lograr el rompimiento. De la curva resultante se determin&oacute; la fuerza m&aacute;xima a la ruptura, el &aacute;rea total bajo la curva, y el &aacute;rea bajo la curva hasta el punto de ruptura de la tortilla. Las condiciones de prueba fueron: velocidad 2 mm/s, distancia de tensi&oacute;n, 15 mm. Atendiendo a las dimensiones de las formas de las muestras y de las tortillas se realizaron dos mediciones de cada tortilla. Se evaluaron cinco tortillas, tomadas al azar, de cada lote.</P> <B>    <P ALIGN="JUSTIFY">Elasticidad y elongaci&oacute;n</P> </B>    <P ALIGN="JUSTIFY">La pendiente de la curva de fuerza a la tensi&oacute;n, desde el inicio hasta el punto de ruptura de la tortilla fue considerada como la elasticidad de la misma (<a href="#FIGURA 1">Figura 1</a>). La elongaci&oacute;n de la tortilla fue considerada como la distancia desde el inicio de la prueba hasta el punto de rompimiento de la tortilla. Las condiciones de prueba fueron: velocidad 2 mm/s, distancia de tensi&oacute;n, 15 mm. Se realizaron dos mediciones de cada tortilla. De cada lote en estudio, se evaluaron cinco tortillas con cada forma propuesta.</P> <B>    <P ALIGN="JUSTIFY">Fuerza al corte</P> </B>    <P ALIGN="JUSTIFY">Para las determinaciones de fuerza al corte se utiliz&oacute; el mismo equipo utilizado para determinar la fuerza a la tensi&oacute;n, con el accesorio TA-34, el cual es una cuchilla plana de 10 cm de largo por 4 mm de ancho. Para esta prueba se utilizaron las mismas piezas de tortillas utilizadas en las pruebas de tensi&oacute;n, realizando el corte en forma transversal, en la parte central de la tortilla. De la curva resultante se determin&oacute; la fuerza m&aacute;xima a la ruptura, el &aacute;rea total bajo la curva y el &aacute;rea bajo la curva hasta el punto de ruptura (ver <a href="#FIGURA 1"> Figura 1</a>). Las condiciones para esta prueba fueron: velocidad 2 mm/s, distancia de compresi&oacute;n, 15 mm. De cada lote se evaluaron cinco tortillas, tomadas en forma aleatoria, y se realizaron cuatro mediciones en cada tortilla (dos de cada forma utilizada para fuerza a la tensi&oacute;n).</P> <B>    ]]></body>
<body><![CDATA[<P ALIGN="JUSTIFY">Repetibilidad de los par&aacute;metros de las curvas de fuerza de tensi&oacute;n y de corte</P> </B>    <P ALIGN="JUSTIFY">El estudio de la repetibilidad de las pruebas de calidad se hizo utilizando el m&eacute;todo reportado por De la Roche y Fowler (12). Este m&eacute;todo se basa en estimaciones de varianza (Repetibilidad = varianza de la variable / varianza de la variable + varianza del error experimental), estableciendo que valores superiores a 0.90 son adecuados para una prueba confiable.</P> <B>    <P ALIGN="JUSTIFY">An&aacute;lisis estad&iacute;stico</P> </B>    <P ALIGN="JUSTIFY">Para el presente estudio se utiliz&oacute; un sistema de una v&iacute;a. El an&aacute;lisis de datos para obtener las medias, desviaciones est&aacute;ndar y para la selecci&oacute;n de los par&aacute;metros de textura para las tortillas, se realiz&oacute; utilizando el paquete estad&iacute;stico SAS (15).</P> <B>    <P ALIGN="left">RESULTADOS Y DISCUSION</P>     <P ALIGN="JUSTIFY">Evaluaci&oacute;n y selecci&oacute;n de las formas de la muestra</P> </B>    <P ALIGN="JUSTIFY">Al someter a tensi&oacute;n una pieza de tortilla con forma rectangular (<a href="#FIGURA 2">Figura 2</a>), utilizando el textur&oacute;metro, &eacute;sta se sujet&oacute; por cada extremo con dos placas (pinzas de retenci&oacute;n, accesorio TA-65) que la presionaron. Estas partes presionadas tendieron a debilitarse, y al someterlas a tensi&oacute;n se cortaron generalmente al nivel de las orillas de las placas de presi&oacute;n, originando una gran variabilidad en las mediciones. Este comportamiento se observ&oacute; al comparar el valor de la desviaci&oacute;n est&aacute;ndar de todos los par&aacute;metros en la <a href="#TABLA 1"> Tabla 1</a>. Los valores de los par&aacute;metros de la forma rectangular presentaron mayores valores de desviaci&oacute;n est&aacute;ndar que los obtenidos con la forma de probeta.</P>     <P ALIGN="CENTER"><a name="TABLA 1">TABLA 1</a></P>     <P ALIGN="CENTER">Repetibilidad de par&aacute;metros de tensi&oacute;n de tortillas utilizando diferentes formas de muestra</P>     <P ALIGN="CENTER">    ]]></body>
<body><![CDATA[<CENTER><TABLE BORDER="1" CELLSPACING=1 CELLPADDING=4 WIDTH=565> <TR><TD WIDTH="183" VALIGN="TOP">     <P ALIGN="JUSTIFY"><FONT SIZE=2>Par&aacute;metro</FONT></TD> <TD WIDTH="42" VALIGN="TOP"> <FONT SIZE=2>    <P ALIGN="CENTER">M&iacute;nimo</FONT></TD> <TD WIDTH="54" VALIGN="TOP"> <FONT SIZE=2>    <P ALIGN="CENTER">M&aacute;ximo</FONT></TD> <TD WIDTH="36" VALIGN="TOP"> <FONT SIZE=2>    <P ALIGN="CENTER">Media</FONT></TD> <TD WIDTH="36" VALIGN="TOP"> <FONT SIZE=2>    <P ALIGN="CENTER">D.S.<SUP>a</SUP></FONT></TD> <TD WIDTH="35" VALIGN="TOP"> <FONT SIZE=2>    <P ALIGN="CENTER">C.V<SUP>. b</SUP></FONT></TD> <TD WIDTH="35" VALIGN="TOP"> <FONT SIZE=2>    <P ALIGN="CENTER">R2 <SUP>c</SUP></FONT></TD> <TD WIDTH="76" VALIGN="TOP"> <FONT SIZE=2>    <P ALIGN="CENTER">Repeti-bilidad</FONT></TD> </TR> <TR><TD WIDTH="183" VALIGN="TOP"> <FONT SIZE=2>    <P ALIGN="JUSTIFY">Forma rectangular</FONT></TD> <TD WIDTH="42" VALIGN="TOP">     ]]></body>
<body><![CDATA[<P>&nbsp;</TD> <TD WIDTH="54" VALIGN="TOP">     <P>&nbsp;</TD> <TD WIDTH="36" VALIGN="TOP">     <P>&nbsp;</TD> <TD WIDTH="36" VALIGN="TOP">     <P>&nbsp;</TD> <TD WIDTH="35" VALIGN="TOP">     <P>&nbsp;</TD> <TD WIDTH="35" VALIGN="TOP">     <P>&nbsp;</TD> <TD WIDTH="76" VALIGN="TOP">     <P>&nbsp;</TD> </TR> <TR><TD WIDTH="183" VALIGN="TOP"> <FONT SIZE=2>    <P ALIGN="JUSTIFY">Fuerza m&aacute;xima (g)</FONT></TD> <TD WIDTH="42" VALIGN="TOP"> <FONT SIZE=2>    <P ALIGN="CENTER">99</FONT></TD> <TD WIDTH="54" VALIGN="TOP"> <FONT SIZE=2>    <P ALIGN="CENTER">638</FONT></TD> <TD WIDTH="36" VALIGN="TOP"> <FONT SIZE=2>    ]]></body>
<body><![CDATA[<P ALIGN="CENTER">311</FONT></TD> <TD WIDTH="36" VALIGN="TOP"> <FONT SIZE=2>    <P ALIGN="CENTER">145</FONT></TD> <TD WIDTH="35" VALIGN="TOP"> <FONT SIZE=2>    <P ALIGN="CENTER">16,43</FONT></TD> <TD WIDTH="35" VALIGN="TOP"> <FONT SIZE=2>    <P ALIGN="CENTER">0,91</FONT></TD> <TD WIDTH="76" VALIGN="TOP"> <FONT SIZE=2>    <P ALIGN="CENTER">0,8897</FONT></TD> </TR> <TR><TD WIDTH="183" VALIGN="TOP"> <FONT SIZE=2>    <P ALIGN="JUSTIFY">&Aacute;rea total (g-mm)</FONT></TD> <TD WIDTH="42" VALIGN="TOP"> <FONT SIZE=2>    <P ALIGN="CENTER">506</FONT></TD> <TD WIDTH="54" VALIGN="TOP"> <FONT SIZE=2>    <P ALIGN="CENTER">8.146</FONT></TD> <TD WIDTH="36" VALIGN="TOP"> <FONT SIZE=2>    <P ALIGN="CENTER">2.198</FONT></TD> <TD WIDTH="36" VALIGN="TOP"> <FONT SIZE=2>    <P ALIGN="CENTER">1.820</FONT></TD> <TD WIDTH="35" VALIGN="TOP"> <FONT SIZE=2>    ]]></body>
<body><![CDATA[<P ALIGN="CENTER">34,73</FONT></TD> <TD WIDTH="35" VALIGN="TOP"> <FONT SIZE=2>    <P ALIGN="CENTER">0,88</FONT></TD> <TD WIDTH="76" VALIGN="TOP"> <FONT SIZE=2>    <P ALIGN="CENTER">0,8500</FONT></TD> </TR> <TR><TD WIDTH="183" VALIGN="TOP"> <FONT SIZE=2>    <P ALIGN="JUSTIFY">&Aacute;rea hasta fuerza m&aacute;xima (g-mm)</FONT></TD> <TD WIDTH="42" VALIGN="TOP"> <FONT SIZE=2>    <P ALIGN="CENTER">282</FONT></TD> <TD WIDTH="54" VALIGN="TOP"> <FONT SIZE=2>    <P ALIGN="CENTER">5.726</FONT></TD> <TD WIDTH="36" VALIGN="TOP"> <FONT SIZE=2>    <P ALIGN="CENTER">1.686</FONT></TD> <TD WIDTH="36" VALIGN="TOP"> <FONT SIZE=2>    <P ALIGN="CENTER">1.394</FONT></TD> <TD WIDTH="35" VALIGN="TOP"> <FONT SIZE=2>    <P ALIGN="CENTER">34,69</FONT></TD> <TD WIDTH="35" VALIGN="TOP"> <FONT SIZE=2>    <P ALIGN="CENTER">0,88</FONT></TD> <TD WIDTH="76" VALIGN="TOP"> <FONT SIZE=2>    ]]></body>
<body><![CDATA[<P ALIGN="CENTER">0,8501</FONT></TD> </TR> <TR><TD WIDTH="183" VALIGN="TOP"> <FONT SIZE=2>    <P ALIGN="JUSTIFY">Forma probeta</FONT></TD> <TD WIDTH="42" VALIGN="TOP">     <P>&nbsp;</TD> <TD WIDTH="54" VALIGN="TOP">     <P>&nbsp;</TD> <TD WIDTH="36" VALIGN="TOP">     <P>&nbsp;</TD> <TD WIDTH="36" VALIGN="TOP">     <P>&nbsp;</TD> <TD WIDTH="35" VALIGN="TOP">     <P>&nbsp;</TD> <TD WIDTH="35" VALIGN="TOP">     <P>&nbsp;</TD> <TD WIDTH="76" VALIGN="TOP">     <P>&nbsp;</TD> </TR> <TR><TD WIDTH="183" VALIGN="TOP" HEIGHT=13> <FONT SIZE=2>    <P ALIGN="JUSTIFY">Fuerza m&aacute;xima(g)</FONT></TD> <TD WIDTH="42" VALIGN="TOP" HEIGHT=13> <FONT SIZE=2>    ]]></body>
<body><![CDATA[<P ALIGN="CENTER">52</FONT></TD> <TD WIDTH="54" VALIGN="TOP" HEIGHT=13> <FONT SIZE=2>    <P ALIGN="CENTER">356</FONT></TD> <TD WIDTH="36" VALIGN="TOP" HEIGHT=13> <FONT SIZE=2>    <P ALIGN="CENTER">152</FONT></TD> <TD WIDTH="36" VALIGN="TOP" HEIGHT=13> <FONT SIZE=2>    <P ALIGN="CENTER">77</FONT></TD> <TD WIDTH="35" VALIGN="TOP" HEIGHT=13> <FONT SIZE=2>    <P ALIGN="CENTER">21,08</FONT></TD> <TD WIDTH="35" VALIGN="TOP" HEIGHT=13> <FONT SIZE=2>    <P ALIGN="CENTER">87,93</FONT></TD> <TD WIDTH="76" VALIGN="TOP" HEIGHT=13> <FONT SIZE=2>    <P ALIGN="CENTER">0,9511</FONT></TD> </TR> <TR><TD WIDTH="183" VALIGN="TOP"> <FONT SIZE=2>    <P ALIGN="JUSTIFY">&Aacute;rea total (g-mm)</FONT></TD> <TD WIDTH="42" VALIGN="TOP"> <FONT SIZE=2>    <P ALIGN="CENTER">244</FONT></TD> <TD WIDTH="54" VALIGN="TOP"> <FONT SIZE=2>    <P ALIGN="CENTER">3.446</FONT></TD> <TD WIDTH="36" VALIGN="TOP"> <FONT SIZE=2>    ]]></body>
<body><![CDATA[<P ALIGN="CENTER">968</FONT></TD> <TD WIDTH="36" VALIGN="TOP"> <FONT SIZE=2>    <P ALIGN="CENTER">770</FONT></TD> <TD WIDTH="35" VALIGN="TOP"> <FONT SIZE=2>    <P ALIGN="CENTER">28,80</FONT></TD> <TD WIDTH="35" VALIGN="TOP"> <FONT SIZE=2>    <P ALIGN="CENTER">90,98</FONT></TD> <TD WIDTH="76" VALIGN="TOP"> <FONT SIZE=2>    <P ALIGN="CENTER">0,9844</FONT></TD> </TR> <TR><TD WIDTH="183" VALIGN="TOP"> <FONT SIZE=2>    <P ALIGN="JUSTIFY">&Aacute;rea hasta fuerza m&aacute;xima (g-mm)</FONT></TD> <TD WIDTH="42" VALIGN="TOP"> <FONT SIZE=2>    <P ALIGN="CENTER">150</FONT></TD> <TD WIDTH="54" VALIGN="TOP"> <FONT SIZE=2>    <P ALIGN="CENTER">2.818</FONT></TD> <TD WIDTH="36" VALIGN="TOP"> <FONT SIZE=2>    <P ALIGN="CENTER">742</FONT></TD> <TD WIDTH="36" VALIGN="TOP"> <FONT SIZE=2>    <P ALIGN="CENTER">618</FONT></TD> <TD WIDTH="35" VALIGN="TOP"> <FONT SIZE=2>    ]]></body>
<body><![CDATA[<P ALIGN="CENTER">33,24</FONT></TD> <TD WIDTH="35" VALIGN="TOP"> <FONT SIZE=2>    <P ALIGN="CENTER">88,98</FONT></TD> <TD WIDTH="76" VALIGN="TOP"> <FONT SIZE=2>    <P ALIGN="CENTER">0,9623</FONT></TD> </TR> </TABLE> </CENTER>      <P ALIGN="JUSTIFY"><font size="3">Valores obtenidos de 2 mediciones/tortilla, 5 tortillas/ lote, 40 lotes y 1 repetici&oacute;n/lote.</font> </P> <B>    <P ALIGN="JUSTIFY"><font size="3"><sup>a</sup></font></B> <font size="3"> D.S. Desviaci&oacute;n est&aacute;ndar.</font></P> <B>    <P ALIGN="JUSTIFY"><font size="3"><sup>b</sup></font></B> <font size="3"> C.V. Coeficiente de variaci&oacute;n.</font></P> <B>    <P ALIGN="JUSTIFY"><font size="3"><sup>c</sup></font></B> <font size="3"> R<sup>2</sup> Proporci&oacute;n de la variabilidad de los datos.</font></P>     <P ALIGN="JUSTIFY">Para solucionar este problema y obtener mediciones confiables se seleccion&oacute; la forma denominada "probeta" (I), ya que en esta forma, los extremos, que est&aacute;n sometidos a presi&oacute;n, tienen mayor resistencia. La forma de probeta tiene en los extremos 2,5 veces el ancho que la parte media. Al utilizar esta forma (probeta), el material siempre se cort&oacute; por la parte m&aacute;s delgada al someterla a tensi&oacute;n, por lo que la medici&oacute;n se realiz&oacute; de una manera repetible. Lo anterior se puede observar al analizar las<a href="#TABLA 1"> Tablas 1</a> y <a href="#TABLA 2">2</a>, donde se tienen los valores para las mismas pruebas utilizando las dos formas estudiadas. En general la repetibilidad fue m&aacute;s alta para las mediciones realizadas con las muestras con forma de probeta. </P>     <P ALIGN="CENTER"><a name="TABLA 2">TABLA 2</a></P>     <P ALIGN="CENTER">Repetibilidad de par&aacute;metros de corte de tortillas utilizando diferentes formas de muestra</P>     ]]></body>
<body><![CDATA[<P ALIGN="CENTER">    <CENTER><TABLE BORDER="1" CELLSPACING=1 CELLPADDING=4 WIDTH=560> <TR><TD WIDTH="183" VALIGN="TOP">     <P ALIGN="JUSTIFY"><FONT SIZE=2>Par&aacute;metro</FONT></TD> <TD WIDTH="42" VALIGN="TOP"> <FONT SIZE=2>    <P ALIGN="CENTER">M&iacute;nimo</FONT></TD> <TD WIDTH="54" VALIGN="TOP"> <FONT SIZE=2>    <P ALIGN="CENTER">M&aacute;ximo</FONT></TD> <TD WIDTH="36" VALIGN="TOP"> <FONT SIZE=2>    <P ALIGN="CENTER">Media</FONT></TD> <TD WIDTH="36" VALIGN="TOP"> <FONT SIZE=2>    <P ALIGN="CENTER">D.S.<SUP>a</SUP></FONT></TD> <TD WIDTH="35" VALIGN="TOP"> <FONT SIZE=2>    <P ALIGN="CENTER">C.V<SUP>. b</SUP></FONT></TD> <TD WIDTH="35" VALIGN="TOP"> <FONT SIZE=2>    <P ALIGN="CENTER">R2 <SUP>c</SUP></FONT></TD> <TD WIDTH="76" VALIGN="TOP"> <FONT SIZE=2>    <P ALIGN="CENTER">Repeti-bilidad</FONT></TD> </TR> <TR><TD WIDTH="183" VALIGN="TOP"> <FONT SIZE=2>    ]]></body>
<body><![CDATA[<P ALIGN="JUSTIFY">Forma rectangular</FONT></TD> <TD WIDTH="42" VALIGN="TOP">     <P>&nbsp;</TD> <TD WIDTH="54" VALIGN="TOP">     <P>&nbsp;</TD> <TD WIDTH="36" VALIGN="TOP">     <P>&nbsp;</TD> <TD WIDTH="36" VALIGN="TOP">     <P>&nbsp;</TD> <TD WIDTH="35" VALIGN="TOP">     <P>&nbsp;</TD> <TD WIDTH="35" VALIGN="TOP">     <P>&nbsp;</TD> <TD WIDTH="76" VALIGN="TOP">     <P>&nbsp;</TD> </TR> <TR><TD WIDTH="183" VALIGN="TOP"> <FONT SIZE=2>    <P ALIGN="JUSTIFY">Fuerza m&aacute;xima (g) </FONT></TD> <TD WIDTH="42" VALIGN="TOP"> <FONT SIZE=2>    <P ALIGN="CENTER">689</FONT></TD> <TD WIDTH="54" VALIGN="TOP"> <FONT SIZE=2>    ]]></body>
<body><![CDATA[<P ALIGN="CENTER">3.370</FONT></TD> <TD WIDTH="36" VALIGN="TOP"> <FONT SIZE=2>    <P ALIGN="CENTER">1.751</FONT></TD> <TD WIDTH="36" VALIGN="TOP"> <FONT SIZE=2>    <P ALIGN="CENTER">844</FONT></TD> <TD WIDTH="35" VALIGN="TOP"> <FONT SIZE=2>    <P ALIGN="CENTER">16,64</FONT></TD> <TD WIDTH="35" VALIGN="TOP"> <FONT SIZE=2>    <P ALIGN="CENTER">0,92</FONT></TD> <TD WIDTH="76" VALIGN="TOP"> <FONT SIZE=2>    <P ALIGN="CENTER">0,9934</FONT></TD> </TR> <TR><TD WIDTH="183" VALIGN="TOP"> <FONT SIZE=2>    <P ALIGN="JUSTIFY">&Aacute;rea total (g-mm)</FONT></TD> <TD WIDTH="42" VALIGN="TOP"> <FONT SIZE=2>    <P ALIGN="CENTER">794</FONT></TD> <TD WIDTH="54" VALIGN="TOP"> <FONT SIZE=2>    <P ALIGN="CENTER">3.284</FONT></TD> <TD WIDTH="36" VALIGN="TOP"> <FONT SIZE=2>    <P ALIGN="CENTER">1.840</FONT></TD> <TD WIDTH="36" VALIGN="TOP"> <FONT SIZE=2>    ]]></body>
<body><![CDATA[<P ALIGN="CENTER">814</FONT></TD> <TD WIDTH="35" VALIGN="TOP"> <FONT SIZE=2>    <P ALIGN="CENTER">17,75</FONT></TD> <TD WIDTH="35" VALIGN="TOP"> <FONT SIZE=2>    <P ALIGN="CENTER">0,89</FONT></TD> <TD WIDTH="76" VALIGN="TOP"> <FONT SIZE=2>    <P ALIGN="CENTER">0,9616</FONT></TD> </TR> <TR><TD WIDTH="183" VALIGN="TOP"> <FONT SIZE=2>    <P ALIGN="JUSTIFY">&Aacute;rea hasta fuerza m&aacute;xima (g-mm)</FONT></TD> <TD WIDTH="42" VALIGN="TOP"> <FONT SIZE=2>    <P ALIGN="CENTER">476</FONT></TD> <TD WIDTH="54" VALIGN="TOP"> <FONT SIZE=2>    <P ALIGN="CENTER">2.140</FONT></TD> <TD WIDTH="36" VALIGN="TOP"> <FONT SIZE=2>    <P ALIGN="CENTER">1.122</FONT></TD> <TD WIDTH="36" VALIGN="TOP"> <FONT SIZE=2>    <P ALIGN="CENTER">524</FONT></TD> <TD WIDTH="35" VALIGN="TOP"> <FONT SIZE=2>    <P ALIGN="CENTER">16,14</FONT></TD> <TD WIDTH="35" VALIGN="TOP"> <FONT SIZE=2>    ]]></body>
<body><![CDATA[<P ALIGN="CENTER">0,92</FONT></TD> <TD WIDTH="76" VALIGN="TOP"> <FONT SIZE=2>    <P ALIGN="CENTER">0,9036</FONT></TD> </TR> <TR><TD WIDTH="183" VALIGN="TOP"> <FONT SIZE=2>    <P ALIGN="JUSTIFY">Forma probeta</FONT></TD> <TD WIDTH="42" VALIGN="TOP">     <P>&nbsp;</TD> <TD WIDTH="54" VALIGN="TOP">     <P>&nbsp;</TD> <TD WIDTH="36" VALIGN="TOP">     <P>&nbsp;</TD> <TD WIDTH="36" VALIGN="TOP">     <P>&nbsp;</TD> <TD WIDTH="35" VALIGN="TOP">     <P>&nbsp;</TD> <TD WIDTH="35" VALIGN="TOP">     <P>&nbsp;</TD> <TD WIDTH="76" VALIGN="TOP">     <P>&nbsp;</TD> </TR> <TR><TD WIDTH="183" VALIGN="TOP" HEIGHT=13> <FONT SIZE=2>    ]]></body>
<body><![CDATA[<P ALIGN="JUSTIFY">Fuerza m&aacute;xima (g) </FONT></TD> <TD WIDTH="42" VALIGN="TOP" HEIGHT=13> <FONT SIZE=2>    <P ALIGN="CENTER">337</FONT></TD> <TD WIDTH="54" VALIGN="TOP" HEIGHT=13> <FONT SIZE=2>    <P ALIGN="CENTER">1.749</FONT></TD> <TD WIDTH="36" VALIGN="TOP" HEIGHT=13> <FONT SIZE=2>    <P ALIGN="CENTER">881</FONT></TD> <TD WIDTH="36" VALIGN="TOP" HEIGHT=13> <FONT SIZE=2>    <P ALIGN="CENTER">424</FONT></TD> <TD WIDTH="35" VALIGN="TOP" HEIGHT=13> <FONT SIZE=2>    <P ALIGN="CENTER">16,49</FONT></TD> <TD WIDTH="35" VALIGN="TOP" HEIGHT=13> <FONT SIZE=2>    <P ALIGN="CENTER">0,92</FONT></TD> <TD WIDTH="76" VALIGN="TOP" HEIGHT=13> <FONT SIZE=2>    <P ALIGN="CENTER">0,9952</FONT></TD> </TR> <TR><TD WIDTH="183" VALIGN="TOP"> <FONT SIZE=2>    <P ALIGN="JUSTIFY">&Aacute;rea total (g-mm)</FONT></TD> <TD WIDTH="42" VALIGN="TOP"> <FONT SIZE=2>    <P ALIGN="CENTER">376</FONT></TD> <TD WIDTH="54" VALIGN="TOP"> <FONT SIZE=2>    ]]></body>
<body><![CDATA[<P ALIGN="CENTER">1.652</FONT></TD> <TD WIDTH="36" VALIGN="TOP"> <FONT SIZE=2>    <P ALIGN="CENTER">870</FONT></TD> <TD WIDTH="36" VALIGN="TOP"> <FONT SIZE=2>    <P ALIGN="CENTER">370</FONT></TD> <TD WIDTH="35" VALIGN="TOP"> <FONT SIZE=2>    <P ALIGN="CENTER">17,15</FONT></TD> <TD WIDTH="35" VALIGN="TOP"> <FONT SIZE=2>    <P ALIGN="CENTER">0,89</FONT></TD> <TD WIDTH="76" VALIGN="TOP"> <FONT SIZE=2>    <P ALIGN="CENTER">0,9604</FONT></TD> </TR> <TR><TD WIDTH="183" VALIGN="TOP"> <FONT SIZE=2>    <P ALIGN="JUSTIFY">&Aacute;rea hasta fuerza m&aacute;xima (g-mm)</FONT></TD> <TD WIDTH="42" VALIGN="TOP"> <FONT SIZE=2>    <P ALIGN="CENTER">230</FONT></TD> <TD WIDTH="54" VALIGN="TOP"> <FONT SIZE=2>    <P ALIGN="CENTER">1.848</FONT></TD> <TD WIDTH="36" VALIGN="TOP"> <FONT SIZE=2>    <P ALIGN="CENTER">614</FONT></TD> <TD WIDTH="36" VALIGN="TOP"> <FONT SIZE=2>    ]]></body>
<body><![CDATA[<P ALIGN="CENTER">430</FONT></TD> <TD WIDTH="35" VALIGN="TOP"> <FONT SIZE=2>    <P ALIGN="CENTER">33,99</FONT></TD> <TD WIDTH="35" VALIGN="TOP"> <FONT SIZE=2>    <P ALIGN="CENTER">0,84</FONT></TD> <TD WIDTH="76" VALIGN="TOP"> <FONT SIZE=2>    <P ALIGN="CENTER">0,9087</FONT></TD> </TR> </TABLE> </CENTER>      <P ALIGN="JUSTIFY"><font size="3">Valores obtenidos de 4 mediciones/tortilla, 5 tortillas/lote, 40 lotes y 1 repetici&oacute;n/lote.</font> </P> <B>    <P ALIGN="JUSTIFY"><font size="3"><sup>a</sup></font></B> <font size="3"> D.S. Desviaci&oacute;n est&aacute;ndar.</font></P> <B>    <P ALIGN="JUSTIFY"><font size="3"><sup>b</sup></font></B> <font size="3"> C.V. Coeficiente de variaci&oacute;n.</font></P> <B>    <P ALIGN="JUSTIFY"><font size="3"><sup>c</sup></font></B> <font size="3"> R<sup>2</sup> Proporci&oacute;n de la variabilidad de los datos.</font></P> <B>    <P ALIGN="JUSTIFY">Repetibilidad de pruebas y par&aacute;metros</P> </B>    <P ALIGN="JUSTIFY">Todas las tortillas presentaron buena rolabilidad (valores no mostrados por ser iguales) con calificaci&oacute;n de 1, no se rompen, por lo que la repetibilidad fue m&aacute;xima para este par&aacute;metro. Aunque la rolabilidad present&oacute; la m&aacute;xima repetibilidad, esta prueba no result&oacute; adecuada para expresar la textura de la tortilla, ya que no se detectaron diferencias, las cuales s&iacute; fueron determinadas al utilizar el textur&oacute;metro como se demuestra en las <a href="#TABLA 1"> Tablas 1</a> a <a href="#TABLA 3">3</a>, aqu&iacute; reportados. Este par&aacute;metro de rolabilidad es demasiado subjetivo, y no es adecuado para medir caracter&iacute;sticas de textura de las tortillas.</P>     ]]></body>
<body><![CDATA[<P ALIGN="CENTER"><a name="TABLA 3">TABLA 3</a></P>     <P ALIGN="CENTER">Repetibilidad de elasticidad y elongaci&oacute;n de tortillas utilizando diferentes formas de muestra</P>     <P ALIGN="CENTER">    <CENTER><TABLE BORDER="1" CELLSPACING=1 CELLPADDING=4 WIDTH=554> <TR><TD WIDTH="183" VALIGN="TOP">     <P ALIGN="JUSTIFY"><FONT SIZE=2>Par&aacute;metro</FONT></TD> <TD WIDTH="42" VALIGN="TOP"> <FONT SIZE=2>    <P ALIGN="CENTER">M&iacute;nimo</FONT></TD> <TD WIDTH="54" VALIGN="TOP"> <FONT SIZE=2>    <P ALIGN="CENTER">M&aacute;ximo</FONT></TD> <TD WIDTH="36" VALIGN="TOP"> <FONT SIZE=2>    <P ALIGN="CENTER">Media</FONT></TD> <TD WIDTH="36" VALIGN="TOP"> <FONT SIZE=2>    <P ALIGN="CENTER">D.S.<SUP>a</SUP></FONT></TD> <TD WIDTH="35" VALIGN="TOP"> <FONT SIZE=2>    <P ALIGN="CENTER">C.V<SUP>. b</SUP></FONT></TD> <TD WIDTH="35" VALIGN="TOP"> <FONT SIZE=2>    ]]></body>
<body><![CDATA[<P ALIGN="CENTER">R2 <SUP>c</SUP></FONT></TD> <TD WIDTH="76" VALIGN="TOP"> <FONT SIZE=2>    <P ALIGN="CENTER">Repeti-bilidad</FONT></TD> </TR> <TR><TD WIDTH="183" VALIGN="TOP"> <FONT SIZE=2>    <P ALIGN="JUSTIFY">Forma rectangular</FONT></TD> <TD WIDTH="42" VALIGN="TOP">     <P>&nbsp;</TD> <TD WIDTH="54" VALIGN="TOP">     <P>&nbsp;</TD> <TD WIDTH="36" VALIGN="TOP">     <P>&nbsp;</TD> <TD WIDTH="36" VALIGN="TOP">     <P>&nbsp;</TD> <TD WIDTH="35" VALIGN="TOP">     <P>&nbsp;</TD> <TD WIDTH="35" VALIGN="TOP">     <P>&nbsp;</TD> <TD WIDTH="76" VALIGN="TOP">     <P>&nbsp;</TD> </TR> <TR><TD WIDTH="183" VALIGN="TOP"> <FONT SIZE=2>    ]]></body>
<body><![CDATA[<P ALIGN="JUSTIFY">Elasticidad(g / mm) </FONT></TD> <TD WIDTH="42" VALIGN="TOP"> <FONT SIZE=2>    <P ALIGN="JUSTIFY">15</FONT></TD> <TD WIDTH="54" VALIGN="TOP"> <FONT SIZE=2>    <P ALIGN="JUSTIFY">108</FONT></TD> <TD WIDTH="36" VALIGN="TOP"> <FONT SIZE=2>    <P ALIGN="JUSTIFY">041</FONT></TD> <TD WIDTH="36" VALIGN="TOP"> <FONT SIZE=2>    <P ALIGN="JUSTIFY">21</FONT></TD> <TD WIDTH="35" VALIGN="TOP"> <FONT SIZE=2>    <P ALIGN="JUSTIFY">23,05</FONT></TD> <TD WIDTH="35" VALIGN="TOP"> <FONT SIZE=2>    <P ALIGN="JUSTIFY">0,85</FONT></TD> <TD WIDTH="76" VALIGN="TOP"> <FONT SIZE=2>    <P ALIGN="JUSTIFY">0,8223</FONT></TD> </TR> <TR><TD WIDTH="183" VALIGN="TOP"> <FONT SIZE=2>    <P ALIGN="JUSTIFY">Elongaci&oacute;n (mm)</FONT></TD> <TD WIDTH="42" VALIGN="TOP"> <FONT SIZE=2>    <P ALIGN="JUSTIFY">2,93</FONT></TD> <TD WIDTH="54" VALIGN="TOP"> <FONT SIZE=2>    ]]></body>
<body><![CDATA[<P ALIGN="JUSTIFY">10,1</FONT></TD> <TD WIDTH="36" VALIGN="TOP"> <FONT SIZE=2>    <P ALIGN="JUSTIFY">5,4</FONT></TD> <TD WIDTH="36" VALIGN="TOP"> <FONT SIZE=2>    <P ALIGN="JUSTIFY">2,182</FONT></TD> <TD WIDTH="35" VALIGN="TOP"> <FONT SIZE=2>    <P ALIGN="JUSTIFY">18,02</FONT></TD> <TD WIDTH="35" VALIGN="TOP"> <FONT SIZE=2>    <P ALIGN="JUSTIFY">0,86</FONT></TD> <TD WIDTH="76" VALIGN="TOP"> <FONT SIZE=2>    <P ALIGN="JUSTIFY">0,8251</FONT></TD> </TR> <TR><TD WIDTH="183" VALIGN="TOP" HEIGHT=10> <FONT SIZE=2>    <P ALIGN="JUSTIFY">FORMA PROBETA</FONT></TD> <TD WIDTH="42" VALIGN="TOP" HEIGHT=10>    <P></P></TD> <TD WIDTH="54" VALIGN="TOP" HEIGHT=10>    <P></P></TD> <TD WIDTH="36" VALIGN="TOP" HEIGHT=10>    <P></P></TD> <TD WIDTH="36" VALIGN="TOP" HEIGHT=10>    ]]></body>
<body><![CDATA[<P></P></TD> <TD WIDTH="35" VALIGN="TOP" HEIGHT=10>    <P></P></TD> <TD WIDTH="35" VALIGN="TOP" HEIGHT=10>    <P></P></TD> <TD WIDTH="76" VALIGN="TOP" HEIGHT=10>    <P></P></TD> </TR> <TR><TD WIDTH="183" VALIGN="TOP"> <FONT SIZE=2>    <P ALIGN="JUSTIFY">Elasticidad(g / mm)</FONT></TD> <TD WIDTH="42" VALIGN="TOP"> <FONT SIZE=2>    <P ALIGN="JUSTIFY">39</FONT></TD> <TD WIDTH="54" VALIGN="TOP"> <FONT SIZE=2>    <P ALIGN="JUSTIFY">140</FONT></TD> <TD WIDTH="36" VALIGN="TOP"> <FONT SIZE=2>    <P ALIGN="JUSTIFY">76</FONT></TD> <TD WIDTH="36" VALIGN="TOP"> <FONT SIZE=2>    <P ALIGN="JUSTIFY">33</FONT></TD> <TD WIDTH="35" VALIGN="TOP"> <FONT SIZE=2>    <P ALIGN="JUSTIFY">9,82</FONT></TD> <TD WIDTH="35" VALIGN="TOP"> <FONT SIZE=2>    ]]></body>
<body><![CDATA[<P ALIGN="JUSTIFY">0,96</FONT></TD> <TD WIDTH="76" VALIGN="TOP"> <FONT SIZE=2>    <P ALIGN="JUSTIFY">0,9493</FONT></TD> </TR> <TR><TD WIDTH="183" VALIGN="TOP" HEIGHT=13> <FONT SIZE=2>    <P ALIGN="JUSTIFY">Elongaci&oacute;n (mm)</FONT></TD> <TD WIDTH="42" VALIGN="TOP" HEIGHT=13> <FONT SIZE=2>    <P ALIGN="JUSTIFY">3,3</FONT></TD> <TD WIDTH="54" VALIGN="TOP" HEIGHT=13> <FONT SIZE=2>    <P ALIGN="JUSTIFY">10,9</FONT></TD> <TD WIDTH="36" VALIGN="TOP" HEIGHT=13> <FONT SIZE=2>    <P ALIGN="JUSTIFY">5,8</FONT></TD> <TD WIDTH="36" VALIGN="TOP" HEIGHT=13> <FONT SIZE=2>    <P ALIGN="JUSTIFY">2,232</FONT></TD> <TD WIDTH="35" VALIGN="TOP" HEIGHT=13> <FONT SIZE=2>    <P ALIGN="JUSTIFY">14,71</FONT></TD> <TD WIDTH="35" VALIGN="TOP" HEIGHT=13> <FONT SIZE=2>    <P ALIGN="JUSTIFY">0,90</FONT></TD> <TD WIDTH="76" VALIGN="TOP" HEIGHT=13> <FONT SIZE=2>    <P ALIGN="JUSTIFY">0,9417</FONT></TD> </TR> <TR><TD WIDTH="183" VALIGN="TOP">     ]]></body>
<body><![CDATA[<P>&nbsp;</TD> <TD WIDTH="42" VALIGN="TOP">     <P>&nbsp;</TD> <TD WIDTH="54" VALIGN="TOP">     <P>&nbsp;</TD> <TD WIDTH="36" VALIGN="TOP">     <P>&nbsp;</TD> <TD WIDTH="36" VALIGN="TOP">     <P>&nbsp;</TD> <TD WIDTH="35" VALIGN="TOP">     <P>&nbsp;</TD> <TD WIDTH="35" VALIGN="TOP">     <P>&nbsp;</TD> <TD WIDTH="76" VALIGN="TOP">     <P>&nbsp;</TD> </TR> </TABLE> </CENTER>      <P ALIGN="JUSTIFY"><font size="3">Valores obtenidos de 2 mediciones/tortilla, 5 tortillas/lote, 40 lotes y 1 repetici&oacute;n/lote.</font> </P> <B>    <P ALIGN="JUSTIFY"><font size="3"><sup>a</sup></font></B> <font size="3"><sup> </sup> D.S. Desviaci&oacute;n est&aacute;ndar.</font></P> <B>    ]]></body>
<body><![CDATA[<P ALIGN="JUSTIFY"><font size="3"><sup>b</sup></font></B> <font size="3"> C.V. Coeficiente de variaci&oacute;n.</font></P> <B>    <P ALIGN="JUSTIFY"><font size="3"><sup>c</sup></font></B> <font size="3"> R<sup>2 </sup> Proporci&oacute;n de la variabilidad de los datos.</font></P>     <P ALIGN="JUSTIFY">En la <a href="#TABLA 1"> Tabla 1</a> se muestra la estad&iacute;stica simple y los valores de repetibilidad de las evaluaciones de tensi&oacute;n de tortillas comerciales, hechas con el Texture Analyzer. En general las determinaciones presentaron una mayor repetibilidad para todos los par&aacute;metros obtenidos con la forma de probeta de las muestras evaluadas. La forma de la muestra influy&oacute; en la repetibilidad de las mediciones. En la pr&aacute;ctica, cuando se utiliz&oacute; la forma rectangular, la tortilla se rompi&oacute;, en muchas ocasiones, al nivel de las orillas de las pinzas de retenci&oacute;n, debido al debilitamiento del material causado por la presi&oacute;n de las pinzas de retenci&oacute;n.</P>     <P ALIGN="JUSTIFY">En la misma <a href="#TABLA 1"> Tabla 1</a> se muestra que los tres par&aacute;metros de tensi&oacute;n evaluados con la forma de probeta, presentaron muy buena repetibilidad (&gt; 0,95). Para evaluar la tensi&oacute;n de las tortillas, cualquiera de los tres par&aacute;metros obtenidos pueden ser utilizados. Por simplicidad y facilidad para la toma de datos, la fuerza m&aacute;xima fue considerada como el par&aacute;metro m&aacute;s adecuado para evaluar esta caracter&iacute;stica de textura de la tortilla.</P>     <P ALIGN="JUSTIFY">Respecto a los par&aacute;metros de fuerza al corte, la <a href="#TABLA 2"> Tabla 2</a> muestra que la fuerza m&aacute;xima al corte result&oacute; el par&aacute;metro de mayor repetibilidad para las formas rectangular y probeta, con valores de 0,996 y 0,993 respectivamente. Con valores igualmente altos result&oacute; el &aacute;rea total para ambas formas avaluadas. Con base a estos resultados, y considerando la simplicidad y facilidad para determinar la fuerza al corte se consider&oacute; a la fuerza m&aacute;xima como el par&aacute;metro m&aacute;s adecuado para evaluar la fuerza al corte de las tortillas. Aunque los valores absolutos var&iacute;an ligeramente entre las formas de la muestra, la repetibilidad se conserva debido a que el &aacute;rea de corte es similar entre las muestras de cada forma.</P>     <P ALIGN="JUSTIFY">Respecto a la elongaci&oacute;n (<a href="#TABLA 3">Tabla 3</a>), este par&aacute;metro result&oacute; en general, con menor repetibilidad que la elasticidad. Los par&aacute;metros de las muestras en forma de probeta resultaron m&aacute;s repetibles que los de la forma rectangular, 0,94 y 0,82 respectivamente.</P>     <P ALIGN="JUSTIFY">En general, al analizar el rango de valores de fuerza m&aacute;xima a la tensi&oacute;n encontrado (<a href="#TABLA 1">Tabla 1</a>), desde 52 hasta 638g, este result&oacute; similar a los encontrados por Flores-Far&iacute;as et al. (2), quienes reportaron valores desde 199 hasta 278g para tortillas elaboradas con harinas instant&aacute;neas comerciales hechas industrialmente y en el laboratorio. Estos autores utilizaron un equipo textur&oacute;metro, y una forma y tama&ntilde;o de muestra similares (rectangular) a los aqu&iacute; utilizados. Otros investigadores (7-10) reportaron valores absolutos de textura de tortillas diferentes, pero al ser analizados por unidad (tortilla), en algunos casos (10), sus valores resultan similares a los que aqu&iacute; se reportan. Para los casos donde los valores reportados son diferentes, se debe fundamentalmente a que el equipo utilizado, el tama&ntilde;o y la forma de la muestra, fueron diferentes y por ende los resultados obtenidos. En el caso de la fuerza m&aacute;xima al corte los valores aqu&iacute; encontrados oscilaron entre 337 y 3.370g. Al igual que la fuerza a la tensi&oacute;n estos resultados fueron, en algunos casos, similares (2) a los reportados por Flores-Far&iacute;as et al. (2) quienes reportaron valores desde 1.930 hasta 2.220g; y diferentes a los reportados por otros investigadores, ya que las metodolog&iacute;as utilizadas fueron diferentes. As&iacute;, por ejemplo, Bedolla et al. (16) reportaron valores de textura para la tortilla de alrededor de 20,4kg utilizando accesorios de punci&oacute;n, y Vazquez et al. (17) desde 0,354 hasta 0,497kg para tortillas de ma&iacute;z amarillo utilizando el mismo equipo textur&oacute;metro. En el caso de M&eacute;ndez-Albores et al. (18), estos reportaron valores muy similares a los aqu&iacute; encontrados debido a que utilizaron esta metodolog&iacute;a (aunque sin comprobar su repetibilidad). Finalmente se observ&oacute; que tanto para tensi&oacute;n como para corte, utilizando las dos formas de muestra y analizando la fuerza m&aacute;xima, los rangos de valores encontrados fueron amplios, con desviaci&oacute;n est&aacute;ndar entre 77 y 145g para tensi&oacute;n, 424 y 844g para corte, 21 y 33 para elasticidad y 2.182 y 2.232mm para elongaci&oacute;n). Aunque existe una gran variabilidad en los valores encontrados, &eacute;stos est&aacute;n dentro de los rangos reportados para la tortilla mexicana comercial (19). Esta amplitud en los rangos de valores, son debido principalmente a una gran heterogeneidad que existe en la producci&oacute;n de las tortillas que se comercializan en M&eacute;xico, desde la elaboraci&oacute;n del nixtamal y harinas instant&aacute;neas, hasta el cocimiento de la tortilla en las tortiller&iacute;as, adem&aacute;s de una falta de control de calidad en la elaboraci&oacute;n de las mismas.</P> <B>    <P ALIGN="justify">CONCLUSIONES</P> </B>    <P ALIGN="JUSTIFY">Para determinar o evaluar la textura de la tortilla de ma&iacute;z, el equipo textur&oacute;metro, Texture Analyzer TA-XT2, result&oacute; adecuado. La forma de muestra tipo "probeta", result&oacute; la de mayor repetibilidad para realizar las determinaciones de tensi&oacute;n y de corte con este equipo. El par&aacute;metro con mayor confiabilidad fue la fuerza m&aacute;xima, tanto para la fuerza a la tensi&oacute;n como para el corte. La elasticidad result&oacute; ser m&aacute;s confiable al realizarse las pruebas con la muestra con forma de probeta. Con la utilizaci&oacute;n de la forma de muestra tipo probeta, y determinando los par&aacute;metros de las gr&aacute;ficas del textur&oacute;metro de la manera aqu&iacute; evaluados, se facilit&oacute; la comparaci&oacute;n de los datos de textura de las tortillas de ma&iacute;z y se pudieron utilizar con la certeza de que se pueden repetir con alto grado de confiabilidad.</P> <B>    <P ALIGN="justify">AGRADECIMIENTOS</P> </B>    ]]></body>
<body><![CDATA[<P ALIGN="JUSTIFY">Deseamos agradecer a J. J. V&eacute;lez, R., M. Gayt&aacute;n M. y G. S&aacute;nchez H. por su asistencia t&eacute;cnica en este trabajo.&#9;</P> <B>    <P ALIGN="justify">REFERENCIAS</P><DIR>  </B>    <!-- ref --><P ALIGN="JUSTIFY">1. &#9;Serna-Sald&iacute;var SO, G&oacute;mez MH &amp; Rooney LW. Technology, chemistry and nutritional value of alkaline-cooked corn products. Cap. 4. In : Advances in Cereal Science and Technology. Vol X., Y. Pomeranz (Ed.). American Association of Cereal Chemist. St. Paul MN. 1990. p.243-307.&nbsp;&nbsp;&nbsp;&nbsp;&nbsp;&nbsp;&nbsp;&nbsp;[&#160;<a href="javascript:void(0);" onclick="javascript: window.open('/scielo.php?script=sci_nlinks&ref=437441&pid=S0004-0622200400020001200001&lng=','','width=640,height=500,resizable=yes,scrollbars=1,menubar=yes,');">Links</a>&#160;]<!-- end-ref --><!-- ref --><P ALIGN="JUSTIFY">2. &#9;Flores-Far&iacute;as R, Mart&iacute;nez-Bustos F, Salinas-Moreno Y, Kil-Chang Y, Gonz&aacute;lez-Hern&aacute;ndez J &amp; Rios E. Physicochemical and rheological characteristics of commercial nixtamalised mexican maize flours for tortilla. J Sci Food Agric. 2000;80:657-664.&nbsp;&nbsp;&nbsp;&nbsp;&nbsp;&nbsp;&nbsp;&nbsp;[&#160;<a href="javascript:void(0);" onclick="javascript: window.open('/scielo.php?script=sci_nlinks&ref=437442&pid=S0004-0622200400020001200002&lng=','','width=640,height=500,resizable=yes,scrollbars=1,menubar=yes,');">Links</a>&#160;]<!-- end-ref --><!-- ref --><P ALIGN="JUSTIFY">3. &#9;Instituto Nacional de Estad&iacute;stica, Geograf&iacute;a e Inform&aacute;tica (INEGI). Abasto y comercializaci&oacute;n de productos b&aacute;sicos. 2000. INEGI, M&eacute;xico.&nbsp;&nbsp;&nbsp;&nbsp;&nbsp;&nbsp;&nbsp;&nbsp;[&#160;<a href="javascript:void(0);" onclick="javascript: window.open('/scielo.php?script=sci_nlinks&ref=437443&pid=S0004-0622200400020001200003&lng=','','width=640,height=500,resizable=yes,scrollbars=1,menubar=yes,');">Links</a>&#160;]<!-- end-ref --><!-- ref --><P ALIGN="JUSTIFY">4. &#9;Khan MN, Desrosiers MC, Rooney LW, Morgan RC &amp; Sweat VE. Corn tortillas: evaluations of cooking procedures. Cereal Chem. 1982;59(9): 274-284.&nbsp;&nbsp;&nbsp;&nbsp;&nbsp;&nbsp;&nbsp;&nbsp;[&#160;<a href="javascript:void(0);" onclick="javascript: window.open('/scielo.php?script=sci_nlinks&ref=437444&pid=S0004-0622200400020001200004&lng=','','width=640,height=500,resizable=yes,scrollbars=1,menubar=yes,');">Links</a>&#160;]<!-- end-ref --><!-- ref --><P ALIGN="JUSTIFY">5. &#9;Bedolla S. &amp; Rooney LW. Characteristics of U.S. and Mexican instant maize flours for tortilla and snack preparation. Cereal Foods World 1984;29(11):732-735.&nbsp;&nbsp;&nbsp;&nbsp;&nbsp;&nbsp;&nbsp;&nbsp;[&#160;<a href="javascript:void(0);" onclick="javascript: window.open('/scielo.php?script=sci_nlinks&ref=437445&pid=S0004-0622200400020001200005&lng=','','width=640,height=500,resizable=yes,scrollbars=1,menubar=yes,');">Links</a>&#160;]<!-- end-ref --><!-- ref --><P ALIGN="JUSTIFY">6. &#9;Twillman, T. J. &amp; White PJ. Influence of monoglycerides on the textural shelf life and dough rheology of corn tortillas. Cereal Chem. 1988;46:397-400.&nbsp;&nbsp;&nbsp;&nbsp;&nbsp;&nbsp;&nbsp;&nbsp;[&#160;<a href="javascript:void(0);" onclick="javascript: window.open('/scielo.php?script=sci_nlinks&ref=437446&pid=S0004-0622200400020001200006&lng=','','width=640,height=500,resizable=yes,scrollbars=1,menubar=yes,');">Links</a>&#160;]<!-- end-ref --><!-- ref --><P ALIGN="JUSTIFY">7. &#9;Reyes HS, Reyes CR &amp; L&oacute;pez RF. Estudio de textur&oacute;genos primarios en nixtamal, masa y tortilla como base para determinaci&oacute;n de calidad tortillera del ma&iacute;z. Reporte interno. Escuela Nacional de Ciencias Biol&oacute;gicas. Instituto Polit&eacute;cnico Nacional. 1992. M&eacute;xico, D. F.&nbsp;&nbsp;&nbsp;&nbsp;&nbsp;&nbsp;&nbsp;&nbsp;[&#160;<a href="javascript:void(0);" onclick="javascript: window.open('/scielo.php?script=sci_nlinks&ref=437447&pid=S0004-0622200400020001200007&lng=','','width=640,height=500,resizable=yes,scrollbars=1,menubar=yes,');">Links</a>&#160;]<!-- end-ref --><!-- ref --><P ALIGN="JUSTIFY">8. &#9;Suhendro EL, Almeida-Dom&iacute;nguez HD, Rooney L &amp; Waniska RD. Objective rollability method for corn tortilla texture measurement. Cereal Chem. 1998a. 75(3):320-324.&nbsp;&nbsp;&nbsp;&nbsp;&nbsp;&nbsp;&nbsp;&nbsp;[&#160;<a href="javascript:void(0);" onclick="javascript: window.open('/scielo.php?script=sci_nlinks&ref=437448&pid=S0004-0622200400020001200008&lng=','','width=640,height=500,resizable=yes,scrollbars=1,menubar=yes,');">Links</a>&#160;]<!-- end-ref --><!-- ref --><P ALIGN="JUSTIFY">9. &#9;Suhendro EL, Almeida-Dom&iacute;nguez HD, Rooney LW, Waniska RD &amp; Moreira RG. Tortilla bending technique: an objective method for corn tortilla texture measurement. Cereal Chem. 1998b;75(6):854-858.&nbsp;&nbsp;&nbsp;&nbsp;&nbsp;&nbsp;&nbsp;&nbsp;[&#160;<a href="javascript:void(0);" onclick="javascript: window.open('/scielo.php?script=sci_nlinks&ref=437449&pid=S0004-0622200400020001200009&lng=','','width=640,height=500,resizable=yes,scrollbars=1,menubar=yes,');">Links</a>&#160;]<!-- end-ref --><!-- ref --><P ALIGN="JUSTIFY">10. Suhendro EL, Almeida-Dom&iacute;nguez HD, Rooney LW, Waniska R &amp; Moreira RG. Use of extensibility to measure corn tortilla texture. Cereal Chem. 1999;76(4):536-540.&nbsp;&nbsp;&nbsp;&nbsp;&nbsp;&nbsp;&nbsp;&nbsp;[&#160;<a href="javascript:void(0);" onclick="javascript: window.open('/scielo.php?script=sci_nlinks&ref=437450&pid=S0004-0622200400020001200010&lng=','','width=640,height=500,resizable=yes,scrollbars=1,menubar=yes,');">Links</a>&#160;]<!-- end-ref --><!-- ref --><P ALIGN="JUSTIFY">11. Baker RJ &amp; Campbell AB. Evaluation of screening tests for quality of bread wheat. Research Station, Canada. Dep. of Agriculture. Can J Plant Sci 1971;51:449-455.&nbsp;&nbsp;&nbsp;&nbsp;&nbsp;&nbsp;&nbsp;&nbsp;[&#160;<a href="javascript:void(0);" onclick="javascript: window.open('/scielo.php?script=sci_nlinks&ref=437451&pid=S0004-0622200400020001200011&lng=','','width=640,height=500,resizable=yes,scrollbars=1,menubar=yes,');">Links</a>&#160;]<!-- end-ref --><!-- ref --><P ALIGN="JUSTIFY">12. De la Roche YA &amp; Fowler DB. Wheat Quality Evaluation. 1. Accuracy and precision of prediction tests. Can J Plant Sci. 1&#9;975;55:241-249.&nbsp;&nbsp;&nbsp;&nbsp;&nbsp;&nbsp;&nbsp;&nbsp;[&#160;<a href="javascript:void(0);" onclick="javascript: window.open('/scielo.php?script=sci_nlinks&ref=437452&pid=S0004-0622200400020001200012&lng=','','width=640,height=500,resizable=yes,scrollbars=1,menubar=yes,');">Links</a>&#160;]<!-- end-ref --><!-- ref --><P ALIGN="JUSTIFY">13. Fowler DB &amp; De la Roche IA. Wheat Quality Evaluation. 2. Relationships among prediction tests.. Can J Plant Sci. 1975;55:251-262.&nbsp;&nbsp;&nbsp;&nbsp;&nbsp;&nbsp;&nbsp;&nbsp;[&#160;<a href="javascript:void(0);" onclick="javascript: window.open('/scielo.php?script=sci_nlinks&ref=437453&pid=S0004-0622200400020001200013&lng=','','width=640,height=500,resizable=yes,scrollbars=1,menubar=yes,');">Links</a>&#160;]<!-- end-ref --><!-- ref --><P ALIGN="JUSTIFY">14. Figueroa CJD. Determinaci&oacute;n del grado de confiabilidad del grano flotante como indicador de calidad en cebada. Agric Tec Mex. 1983;2:115-125.&nbsp;&nbsp;&nbsp;&nbsp;&nbsp;&nbsp;&nbsp;&nbsp;[&#160;<a href="javascript:void(0);" onclick="javascript: window.open('/scielo.php?script=sci_nlinks&ref=437454&pid=S0004-0622200400020001200014&lng=','','width=640,height=500,resizable=yes,scrollbars=1,menubar=yes,');">Links</a>&#160;]<!-- end-ref --><!-- ref --><P ALIGN="JUSTIFY">15. Statistical Analysis System (SAS). SAS User's guide. Version 6.12. 1989. The Institute Cary NC.&nbsp;&nbsp;&nbsp;&nbsp;&nbsp;&nbsp;&nbsp;&nbsp;[&#160;<a href="javascript:void(0);" onclick="javascript: window.open('/scielo.php?script=sci_nlinks&ref=437455&pid=S0004-0622200400020001200015&lng=','','width=640,height=500,resizable=yes,scrollbars=1,menubar=yes,');">Links</a>&#160;]<!-- end-ref --><!-- ref --><P ALIGN="JUSTIFY">16. Bedolla S, Palacios MG, Rooney LW, Diehl KC &amp; Khan MN. Cooking characteristics of sorghum and corn for tortilla preparation by several cooking methods. Cereal Chem. 1983;60:263-268.&nbsp;&nbsp;&nbsp;&nbsp;&nbsp;&nbsp;&nbsp;&nbsp;[&#160;<a href="javascript:void(0);" onclick="javascript: window.open('/scielo.php?script=sci_nlinks&ref=437456&pid=S0004-0622200400020001200016&lng=','','width=640,height=500,resizable=yes,scrollbars=1,menubar=yes,');">Links</a>&#160;]<!-- end-ref --><!-- ref --><P ALIGN="JUSTIFY">17. Vazquez CMG, M&aacute;rquez SRA &amp; M&aacute;rquez SF. Evaluaci&oacute;n f&iacute;sica, qu&iacute;mica y tortillera del compuesto pepitilla de ma&iacute;z. Rev Fitotecnia Mexicana.Vol. 1990;13:10-13.&nbsp;&nbsp;&nbsp;&nbsp;&nbsp;&nbsp;&nbsp;&nbsp;[&#160;<a href="javascript:void(0);" onclick="javascript: window.open('/scielo.php?script=sci_nlinks&ref=437457&pid=S0004-0622200400020001200017&lng=','','width=640,height=500,resizable=yes,scrollbars=1,menubar=yes,');">Links</a>&#160;]<!-- end-ref --><!-- ref --><P ALIGN="JUSTIFY">18. M&eacute;ndez-Albores JA, Ar&aacute;mbula VG, V&aacute;zquez BME, Mendoza EM, Preciado ORE &amp; Moreno-Mart&iacute;nez E. Effect of high moisture Maize storage on tortilla quality. J Food Sci. 2003;68(5):1878-1881.&nbsp;&nbsp;&nbsp;&nbsp;&nbsp;&nbsp;&nbsp;&nbsp;[&#160;<a href="javascript:void(0);" onclick="javascript: window.open('/scielo.php?script=sci_nlinks&ref=437458&pid=S0004-0622200400020001200018&lng=','','width=640,height=500,resizable=yes,scrollbars=1,menubar=yes,');">Links</a>&#160;]<!-- end-ref --> ]]></body>
<back>
<ref-list>
<ref id="B1">
<label>1</label><nlm-citation citation-type="book">
<person-group person-group-type="author">
<name>
<surname><![CDATA[Serna-Saldívar]]></surname>
<given-names><![CDATA[SO]]></given-names>
</name>
<name>
<surname><![CDATA[Gómez]]></surname>
<given-names><![CDATA[MH]]></given-names>
</name>
</person-group>
<source><![CDATA[Technology, chemistry and nutritional value of alkaline-cooked corn products. Cap. 4. In : Advances in Cereal Science and Technology.]]></source>
<year>1990</year>
<page-range>243-307</page-range><publisher-name><![CDATA[American Association of Cereal Chemist. St. Paul MN]]></publisher-name>
</nlm-citation>
</ref>
<ref id="B2">
<label>2</label><nlm-citation citation-type="journal">
<person-group person-group-type="author">
<name>
<surname><![CDATA[Flores-Farías]]></surname>
<given-names><![CDATA[R]]></given-names>
</name>
<name>
<surname><![CDATA[Martínez-Bustos]]></surname>
<given-names><![CDATA[F]]></given-names>
</name>
<name>
<surname><![CDATA[Salinas-Moreno]]></surname>
<given-names><![CDATA[Y]]></given-names>
</name>
<name>
<surname><![CDATA[Kil-Chang]]></surname>
<given-names><![CDATA[Y]]></given-names>
</name>
<name>
<surname><![CDATA[González-Hernández]]></surname>
<given-names><![CDATA[J]]></given-names>
</name>
<name>
<surname><![CDATA[Rios]]></surname>
<given-names><![CDATA[E]]></given-names>
</name>
</person-group>
<article-title xml:lang="en"><![CDATA[Physicochemical and rheological characteristics of commercial nixtamalised mexican maize flours for tortilla]]></article-title>
<source><![CDATA[J Sci Food Agric]]></source>
<year>2000</year>
<volume>80</volume>
<page-range>657-664</page-range></nlm-citation>
</ref>
<ref id="B3">
<label>3</label><nlm-citation citation-type="book">
<source><![CDATA[Instituto Nacional de Estadística, Geografía e Informática (INEGI). Abasto y comercialización de productos básicos]]></source>
<year>2000</year>
<publisher-name><![CDATA[INEGI,]]></publisher-name>
</nlm-citation>
</ref>
<ref id="B4">
<label>4</label><nlm-citation citation-type="journal">
<person-group person-group-type="author">
<name>
<surname><![CDATA[Khan]]></surname>
<given-names><![CDATA[MN]]></given-names>
</name>
<name>
<surname><![CDATA[Desrosiers]]></surname>
<given-names><![CDATA[MC]]></given-names>
</name>
<name>
<surname><![CDATA[Rooney]]></surname>
<given-names><![CDATA[LW]]></given-names>
</name>
</person-group>
<article-title xml:lang="en"><![CDATA[Corn tortillas: evaluations of cooking procedures]]></article-title>
<source><![CDATA[Cereal Chem.]]></source>
<year>1982</year>
<volume>59</volume>
<numero>9</numero>
<issue>9</issue>
<page-range>274-284</page-range></nlm-citation>
</ref>
<ref id="B5">
<label>5</label><nlm-citation citation-type="journal">
<person-group person-group-type="author">
<name>
<surname><![CDATA[Bedolla]]></surname>
<given-names><![CDATA[S]]></given-names>
</name>
<name>
<surname><![CDATA[Rooney]]></surname>
<given-names><![CDATA[LW]]></given-names>
</name>
</person-group>
<article-title xml:lang="es"><![CDATA[Characteristics of U.S. and Mexican instant maize flours for tortilla and snack preparation]]></article-title>
<source><![CDATA[Cereal Foods World]]></source>
<year>1984</year>
<volume>29</volume>
<page-range>732-735</page-range></nlm-citation>
</ref>
<ref id="B6">
<label>6</label><nlm-citation citation-type="journal">
<person-group person-group-type="author">
<name>
<surname><![CDATA[Twillman]]></surname>
<given-names><![CDATA[T. J.]]></given-names>
</name>
<name>
<surname><![CDATA[White]]></surname>
<given-names><![CDATA[PJ]]></given-names>
</name>
</person-group>
<article-title xml:lang="es"><![CDATA[Influence of monoglycerides on the textural shelf life and dough rheology of corn tortillas]]></article-title>
<source><![CDATA[Cereal Chem]]></source>
<year>1988</year>
<volume>46</volume>
<page-range>397-400</page-range></nlm-citation>
</ref>
<ref id="B7">
<label>7</label><nlm-citation citation-type="book">
<person-group person-group-type="author">
<name>
<surname><![CDATA[Reyes]]></surname>
<given-names><![CDATA[HS]]></given-names>
</name>
<name>
<surname><![CDATA[Reyes]]></surname>
<given-names><![CDATA[CR]]></given-names>
</name>
<name>
<surname><![CDATA[López]]></surname>
<given-names><![CDATA[RF]]></given-names>
</name>
</person-group>
<source><![CDATA[Estudio de texturógenos primarios en nixtamal, masa y tortilla como base para determinación de calidad tortillera del maíz. Reporte interno]]></source>
<year>1992</year>
<publisher-loc><![CDATA[México, D. F ]]></publisher-loc>
<publisher-name><![CDATA[Escuela Nacional de Ciencias Biológicas. Instituto Politécnico Nacional]]></publisher-name>
</nlm-citation>
</ref>
<ref id="B8">
<label>8</label><nlm-citation citation-type="journal">
<person-group person-group-type="author">
<name>
<surname><![CDATA[Suhendro]]></surname>
<given-names><![CDATA[EL]]></given-names>
</name>
<name>
<surname><![CDATA[Almeida-Domínguez]]></surname>
<given-names><![CDATA[HD]]></given-names>
</name>
<name>
<surname><![CDATA[Rooney]]></surname>
<given-names><![CDATA[L]]></given-names>
</name>
<name>
<surname><![CDATA[Waniska]]></surname>
<given-names><![CDATA[RD]]></given-names>
</name>
</person-group>
<article-title xml:lang="en"><![CDATA[Objective rollability method for corn tortilla texture measurement]]></article-title>
<source><![CDATA[Cereal Chem]]></source>
<year>1998</year>
<volume>75</volume>
<page-range>320-324</page-range></nlm-citation>
</ref>
<ref id="B9">
<label>9</label><nlm-citation citation-type="journal">
<person-group person-group-type="author">
<name>
<surname><![CDATA[Suhendro]]></surname>
<given-names><![CDATA[EL]]></given-names>
</name>
<name>
<surname><![CDATA[Almeida-Domínguez]]></surname>
<given-names><![CDATA[HD]]></given-names>
</name>
<name>
<surname><![CDATA[Rooney]]></surname>
<given-names><![CDATA[LW]]></given-names>
</name>
<name>
<surname><![CDATA[Waniska]]></surname>
<given-names><![CDATA[RD]]></given-names>
</name>
</person-group>
<article-title xml:lang="en"><![CDATA[Tortilla bending technique: an objective method for corn tortilla texture measurement]]></article-title>
<source><![CDATA[Cereal Chem.]]></source>
<year>1998</year>
<volume>75</volume>
<page-range>854-858</page-range></nlm-citation>
</ref>
<ref id="B10">
<label>10</label><nlm-citation citation-type="journal">
<person-group person-group-type="author">
<name>
<surname><![CDATA[Suhendro]]></surname>
<given-names><![CDATA[EL]]></given-names>
</name>
</person-group>
<article-title xml:lang="en"><![CDATA[Use of extensibility to measure corn tortilla texture]]></article-title>
<source><![CDATA[Cereal Chem]]></source>
<year>1999</year>
<volume>76</volume>
<numero>4</numero>
<issue>4</issue>
<page-range>536-540</page-range></nlm-citation>
</ref>
<ref id="B11">
<label>11</label><nlm-citation citation-type="journal">
<person-group person-group-type="author">
<name>
<surname><![CDATA[Baker]]></surname>
<given-names><![CDATA[RJ]]></given-names>
</name>
<name>
<surname><![CDATA[Campbell]]></surname>
<given-names><![CDATA[AB]]></given-names>
</name>
</person-group>
<article-title xml:lang="en"><![CDATA[Evaluation of screening tests for quality of bread wheat. Research Station, Canada. Dep. of Agriculture]]></article-title>
<source><![CDATA[Can J Plant Sci]]></source>
<year>1971</year>
<volume>51</volume>
<page-range>449-455</page-range></nlm-citation>
</ref>
<ref id="B12">
<label>12</label><nlm-citation citation-type="journal">
<person-group person-group-type="author">
<name>
<surname><![CDATA[De la Roche]]></surname>
<given-names><![CDATA[YA]]></given-names>
</name>
<name>
<surname><![CDATA[Fowler]]></surname>
<given-names><![CDATA[DB]]></given-names>
</name>
</person-group>
<article-title xml:lang="en"><![CDATA[Wheat Quality Evaluation. 1. Accuracy and precision of prediction tests]]></article-title>
<source><![CDATA[Can J Plant Sci.]]></source>
<year>1 97</year>
<month>5</month>
<volume>55</volume>
<page-range>241-249</page-range></nlm-citation>
</ref>
<ref id="B13">
<label>13</label><nlm-citation citation-type="journal">
<person-group person-group-type="author">
<name>
<surname><![CDATA[Fowler]]></surname>
<given-names><![CDATA[DB]]></given-names>
</name>
<name>
<surname><![CDATA[De la Roche]]></surname>
<given-names><![CDATA[IA]]></given-names>
</name>
</person-group>
<article-title xml:lang="en"><![CDATA[Wheat Quality Evaluation. 2. Relationships among prediction tests]]></article-title>
<source><![CDATA[Can J Plant Sci.]]></source>
<year>1975</year>
<volume>55</volume>
<page-range>251-262</page-range></nlm-citation>
</ref>
<ref id="B14">
<label>14</label><nlm-citation citation-type="journal">
<person-group person-group-type="author">
<name>
<surname><![CDATA[Figueroa]]></surname>
<given-names><![CDATA[CJD]]></given-names>
</name>
</person-group>
<article-title xml:lang="es"><![CDATA[Determinación del grado de confiabilidad del grano flotante como indicador de calidad en cebada]]></article-title>
<source><![CDATA[Agric Tec Mex.]]></source>
<year>1983</year>
<page-range>115-125</page-range></nlm-citation>
</ref>
<ref id="B15">
<label>15</label><nlm-citation citation-type="book">
<source><![CDATA[Statistical Analysis System (SAS). SAS User's guide]]></source>
<year></year>
<publisher-name><![CDATA[The Institute Cary NC]]></publisher-name>
</nlm-citation>
</ref>
<ref id="B16">
<label>16</label><nlm-citation citation-type="journal">
<person-group person-group-type="author">
<name>
<surname><![CDATA[Bedolla]]></surname>
<given-names><![CDATA[S]]></given-names>
</name>
<name>
<surname><![CDATA[Palacios]]></surname>
<given-names><![CDATA[MG]]></given-names>
</name>
</person-group>
<article-title xml:lang="en"><![CDATA[Cooking characteristics of sorghum and corn for tortilla preparation by several cooking methods]]></article-title>
<source><![CDATA[Cereal Chem.]]></source>
<year>1983</year>
<volume>60</volume>
<page-range>263-268</page-range></nlm-citation>
</ref>
<ref id="B17">
<label>17</label><nlm-citation citation-type="journal">
<person-group person-group-type="author">
<name>
<surname><![CDATA[Vazquez]]></surname>
<given-names><![CDATA[CMG]]></given-names>
</name>
<name>
<surname><![CDATA[Márquez]]></surname>
<given-names><![CDATA[SRA]]></given-names>
</name>
</person-group>
<article-title xml:lang="es"><![CDATA[. Evaluación física, química y tortillera del compuesto pepitilla de maíz]]></article-title>
<source><![CDATA[Rev Fitotecnia Mexicana.]]></source>
<year></year>
<volume>13</volume>
<page-range>10-13</page-range></nlm-citation>
</ref>
<ref id="B18">
<label>18</label><nlm-citation citation-type="journal">
<person-group person-group-type="author">
<name>
<surname><![CDATA[Méndez-Albores]]></surname>
<given-names><![CDATA[JA]]></given-names>
</name>
<name>
<surname><![CDATA[Arámbula]]></surname>
<given-names><![CDATA[VG]]></given-names>
</name>
<name>
<surname><![CDATA[Vázquez]]></surname>
<given-names><![CDATA[BME]]></given-names>
</name>
<name>
<surname><![CDATA[Mendoza]]></surname>
<given-names><![CDATA[EM]]></given-names>
</name>
</person-group>
<article-title xml:lang="en"><![CDATA[Preciado ORE & Moreno-Martínez E. Effect of high moisture Maize storage on tortilla quality]]></article-title>
<source><![CDATA[J Food Sci.]]></source>
<year></year>
<volume>68</volume>
<numero>5</numero>
<issue>5</issue>
<page-range>1878-1881</page-range></nlm-citation>
</ref>
</ref-list>
</back>
</article>
