<?xml version="1.0" encoding="ISO-8859-1"?><article xmlns:mml="http://www.w3.org/1998/Math/MathML" xmlns:xlink="http://www.w3.org/1999/xlink" xmlns:xsi="http://www.w3.org/2001/XMLSchema-instance">
<front>
<journal-meta>
<journal-id>0004-0622</journal-id>
<journal-title><![CDATA[Archivos Latinoamericanos de Nutrición]]></journal-title>
<abbrev-journal-title><![CDATA[ALAN]]></abbrev-journal-title>
<issn>0004-0622</issn>
<publisher>
<publisher-name><![CDATA[Sociedad Latinoamericana de Nutrición]]></publisher-name>
</publisher>
</journal-meta>
<article-meta>
<article-id>S0004-06222007000200006</article-id>
<title-group>
<article-title xml:lang="en"><![CDATA[Comparison of the anthropometric and biochemical variables between children and their parents]]></article-title>
</title-group>
<contrib-group>
<contrib contrib-type="author">
<name>
<surname><![CDATA[Farias de Novaes]]></surname>
<given-names><![CDATA[Juliana]]></given-names>
</name>
<xref ref-type="aff" rid="A01"/>
</contrib>
<contrib contrib-type="author">
<name>
<surname><![CDATA[Castro Franceschini]]></surname>
<given-names><![CDATA[Sylvia do Carmo]]></given-names>
</name>
<xref ref-type="aff" rid="A01"/>
</contrib>
<contrib contrib-type="author">
<name>
<surname><![CDATA[Priore]]></surname>
<given-names><![CDATA[Sílvia Eloiza]]></given-names>
</name>
<xref ref-type="aff" rid="A01"/>
</contrib>
</contrib-group>
<aff id="A01">
<institution><![CDATA[,Federal University of Viçosa  ]]></institution>
<addr-line><![CDATA[Viçosa ]]></addr-line>
<country>Brazil</country>
</aff>
<pub-date pub-type="pub">
<day>00</day>
<month>06</month>
<year>2007</year>
</pub-date>
<pub-date pub-type="epub">
<day>00</day>
<month>06</month>
<year>2007</year>
</pub-date>
<volume>57</volume>
<numero>2</numero>
<fpage>137</fpage>
<lpage>145</lpage>
<copyright-statement/>
<copyright-year/>
<self-uri xlink:href="http://ve.scielo.org/scielo.php?script=sci_arttext&amp;pid=S0004-06222007000200006&amp;lng=en&amp;nrm=iso"></self-uri><self-uri xlink:href="http://ve.scielo.org/scielo.php?script=sci_abstract&amp;pid=S0004-06222007000200006&amp;lng=en&amp;nrm=iso"></self-uri><self-uri xlink:href="http://ve.scielo.org/scielo.php?script=sci_pdf&amp;pid=S0004-06222007000200006&amp;lng=en&amp;nrm=iso"></self-uri><abstract abstract-type="short" xml:lang="en"><p><![CDATA[The objective of this study was to compare the anthropometry, body composition and biochemical profile between eutrophic and obese children, as well as to relate the children’s nutritional state and body composition to those of their respective parents. A control-case study was carried out with 50 eutrophic and 50 obese children paired according to gender, age, socioeconomic condition, and selected from the nutritional evaluation of 2 074 children aged 6 to 8 years, attending public and private urban schools in Viçosa, Minas Gerais, Brazil. The measurements evaluated were weight, height, circumferences (waist and hip) and thickness skinfolds (triceps and subscapular). The serum levels of glucose, total-cholesterol, HDL, LDL, triglycerides and hemoglobin in the children were evaluated. The obese children presented a larger body size and higher percentage for total body fat as well as its accumulation in the central region, and higher serum levels for triglycerides (p < 0.05). For all biochemical parameters, except for hemoglobin and HDL, there occurred a positive correlation with the located fat in the central region as well as with the total body fat in children (p < 0.05). The obese mothers showing high percentage of body fat and its accumulation in the central region rather tend to have children with these characteristics (p < 0,05). The highest number of the close relatives who are obese and present dyslipidemia is highlighted in the obese children (p < 0.05). This study evidences the differences concerning to the distribution of the body fat and lipid profile among eutrophic and obese children, as well as the strong influence of the maternal obesity upon child’s obesity]]></p></abstract>
<abstract abstract-type="short" xml:lang="es"><p><![CDATA[Comparación de las variables antropométricas y bioquímicas entre niños y sus padres. El objetivo de este estudio fue comparar la antropometría, composición corporal y el perfil bioquímico entre niños eutróficos y obesos y, además relacionar el estado nutricional y la composición corporal de los niños con los de sus respectivos padres. Se realizó un estudio caso control con 50 niños eutróficos y 50 obesos, pareadas de acuerdo con el sexo, de la edad y condiciones socioeconómicas, y seleccionados a partir de una evaluación nutricional de 2074 niños entre los 6 a 8 años, matriculados en escuelas urbanas públicas y privadas de la ciudad de Viçosa, Minas Gerais, Brasil. Las medidas evaluadas fueron el peso, estatura, circunferencias (cintura y cadera) y pliegues cutáneos (tricipital y subescapular). Los niveles de glucosa, colesterol total, HDL, LDL, triglicéridos y hemoglobina también fueron evaluados. Los niños obesos presentaron mayor tamaño corporal (IMC) y porcentaje de grasa total, así como predominio de grasa en la región central, y valores superiores de triglicéridos (p < 0.05). Para todos los parámetros bioquímicos, excepto la hemoglobina y el HDL, hubo correlación positiva con la grasa localizada en la región central y grasa corporal total en los niños (< 0.05). Las madres obesas que presentaron elevado porcentaje de grasa corporal y acúmulo de grasa en la región central tienden a tener hijos con estas mismas características (p < 0.05). Un mayor número de familiares obesos y con dislipidemias fue observado en los niños obesos (p < 0.05). Este estudio evidencia diferencias en cuanto a la distribución de la grasa corporal y perfil lipídico entre niños eutróficos y obesos, así como la fuerte influencia de la obesidad materna sobre la obesidad en los niños]]></p></abstract>
<kwd-group>
<kwd lng="en"><![CDATA[Nutritional status]]></kwd>
<kwd lng="en"><![CDATA[body composition]]></kwd>
<kwd lng="en"><![CDATA[child]]></kwd>
<kwd lng="en"><![CDATA[parents]]></kwd>
<kwd lng="en"><![CDATA[hyperlipidemias]]></kwd>
<kwd lng="en"><![CDATA[obesity]]></kwd>
<kwd lng="es"><![CDATA[Estado nutricional]]></kwd>
<kwd lng="es"><![CDATA[composición corporal]]></kwd>
<kwd lng="es"><![CDATA[niños]]></kwd>
<kwd lng="es"><![CDATA[padres]]></kwd>
<kwd lng="es"><![CDATA[hiperlipidemias]]></kwd>
<kwd lng="es"><![CDATA[obesidad]]></kwd>
</kwd-group>
</article-meta>
</front><body><![CDATA[ <p ALIGN="center" style="word-spacing: 0; line-height: 100%; margin-bottom: 0"><b><font size="3"><font face="Verdana">Comparison of the anthropometric and biochemical variables</font> <font face="Verdana">between children and their parents</font></font></b></p>     <p ALIGN="center" style="word-spacing: 0; line-height: 100%; margin-bottom: 0"><font face="Verdana" size="2"><b>Juliana Farias de Novaes, Sylvia do Carmo Castro Franceschini, Sílvia Eloiza Priore</b></font></p>     <p ALIGN="justify" style="word-spacing: 0; line-height: 100%; margin-bottom: 0"><font face="Verdana" size="2">Federal University of Viçosa, Viçosa, Minas Gerais, Brazil</font></p>     <p ALIGN="justify" style="word-spacing: 0; line-height: 100%; margin-bottom: 0"><font face="Verdana" size="2"><b>SUMMARY.</b></font></p>     <p ALIGN="justify" style="word-spacing: 0; line-height: 100%; margin-bottom: 0"><font face="Verdana" size="2">The objective of this study was to compare the anthropometry,</font> <font face="Verdana" size="2">body composition and biochemical profile between</font> <font face="Verdana" size="2">eutrophic and obese children, as well as to relate the children’s nutritional</font> <font face="Verdana" size="2">state and body composition to those of their respective parents. </font><font face="Verdana" size="2">A control-case study was carried out with 50 eutrophic and 50</font> <font face="Verdana" size="2">obese children paired according to gender, age, socioeconomic condition,</font> <font face="Verdana" size="2">and selected from the nutritional evaluation of 2 074 children</font> <font face="Verdana" size="2">aged 6 to 8 years, attending public and private urban schools in Viçosa,</font> <font face="Verdana" size="2">Minas Gerais, Brazil. The measurements evaluated were weight,</font> <font face="Verdana" size="2">height, circumferences (waist and hip) and thickness skinfolds (triceps</font> <font face="Verdana" size="2">and subscapular). The serum levels of glucose, total-cholesterol,</font> <font face="Verdana" size="2">HDL, LDL, triglycerides and hemoglobin in the children were</font> <font face="Verdana" size="2">evaluated. The obese children presented a larger body size and higher</font> <font face="Verdana" size="2">percentage for total body fat as well as its accumulation in the central</font> <font face="Verdana" size="2">region, and higher serum levels for triglycerides (p &lt; 0.05). For</font> <font face="Verdana" size="2">all biochemical parameters, except for hemoglobin and HDL, there</font> <font face="Verdana" size="2">occurred a positive correlation with the located fat in the central region</font> <font face="Verdana" size="2">as well as with the total body fat in children (p &lt; 0.05). The</font> <font face="Verdana" size="2">obese mothers showing high percentage of body fat and its accumulation</font> <font face="Verdana" size="2">in the central region rather tend to have children with these</font> <font face="Verdana" size="2">characteristics (p &lt; 0,05). The highest number of the close relatives</font> <font face="Verdana" size="2">who are obese and present dyslipidemia is highlighted in the obese</font> <font face="Verdana" size="2">children (p &lt; 0.05). This study evidences the differences concerning</font> <font face="Verdana" size="2">to the distribution of the body fat and lipid profile among eutrophic</font> <font face="Verdana" size="2">and obese children, as well as the strong influence of the maternal</font> <font face="Verdana" size="2">obesity upon child’s obesity.</font></p>     <p ALIGN="justify" style="word-spacing: 0; line-height: 100%; margin-bottom: 0"><font face="Verdana" size="2"><b>Key words:</b> Nutritional status, body composition, child, parents,</font> <font face="Verdana" size="2">hyperlipidemias, obesity.</font></p>     <p ALIGN="justify" style="word-spacing: 0; line-height: 100%; margin-bottom: 0"><font face="Verdana" size="2"><b>RESUMEN. </b></font></p>     <p ALIGN="justify" style="word-spacing: 0; line-height: 100%; margin-bottom: 0"><font face="Verdana" size="2">Comparación de las variables antropométricas y</font> <font face="Verdana" size="2">bioquímicas entre niños y sus padres. El objetivo de este estudio</font> <font face="Verdana" size="2">fue comparar la antropometría, composición corporal y el perfil</font> <font face="Verdana" size="2">bioquímico entre niños eutróficos y obesos y, además relacionar el</font> <font face="Verdana" size="2">estado nutricional y la composición corporal de los niños con los de</font> <font face="Verdana" size="2">sus respectivos padres. Se realizó un estudio caso control con 50</font> <font face="Verdana" size="2">niños eutróficos y 50 obesos, pareadas de acuerdo con el sexo, de la</font> <font face="Verdana" size="2">edad y condiciones socioeconómicas, y seleccionados a partir de</font> <font face="Verdana" size="2">una evaluación nutricional de 2074 niños entre los 6 a 8 años, matriculados</font> <font face="Verdana" size="2">en escuelas urbanas públicas y privadas de la ciudad de</font> <font face="Verdana" size="2">Viçosa, Minas Gerais, Brasil. Las medidas evaluadas fueron el peso,</font> <font face="Verdana" size="2">estatura, circunferencias (cintura y cadera) y pliegues cutáneos (tricipital</font> <font face="Verdana" size="2">y subescapular). Los niveles de glucosa, colesterol total, HDL, LDL,</font> <font face="Verdana" size="2">triglicéridos y hemoglobina también fueron evaluados. Los niños obesos</font> <font face="Verdana" size="2">presentaron mayor tamaño corporal (IMC) y porcentaje de grasa</font> <font face="Verdana" size="2">total, así como predominio de grasa en la región central, y valores</font> <font face="Verdana" size="2">superiores de triglicéridos (p &lt; 0.05). Para todos los parámetros</font> <font face="Verdana" size="2">bioquímicos, excepto la hemoglobina y el HDL, hubo correlación positiva</font> <font face="Verdana" size="2">con la grasa localizada en la región central y grasa corporal total</font> <font face="Verdana" size="2">en los niños (&lt; 0.05). Las madres obesas que presentaron elevado porcentaje</font> <font face="Verdana" size="2">de grasa corporal y acúmulo de grasa en la región central tienden</font> <font face="Verdana" size="2">a tener hijos con estas mismas características (p &lt; 0.05). Un mayor</font> <font face="Verdana" size="2">número de familiares obesos y con dislipidemias fue observado en los</font> <font face="Verdana" size="2">niños obesos (p &lt; 0.05). Este estudio evidencia diferencias en cuanto a</font> <font face="Verdana" size="2">la distribución de la grasa corporal y perfil lipídico entre niños eutróficos</font> <font face="Verdana" size="2">y obesos, así como la fuerte influencia de la obesidad materna sobre la</font> <font face="Verdana" size="2">obesidad en los niños.</font></p>     <p ALIGN="justify" style="word-spacing: 0; line-height: 100%; margin-bottom: 0"><font face="Verdana" size="2"><b>Palabras clave:</b> Estado nutricional, composición corporal, niños,</font> <font face="Verdana" size="2">padres, hiperlipidemias, obesidad.</font></p>     <p ALIGN="justify" style="word-spacing: 0; line-height: 100%; margin-bottom: 0"><font face="Verdana" size="2"><b>Recibido: </b>23-04-2007</font>&nbsp; <font face="Verdana" size="2"><b>Aceptado: </b>25-07-2007</font></p>     ]]></body>
<body><![CDATA[<p ALIGN="justify" style="word-spacing: 0; line-height: 100%; margin-bottom: 0"><font face="Verdana" size="2"><b>INTRODUCTION</b></font></p>     <p ALIGN="justify" style="word-spacing: 0; line-height: 100%; margin-bottom: 0"><font face="Verdana" size="2">Obesity is considered as an emerging problem of public</font> <font face="Verdana" size="2">health in Brazil and worldwide. It is one of the main nutritional</font> <font face="Verdana" size="2">problem occurring in children, since it can lead to serious negative</font> <font face="Verdana" size="2">consequences for the physical and mental health. In addition,</font> <font face="Verdana" size="2">it is considered as predictor for obesity in the adult life,</font> <font face="Verdana" size="2">besides causing a risk situation which can lead to increased</font> <font face="Verdana" size="2">mortality as a cause associated to the atherosclerotic disease,</font> <font face="Verdana" size="2">hypertension, and metabolic alterations. The association between</font> <font face="Verdana" size="2">obesity and dyslipidemia observed in adults has been also documented</font> <font face="Verdana" size="2">in children and teenagers (1). According to Freedman et</font> <font face="Verdana" size="2">al. (2), when the overweight school children were compared with</font> <font face="Verdana" size="2">their respective thinner pairs, they presented 2.4 to 7.1 times</font> <font face="Verdana" size="2">higher probability to have an elevated total cholesterol, LDLcholesterol,</font> <font face="Verdana" size="2">triglycerides and blood pressure as well as 12.6 times</font> <font face="Verdana" size="2">higher probability to have hyperinsulinemia. It is worth to emphasize</font> <font face="Verdana" size="2">that the visceral fatty tissue is exclusively related to risk</font> <font face="Verdana" size="2">factors, such as the altered insulin and lipid profile in children,</font> <font face="Verdana" size="2">which can contribute to the development of the insulin resistance</font> <font face="Verdana" size="2">syndrome at precocious ages, which comprises several</font> <font face="Verdana" size="2">risk factors for the emergence of cardiovascular diseases in the</font> <font face="Verdana" size="2">adult life (3).</font></p>     <p ALIGN="justify" style="word-spacing: 0; line-height: 100%; margin-bottom: 0"><font face="Verdana" size="2">The childhood obesity is considerably present in the</font> <font face="Verdana" size="2">industrialized countries, whereas the parents’ obesity is one</font> <font face="Verdana" size="2">of the stronger risk factors. This fact is explained by the genetic</font> <font face="Verdana" size="2">factor, as well as by the environmental family influences (4).</font> <font face="Verdana" size="2">Scaglioni et al. (5) verified that the parents’ overweight was</font> <font face="Verdana" size="2">the highest risk factor for childhood obesity, as being the</font> <font face="Verdana" size="2">overweight prevalence in 5 years-old children significantly</font> <font face="Verdana" size="2">higher in those with overweight parents than in the ones whose</font> <font face="Verdana" size="2">parents did not present overweight (37.3% vs 8.3%</font> <font face="Verdana" size="2">respectively, p &lt; 0.001). Reis et al. (6) observed that childparentassociation was strong for obesity and abdominal</font> <font face="Verdana" size="2">adiposity. Parents of obese children were at 6 times higher</font> <font face="Verdana" size="2">odds of being obese than parents of non obese children.</font> <font face="Verdana" size="2">Similarly, parents of children who had abnormally large waist</font> <font face="Verdana" size="2">circumferences were themselves at 6 times higher odds of</font> <font face="Verdana" size="2">having abdominal adiposity. According to the authors, because</font> <font face="Verdana" size="2">children access primary care is more frequently than adults,</font> <font face="Verdana" size="2">children can potentially serve as the index case to identify</font> <font face="Verdana" size="2">families at increased risk of obesity.</font></p>     <p ALIGN="justify" style="word-spacing: 0; line-height: 100%; margin-bottom: 0"><font face="Verdana" size="2">In this context, this study was carried out to compare the</font> <font face="Verdana" size="2">anthropometry, body composition and biochemical profile</font> <font face="Verdana" size="2">among eutrophic and obese children, as well as to relate the</font> <font face="Verdana" size="2">children’s nutritional state and body composition to those of</font> <font face="Verdana" size="2">their respective parents.</font></p>     <p ALIGN="justify" style="word-spacing: 0; line-height: 100%; margin-bottom: 0"><font face="Verdana" size="2"><b>METHODS</b></font></p>     <p ALIGN="justify" style="word-spacing: 0; line-height: 100%; margin-bottom: 0"><font face="Verdana" size="2">According to the General Education Office in Minas Gerais</font> <font face="Verdana" size="2">State (MG), Viçosa county, Brazil, totalizes 26 urban schools</font> <font face="Verdana" size="2">(19 public and 7 private) attending children at the age range</font> <font face="Verdana" size="2">from 6 to 8 years . All school children aged 6 to 8 years (n = 2074) who were enrolled in the respective schools which spontaneously</font> <font face="Verdana" size="2">accepted to participate in the study, were weighed</font> <font face="Verdana" size="2">and measured. Only one public school had no participation in</font> <font face="Verdana" size="2">this study because it was not authorized by the school direction.</font> <font face="Verdana" size="2">The body mass index (BMI) was calculated from the</font> <font face="Verdana" size="2">weight and height measures conducted in appropriate places</font> <font face="Verdana" size="2">at the respective schools. From the percentiles corresponding</font> <font face="Verdana" size="2">to this index and according to the age and gender, the children’s</font> <font face="Verdana" size="2">nutritional state were defined according to the anthropometrical</font> <font face="Verdana" size="2">reference provided by the Center for Disease Control and Prevention</font> <font face="Verdana" size="2">(7). The cutting points used for the classification of</font> <font face="Verdana" size="2">obesity (¡Ý percentile 95) was based on the classification proposed</font> <font face="Verdana" size="2">by Must et al. (8). However, only the obese children</font> <font face="Verdana" size="2">showing BMI/age equal or superior to the percentile 96 were</font> <font face="Verdana" size="2">included in the sample, because the increased specificity of</font> <font face="Verdana" size="2">cutting point reduces the possibility to obtaining false-positive</font> <font face="Verdana" size="2">children in the sample.</font></p>     <p ALIGN="justify" style="word-spacing: 0; line-height: 100%; margin-bottom: 0"><font face="Verdana" size="2">This is a case-control study, in which the obese children</font> <font face="Verdana" size="2">were selected from the anthropometrical evaluation conducted</font> <font face="Verdana" size="2">in schools. These children were paired with the eutrophic at</font> <font face="Verdana" size="2">the proportion 1:1, according to gender, age and classroom,</font> <font face="Verdana" size="2">as well as school and socioeconomic condition. Only the obese</font> <font face="Verdana" size="2">children showing BMI/age equal or superior to the percentile</font> <font face="Verdana" size="2">96 were included in the sample. The criterion for selecting</font> <font face="Verdana" size="2">the eutrophic ones (5 ¡Ü BMI /age &lt; 85) was based on the</font> <font face="Verdana" size="2">random choice of children with the same gender, age and classroom</font> <font face="Verdana" size="2">of the obese ones. From the total children (2,074) under</font> <font face="Verdana" size="2">evaluation, 58 (2.8%) were classified as obese (¡Ý percentile</font> <font face="Verdana" size="2">96). Eight obese children were lost (6.9%), consequently,</font> <font face="Verdana" size="2">their eutrophic pairs (n = 8) were not evaluated. The lost of 8</font> <font face="Verdana" size="2">obesity children occurred because the mothers informed that</font> <font face="Verdana" size="2">the children were already receiving nutritional assistance for</font> <font face="Verdana" size="2">another professional and there would not be need of the participation</font> <font face="Verdana" size="2">in the study (2); the mothers informed unavailability</font> <font face="Verdana" size="2">of time to participate in the study (4) and alteration of the</font> <font face="Verdana" size="2">children’s nutritional status of obesity for overweight between</font> <font face="Verdana" size="2">the moment of the selection of the sample and the beginning</font> <font face="Verdana" size="2">of the collection of data (n=2). Thus, the sample consisted of</font> <font face="Verdana" size="2">50 obese and 50 eutrophic children.</font></p>     <p ALIGN="justify" style="word-spacing: 0; line-height: 100%; margin-bottom: 0"><font face="Verdana" size="2">From the selection of the obese and eutrophic children</font> <font face="Verdana" size="2">groups by the BMI/age, their parents were invited by telephone</font> <font face="Verdana" size="2">to participate in the study and scheduled a personal encounter</font> <font face="Verdana" size="2">for evaluation. In this encounter, the consent term was</font> <font face="Verdana" size="2">presented and explained, and a written authorization for</font> <font face="Verdana" size="2">children’s participation was solicited to their parents. Those</font> <font face="Verdana" size="2">parents and children who spontaneously accepted to</font> <font face="Verdana" size="2">participate in this study attended for the data collection in the</font> <font face="Verdana" size="2">Nutritional Evaluation Laboratory pertaining to the Nutrition</font> <font face="Verdana" size="2">and Health Department, Federal University of Viçosa.</font></p>     <p ALIGN="justify" style="word-spacing: 0; line-height: 100%; margin-bottom: 0"><font face="Verdana" size="2">For ethical reasons, in spite of the fact that the study was</font> <font face="Verdana" size="2">intended for obese and eutrophic children, mothers whose</font> <font face="Verdana" size="2">children presented low weight and overweight were informed</font> <font face="Verdana" size="2">about their children’s nutritional status and directed to the</font> <font face="Verdana" size="2">public health service where they received nutritional assistance.</font> <font face="Verdana" size="2">Besides, after collecting all necessary information for</font> <font face="Verdana" size="2">the accomplishment of the study by research participants, all</font> <font face="Verdana" size="2">children and their parents were given specific nutritional orientation</font> <font face="Verdana" size="2">aiming at the improvement of both feeding habit and</font> <font face="Verdana" size="2">lifestyle, according to their nutritional state and body composition</font> <font face="Verdana" size="2">previously diagnosed.</font></p>     <p ALIGN="justify" style="word-spacing: 0; line-height: 100%; margin-bottom: 0"><font face="Verdana" size="2">The whole anthropometric evaluation was only conducted</font> <font face="Verdana" size="2">by one of the authors of this study, to avoid possible biases in</font> <font face="Verdana" size="2">checking the measures. In the evaluation of the nutritional</font> <font face="Verdana" size="2">status of the children and their parents, the weight was obtained</font> <font face="Verdana" size="2">with a portable, digital and electronic scale with 150</font> <font face="Verdana" size="2">kg capacity and 50g division. The height was verified with</font> <font face="Verdana" size="2">2m-extension stadiometer divided into centimeters and subdivided</font> <font face="Verdana" size="2">into millimeters. The techniques proposed by Jelliffe</font> <font face="Verdana" size="2">(9) were used in checking both measures.</font></p>     ]]></body>
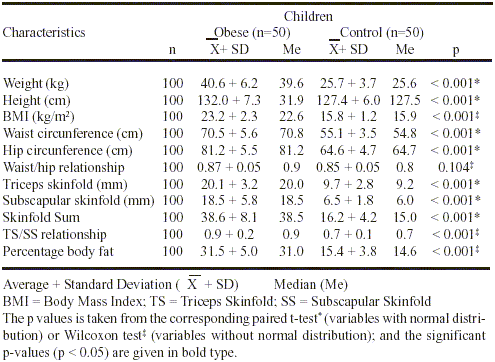
<body><![CDATA[<p ALIGN="justify" style="word-spacing: 0; line-height: 100%; margin-bottom: 0"><font face="Verdana" size="2">For estimating the adiposity in the central region, the waist</font> <font face="Verdana" size="2">circumference of the children and that of their parents were</font> <font face="Verdana" size="2">evaluated, by checking with non-elastic measuring tape that</font> <font face="Verdana" size="2">was applied horizontally midway between the lowest rib margin and the iliac crest. The children’s hip circumference was</font> <font face="Verdana" size="2">measured at the point yielding the maximum circumference</font> <font face="Verdana" size="2">over the buttock. The waist/hip relationship was obtained by</font> <font face="Verdana" size="2">division between the waist circumference and hip circumference</font> <font face="Verdana" size="2">values.</font></p>     <p ALIGN="justify" style="word-spacing: 0; line-height: 100%; margin-bottom: 0"><font face="Verdana" size="2">Both triceps and subscapular skinfold thicknesses were</font> <font face="Verdana" size="2">verified on the right side of the children’s body by using the</font> <font face="Verdana" size="2">equipment Lange Skinfold Caliper. Each measurement was</font> <font face="Verdana" size="2">verified three non-consecutive times, and the results were calculated</font> <font face="Verdana" size="2">by the mean of those two closer values. The children’s</font> <font face="Verdana" size="2">percentage body fat was estimated by equations derived from</font> <font face="Verdana" size="2">a multicomponent model proposed by Slaughter et al. (10).</font> <font face="Verdana" size="2">This equation was based on the values of the triceps and subscapular</font> <font face="Verdana" size="2">skinfold thicknesses adjusted to gender, maturation</font> <font face="Verdana" size="2">level, and ethnicity. Since all children were at age range from</font> <font face="Verdana" size="2">6 to 8 years, the maturation level considered for classification</font> <font face="Verdana" size="2">of the percentage body fat was the pre-pubescent one. Concerning</font> <font face="Verdana" size="2">to ethnicity, the percentage body fat for those lightbrunet</font> <font face="Verdana" size="2">and dark-brunet children was estimated by equations</font> <font face="Verdana" size="2">preconized for white and black races, respectively, being that</font> <font face="Verdana" size="2">predictive equations specifically for white and black people.</font> <font face="Verdana" size="2">When the body fat values were above 20% for boys and 25%</font> <font face="Verdana" size="2">for girls, the excessive adiposity was diagnosed (11). The subscapular</font> <font face="Verdana" size="2">/ triceps skinfold relationship was obtained by division</font> <font face="Verdana" size="2">between the subescapular thickness skinfold and triceps</font> <font face="Verdana" size="2">thickness skinfold.</font></p>     <p ALIGN="justify" style="word-spacing: 0; line-height: 100%; margin-bottom: 0"><font face="Verdana" size="2">After fasting for 12 hours, the blood samples of the children</font> <font face="Verdana" size="2">were taken in only one laboratory pertaining to Viçosa county.</font> <font face="Verdana" size="2">Disposable materials were used to evaluate the concentration</font> <font face="Verdana" size="2">of both glucose and serum lipoproteins, such as total</font> <font face="Verdana" size="2">cholesterol, triglycerides, HDL-cholesterol (High Density</font> <font face="Verdana" size="2">Lipoproteins) and LDL-cholesterol (Low Density</font> <font face="Verdana" size="2">Lipoproteins). For hemoglobin analysis, the blood was</font> <font face="Verdana" size="2">collected by digital puncture, and dosage was performed by</font> <font face="Verdana" size="2">the colorimeter method through a portable hemoglobinometer.</font> <font face="Verdana" size="2">Those children showing a hemoglobin below 12 g/dL were</font> <font face="Verdana" size="2">considered as anemic ones (12). The reference values for the</font> <font face="Verdana" size="2">lipid and glucose profiles were based on recommendation of</font> <font face="Verdana" size="2">the American Academy of Pediatrics (13) and American</font> <font face="Verdana" size="2">Diabetes Association (14), respectively.</font> </p>     <p ALIGN="justify" style="word-spacing: 0; line-height: 100%; margin-bottom: 0"><font face="Verdana" size="2">By BMI calculation, the parents’ nutritional status was classified</font>&nbsp; <font face="Verdana" size="2">according to the WHO (15): low weight (BMI &lt; 18.5),</font> <font face="Verdana" size="2">euthrophy (18.5 ¡Ü BMI &lt; 25.0), overweight (25.0 ¡Ü BMI</font> <font face="Verdana" size="2">&lt;30.0) and obesity (BMI ¡Ý 30.0). The waist circumference</font> <font face="Verdana" size="2">values obtained for parents were compared to the cut off points</font> <font face="Verdana" size="2">established by WHO (15) as risk of metabolic complications</font> <font face="Verdana" size="2">associated to obesity: women (¡Ý 80 cm) and men (¡Ý 94 cm).</font></p>     <p ALIGN="justify" style="word-spacing: 0; line-height: 100%; margin-bottom: 0"><font face="Verdana" size="2">When evaluating the parents’ body composition, the bipedal</font> <font face="Verdana" size="2">electric bioimpedance was used to estimate the percentage</font> <font face="Verdana" size="2">total body fat, according to the classification proposed by</font> <font face="Verdana" size="2">Lohmann (16). Evaluation of the parents’ body composition</font> <font face="Verdana" size="2">was performed from 6:30 to 8:00h in the morning, and those</font> <font face="Verdana" size="2">parents were fasting. The non-ingestion of alcoholic beverages</font> <font face="Verdana" size="2">for at least 48 hours before testing was also requested</font> <font face="Verdana" size="2">(17).</font></p>     <p ALIGN="justify" style="word-spacing: 0; line-height: 100%; margin-bottom: 0"><font face="Verdana" size="2">Mothers or the child’s responsible were interrogated about</font> <font face="Verdana" size="2">the presence of chronic-degenerative diseases in the child’s</font> <font face="Verdana" size="2">close relatives [mother, father, grandmothers and grandfathers,</font> <font face="Verdana" size="2">uncles and aunts (both maternal and paternal)], such as obesity,</font> <font face="Verdana" size="2">dyslipidemia, diabetes, hypertension, cancer and cardiovascular</font> <font face="Verdana" size="2">diseases (18-20).</font></p>     <p ALIGN="justify" style="word-spacing: 0; line-height: 100%; margin-bottom: 0"><font face="Verdana" size="2">The database and statistical analyses were accomplished,</font> <font face="Verdana" size="2">by using the softwares Epi Info version 6.04 and Sigma-Stat.</font> <font face="Verdana" size="2">The Kolmogorov-Smirnov normality test was used to verify</font> <font face="Verdana" size="2">the normal distribution of the variables. The association of</font> <font face="Verdana" size="2">the variables with children’s obesity was analyzed by the quisquare</font> <font face="Verdana" size="2">test among paired samples. In addition, odds ratio and</font> <font face="Verdana" size="2">confident interval of 95% were calculated for each factor presenting</font> <font face="Verdana" size="2">statistical differences. According to the distribution</font> <font face="Verdana" size="2">of the variables in the normal curve, the paired t-test and the</font> <font face="Verdana" size="2">Wilcoxon test were used to compare the averages or medians</font> <font face="Verdana" size="2">among the paired groups, respectively, as well as the Pearson</font> <font face="Verdana" size="2">and Spearman correlation tests. The probability below 5% was</font> <font face="Verdana" size="2">considered as statistical significance level.</font></p>     <p ALIGN="justify" style="word-spacing: 0; line-height: 100%; margin-bottom: 0"><font face="Verdana" size="2">This study was approved by the Ethics Committee of Federal</font> <font face="Verdana" size="2">University of Viçosa.</font></p>     <p ALIGN="justify" style="word-spacing: 0; line-height: 100%; margin-bottom: 0"><font face="Verdana" size="2"><b>RESULTS</b></font></p>     <p ALIGN="justify" style="word-spacing: 0; line-height: 100%; margin-bottom: 0"><font face="Verdana" size="2"><a href="#tab1">Table 1</a> shows the anthropometry and body composition</font> <font face="Verdana" size="2">in eutrophic and obese children. Superior values was observed</font> <font face="Verdana" size="2">for weight, height, BMI, waist and hip circumferences, triceps</font> <font face="Verdana" size="2">and subscapular skinfold thicknesses as well as the</font> <font face="Verdana" size="2">skinfold sum in the obese group (p&lt;0.001). Aiming at the</font> <font face="Verdana" size="2">evaluation of the body fat distribution, either the waist/hip</font> <font face="Verdana" size="2">relationship and the subscapular/triceps skinfold thicknesses</font> <font face="Verdana" size="2">(SS/TS) relationship were analyzed, where statistically significant</font> <font face="Verdana" size="2">differences were found for this last index, and the</font> <font face="Verdana" size="2">obese children’s group showed the highest values (p&lt;0.001).</font> <font face="Verdana" size="2">When evaluating the body composition, it was verified that</font> <font face="Verdana" size="2">the obese children showed higher values for percentage body</font> <font face="Verdana" size="2">fat (p&lt;0.001). It is important to emphasize that 98% obese</font> <font face="Verdana" size="2">children showed a higher percentage for total body fat for age</font> <font face="Verdana" size="2">and sex, whereas the value was 2% in the eutrophic group.</font></p>     ]]></body>
<body><![CDATA[<p ALIGN="justify" style="word-spacing: 0; line-height: 100%; margin-bottom: 0"><a name="tab1"></a></p>     <p ALIGN="center" style="word-spacing: 0; line-height: 100%; margin-bottom: 0"><font face="Verdana" size="2"><b>TABLE 1. </b></font><font face="Verdana" size="2">Antropometry and body composition according children’s</font> <font face="Verdana" size="2">nutritional state</font> <font face="Verdana" size="2">Children</font></p>     <p ALIGN="center" style="word-spacing: 0; line-height: 100%; margin-bottom: 0"><img border="0" src="/img/fbpe/alan/v57n2/art06tab1.gif" align="center" width="495" height="362"></p>     
<p ALIGN="justify" style="word-spacing: 0; line-height: 100%; margin-bottom: 0"><font face="Verdana" size="2">Except for hemoglobin and HDL-cholesterol, all biochemical</font> <font face="Verdana" size="2">parameters showed a positive and statistically significant</font> <font face="Verdana" size="2">correlation with either the fat located at the central region and</font> <font face="Verdana" size="2">total body fat, that were represented by the values of the subscapular</font> <font face="Verdana" size="2">skinfold thickness, skinfold sum and percentage body</font> <font face="Verdana" size="2">fat. Only this last one showed no correlation with the LDL-cholesterol</font> <font face="Verdana" size="2">levels, in spite of the proximity to the statistical significance</font> <font face="Verdana" size="2">found (p = 0.056) (<a href="#tab2">Table 2</a>). It is important to emphasize</font> <font face="Verdana" size="2">that only glucose and triglyceride levels showed significant positive</font> <font face="Verdana" size="2">correlation with the waist circumference (<a href="#tab2">Table 2</a>).</font></p>     <p ALIGN="justify" style="word-spacing: 0; line-height: 100%; margin-bottom: 0"><a name="tab2"></a></p>     <p ALIGN="center" style="word-spacing: 0; line-height: 100%; margin-bottom: 0"><font face="Verdana" size="2"><b>TABLE 2. </b></font><font face="Verdana" size="2">Correlations between children’s anthropometry and body composition with biochemical parameters</font></p>     <p ALIGN="center" style="word-spacing: 0; line-height: 100%; margin-bottom: 0"><img border="0" src="/img/fbpe/alan/v57n2/art06tab2.gif" align="center" width="563" height="256"></p>     
<p ALIGN="justify" style="word-spacing: 0; line-height: 100%; margin-bottom: 0"><font face="Verdana" size="2">Higher glucose and triglyceride levels were found in the</font> <font face="Verdana" size="2">obese group, and the difference was statistically significant</font> <font face="Verdana" size="2">(p = 0.019; p = 0.004; respectively) (<a href="#tab3">Table 3</a>). For other biochemical</font> <font face="Verdana" size="2">parameters such as hemoglobin, total-cholesterol,</font> <font face="Verdana" size="2">HDL and LDL, no statistically significant differences were</font> <font face="Verdana" size="2">found between those two groups (p = 0.88; p = 0.10; p =</font> <font face="Verdana" size="2">0.07; p = 0.10, respectively) (<a href="#tab3">Table 3</a>).</font></p>     <p ALIGN="justify" style="word-spacing: 0; line-height: 100%; margin-bottom: 0"><a name="tab3"></a></p>     <p ALIGN="center" style="word-spacing: 0; line-height: 100%; margin-bottom: 0"><font face="Verdana" size="2"><b>TABLE 3. </b></font><font face="Verdana" size="2">Children’s bioquemical profile according nutritional status</font></p>     ]]></body>
<body><![CDATA[<p ALIGN="center" style="word-spacing: 0; line-height: 100%; margin-bottom: 0"><img border="0" src="/img/fbpe/alan/v57n2/art06tab3.gif" align="center" width="495" height="285"></p>     
<p ALIGN="justify" style="word-spacing: 0; line-height: 100%; margin-bottom: 0"><font face="Verdana" size="2"><a href="#tab4">Table 4 </a>shows the significantly higher values for BMI,</font> <font face="Verdana" size="2">percentage body fat, and waist circumference in the obese</font> <font face="Verdana" size="2">children’s mothers, with respect to those of the eutrophic ones</font> <font face="Verdana" size="2">(p = 0.006; p = 0.015; p = 0.017, respectively). Regarding the</font> <font face="Verdana" size="2">variables of the father, no statistically significant differences</font> <font face="Verdana" size="2">were found between both groups (p = 0.64; p = 0.52; p =</font> <font face="Verdana" size="2">0.23, respectively).</font></p>     <p ALIGN="justify" style="word-spacing: 0; line-height: 100%; margin-bottom: 0"><a name="tab4"></a></p>     <p ALIGN="center" style="word-spacing: 0; line-height: 100%; margin-bottom: 0"><font face="Verdana" size="2"><b>TABLE 4. </b></font><font face="Verdana" size="2">Average or median distribution of maternal and paternal</font> <font face="Verdana" size="2">BMI, percentage body fat and waist circumference</font> <font face="Verdana" size="2">according children’s nutritional status</font></p>     <p ALIGN="center" style="word-spacing: 0; line-height: 100%; margin-bottom: 0"><img border="0" src="/img/fbpe/alan/v57n2/art06tab4.gif" align="center" width="494" height="350"></p>     
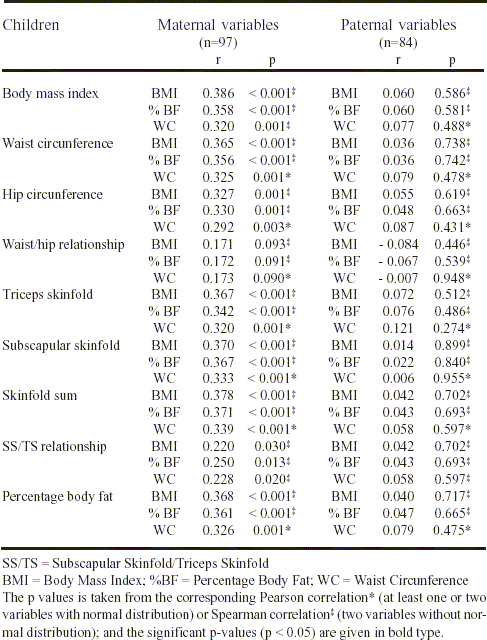
<p ALIGN="justify" style="word-spacing: 0; line-height: 100%; margin-bottom: 0"><font face="Verdana" size="2">Besides, a positive and statistically significant correlation</font> <font face="Verdana" size="2">was found between all anthropometric and body composition</font> <font face="Verdana" size="2">measures of the child, except for the waist/hip relationship,</font> <font face="Verdana" size="2">with those of their mothers’, that is, the overweight mothers</font> <font face="Verdana" size="2">with excessive body fat and accumulation of body fat in</font> <font face="Verdana" size="2">the central region have children with these characteristics.</font> <font face="Verdana" size="2">Such a fact is confirmed by positive and significant correlations,</font> <font face="Verdana" size="2">as follows: between the BMI, waist and hip circumferences,</font> <font face="Verdana" size="2">triceps and subscapular skinfold thicknesses, sum and</font> <font face="Verdana" size="2">skinfold relationship, and percentage body fat of the children</font> <font face="Verdana" size="2">with the BMI, percentage body fat and waist circumference</font> <font face="Verdana" size="2">of their mothers. However, no correlation was found for fathers</font> <font face="Verdana" size="2">(<a href="#tab5">Table 5</a>).</font></p>     <p ALIGN="justify" style="word-spacing: 0; line-height: 100%; margin-bottom: 0"><a name="tab5"></a></p>     <p ALIGN="center" style="word-spacing: 0; line-height: 100%; margin-bottom: 0"><font face="Verdana" size="2"><b>TABLE 5. </b>Correlations between children’s anthropometric measures</font> <font face="Verdana" size="2">and percentage body fat with those their parents</font> <font face="Verdana" size="2">Children Maternal variables Paternal variables</font></p>     <p ALIGN="center" style="word-spacing: 0; line-height: 100%; margin-bottom: 0"><img border="0" src="/img/fbpe/alan/v57n2/art06tab5.gif" align="center" width="487" height="640"></p>     
<p ALIGN="justify" style="word-spacing: 0; line-height: 100%; margin-bottom: 0"><font face="Verdana" size="2">According to the data obtained from this study, it is important</font> <font face="Verdana" size="2">to emphasize that the child’s chance to present obesity</font> <font face="Verdana" size="2">was six times higher when the mother had a high percentage</font> <font face="Verdana" size="2">body fat, comparative to the eutrophic pairs whose mothers</font> <font face="Verdana" size="2">did not show high percentage body fat (OR = 6.0; IC =</font> <font face="Verdana" size="2">1.27 – 38.68; p = 0.01) (data not shown in table).</font></p>     ]]></body>
<body><![CDATA[<p ALIGN="justify" style="word-spacing: 0; line-height: 100%; margin-bottom: 0"><font face="Verdana" size="2">This study investigated the presence of close relatives</font> <font face="Verdana" size="2">(grandfathers, grandmothers, mother, father, uncles and aunts)</font> <font face="Verdana" size="2">with positive obesity history, dyslipidemia, diabetes, hypertension,</font> <font face="Verdana" size="2">cardiovascular disease and cancer. For obesity, it was</font> <font face="Verdana" size="2">observed that 78 and 54% of the obese and eutrophic children</font> <font face="Verdana" size="2">respectively presented one or more close relatives with positive</font> <font face="Verdana" size="2">obesity history, and this difference was statistically significant</font> <font face="Verdana" size="2">(p = 0.01). The obesity presence in two or more close</font> <font face="Verdana" size="2">relatives of the obese and eutrophic children group were 44</font> <font face="Verdana" size="2">and 14%, respectively, being the difference also statistically</font> <font face="Verdana" size="2">significant (p = 0.001) (data not shown in table).</font></p>     <p ALIGN="justify" style="word-spacing: 0; line-height: 100%; margin-bottom: 0"><font face="Verdana" size="2">Regarding to dyslipidemia, it was verified 82% of the obese</font> <font face="Verdana" size="2">children to present one or more close relatives with history</font> <font face="Verdana" size="2">for positive dyslipidemia, whereas a value of 62% was found</font> <font face="Verdana" size="2">for the eutrophic ones, being an statistically significant difference</font> <font face="Verdana" size="2">(p = 0.04). The same result was found for the dyslipidemia</font> <font face="Verdana" size="2">presence in two or more close relatives in both obese and</font> <font face="Verdana" size="2">eutrophic children’s group (54% vs 28%, respectively; p =0.02) (data not shown in table).</font></p>     <p ALIGN="justify" style="word-spacing: 0; line-height: 100%; margin-bottom: 0"><font face="Verdana" size="2">For the presence of diabetes, arterial hypertension,</font> <font face="Verdana" size="2">cardiovascular diseases and cancer in the close relatives, no</font> <font face="Verdana" size="2">significant differences between obese children and the</font> <font face="Verdana" size="2">eutrophic ones were found (data not shown in table).</font></p>     <p ALIGN="justify" style="word-spacing: 0; line-height: 100%; margin-bottom: 0"><font face="Verdana" size="2">A low positive correlation, but significant, was observed</font> <font face="Verdana" size="2">between the child’s BMI and the number of close relatives</font> <font face="Verdana" size="2">with positive history for obesity (r = 0.278; p = 0.005). For</font> <font face="Verdana" size="2">other family chronic diseases, no correlation with the child’s</font> <font face="Verdana" size="2">BMI were found for dyslipidemia (r = 0.18; p = 0.07), diabetes</font> <font face="Verdana" size="2">(r = 0.17; p = 0.08), hypertension (r = 0.13; p = 0.18),</font> <font face="Verdana" size="2">cardiovascular diseases (r = 0.04; p = 0.68) and cancer (r =</font> <font face="Verdana" size="2">0.12; p = 0.20) – data not shown in table.</font></p>     <p ALIGN="justify" style="word-spacing: 0; line-height: 100%; margin-bottom: 0"><font face="Verdana" size="2">According to the data obtained from this study, a child’s</font> <font face="Verdana" size="2">probability to present obesity was four times higher when there</font> <font face="Verdana" size="2">were one or more close relatives with obesity in relation to</font> <font face="Verdana" size="2">those eutrophic pairs who had no obese close relatives (OR =</font> <font face="Verdana" size="2">4.00; IC = 1.25 – 14.10; p = 0.01), and this chance was increased</font> <font face="Verdana" size="2">for the presence of two or more close obese relatives</font> <font face="Verdana" size="2">(OR = 4.75; IC = 1.52 – 16.45; p = 0.001). The same result</font> <font face="Verdana" size="2">was found for the dyslipidemia. A child’s probability to present</font> <font face="Verdana" size="2">obesity was three times higher when there were one or more</font> <font face="Verdana" size="2">close relatives with dyslipidemia, in relation to those eutrophic</font> <font face="Verdana" size="2">pairs who had no close relatives with this characteristic (OR =3.0; IC = 1.02 – 9.41; p = 0.04), and this chance was also</font> <font face="Verdana" size="2">increased for the presence of two or more close relatives with</font> <font face="Verdana" size="2">dyslipidemia (OR = 2.85; IC = 1.14 – 7.41; p = 0.02) (data</font> <font face="Verdana" size="2">not shown in table).</font></p>     <p ALIGN="justify" style="word-spacing: 0; line-height: 100%; margin-bottom: 0"><font face="Verdana" size="2"><b>DISCUSSION</b></font></p>     <p ALIGN="justify" style="word-spacing: 0; line-height: 100%; margin-bottom: 0"><font face="Verdana" size="2">The highest height values found in the obese children were</font> <font face="Verdana" size="2">also observed in other studies, such as that accomplished by</font> <font face="Verdana" size="2">Hui et al. (21), who found 6- and 7-years old obese children</font> <font face="Verdana" size="2">from Hong Kong to present significantly higher height than</font> <font face="Verdana" size="2">the eutrophic ones at the same age group. Gulliford et al. (22)</font> <font face="Verdana" size="2">also verified the obese children to be considerably taller than</font> <font face="Verdana" size="2">their non-obese pairs. According to Garn &amp; Clarck (23), theobese children tend to be taller, as presenting advanced bone</font> <font face="Verdana" size="2">age and precocious maturation than non-obese ones.</font></p>     <p ALIGN="justify" style="word-spacing: 0; line-height: 100%; margin-bottom: 0"><font face="Verdana" size="2">This study emphasizes the body differences between</font> <font face="Verdana" size="2">eutrophic and obese children, where the last ones presented</font> <font face="Verdana" size="2">higher values for all anthropometric and body composition</font> <font face="Verdana" size="2">parameters, therefore emphasizing the highest body size and</font> <font face="Verdana" size="2">higher fat percent, and it is important to emphasize the</font> <font face="Verdana" size="2">prevalence of body fat in this group’s central region. In</font> <font face="Verdana" size="2">addition, obese children tend to present undesirable</font> <font face="Verdana" size="2">biochemical profiles just because the probably inadequate</font> <font face="Verdana" size="2">feeding habit and shortage of physical activities. So, the total</font> <font face="Verdana" size="2">body fat is increased besides being able to accumulate in the</font> <font face="Verdana" size="2">central region, as favoring the emergence of the dyslipidemia.</font> <font face="Verdana" size="2">This fact can be confirmed by the discoveries from this study,</font> <font face="Verdana" size="2">since all biochemical parameters under study, except</font> <font face="Verdana" size="2">hemoglobin and HDL-cholesterol, showed a positive and</font> <font face="Verdana" size="2">significant correlation with either fat located in the central</font> <font face="Verdana" size="2">region and the total body fat represented by the values of the</font> <font face="Verdana" size="2">subscapular thicknesses skinfold, cutaneous skinfold sums and</font> <font face="Verdana" size="2">percent body fat.</font></p>     <p ALIGN="justify" style="word-spacing: 0; line-height: 100%; margin-bottom: 0"><font face="Verdana" size="2">The relationship between the children’s dyslipidemia and</font> <font face="Verdana" size="2">abdominal adiposity happens due to the abdominal fatty tissue</font> <font face="Verdana" size="2">presenting higher lipolytic rates in relation to other subcutaneous</font> <font face="Verdana" size="2">tissues (24). The lipolysis leads to the production of</font> <font face="Verdana" size="2">high rates of free fatty acids in the portal circulation and liver</font> <font face="Verdana" size="2">(25). The high exposure of the hepatic tissue to free fatty acids</font> <font face="Verdana" size="2">leads to the increase in the lipid hepatic synthesis, consequently</font> <font face="Verdana" size="2">to dyslipidemia (26). It is possible the fatty acids of</font> <font face="Verdana" size="2">the abdominal adipose tissue to be the strongest predictor of</font> <font face="Verdana" size="2">the children’s serum lipid levels. The dyslipidemia together</font> <font face="Verdana" size="2">with abdominal adiposity is characterized by the plasmatic</font> <font face="Verdana" size="2">increase of triglycerides, LDL-cholesterol, VLDL-cholesterol,</font> <font face="Verdana" size="2">and Apo B, as well as reduction in HDL-cholesterol levels</font> <font face="Verdana" size="2">(24). Besides, the increased release of the fatty acids in the</font> <font face="Verdana" size="2">liver can increase the hepatic glyconeogenesis, so leading to</font> <font face="Verdana" size="2">the hyperinsulinemia and resistance to insulin (27).</font></p>     <p ALIGN="justify" style="word-spacing: 0; line-height: 100%; margin-bottom: 0"><font face="Verdana" size="2">Higher glucose and triglyceride levels were found in the</font> <font face="Verdana" size="2">obese group, and the difference was statistically significant.</font> <font face="Verdana" size="2">Spite of the differences found in glucose concentration between</font> <font face="Verdana" size="2">both groups, all blood values did not surpass those recommended</font> <font face="Verdana" size="2">by the American Diabetes Association (14). However,</font> <font face="Verdana" size="2">the difference found for triglyceride levels evidences a</font> <font face="Verdana" size="2">higher percentage of obese children with levels above that recommended</font> <font face="Verdana" size="2">by American Academy of Pediatrics (13) with respect</font> <font face="Verdana" size="2">to the eutrophic ones (34% vs. 10%, respectively). Similar</font> <font face="Verdana" size="2">results were found by Botton et al. (28) and Asato et al.</font> <font face="Verdana" size="2">(29), who studied the obese and eutrophic children and observed</font> <font face="Verdana" size="2">statistically significant difference between those two</font> <font face="Verdana" size="2">groups for triglyceride levels, which was higher in the obese</font> <font face="Verdana" size="2">ones.</font></p>     ]]></body>
<body><![CDATA[<p ALIGN="justify" style="word-spacing: 0; line-height: 100%; margin-bottom: 0"><font face="Verdana" size="2">It is worth to emphasize that although no statistical differences</font> <font face="Verdana" size="2">were found for the average values of hemoglobin, total-</font> <font face="Verdana" size="2">cholesterol, HDL and LDL between both groups, a higher</font> <font face="Verdana" size="2">percent of the obese children showed increased levels of the</font> <font face="Verdana" size="2">total cholesterol, LDL and reduced HDL in relation to the</font> <font face="Verdana" size="2">eutrophic ones, according to recommendation of the American</font> <font face="Verdana" size="2">Academy of Pediatrics (13). However a higher percent of</font> <font face="Verdana" size="2">the obese children showed increased levels of the total cholesterol</font> <font face="Verdana" size="2">(8% vs. 2%), LDL (14% vs. 2%) and reduced HDL</font> <font face="Verdana" size="2">(54% vs. 46%) in relation to the eutrophic ones, according to</font> <font face="Verdana" size="2">recommendation of the American Academy of Pediatrics (13).</font> <font face="Verdana" size="2">This fact might be presenting the possible initial inadequacy</font> <font face="Verdana" size="2">of the lipid profile in childhood, mainly in obese children.</font> <font face="Verdana" size="2">Concerning to hemoglobin, was verified that 14% eutrophic</font> <font face="Verdana" size="2">and 12.2% obese children were anemic. Almost all anemic</font> <font face="Verdana" size="2">children were from public schools (91.7%). It is important to</font> <font face="Verdana" size="2">emphasize the possible influence of the socioeconomic level</font> <font face="Verdana" size="2">in the prevalence of anemia, since low purchasing power families</font> <font face="Verdana" size="2">might have not enough financial condition to acquire</font> <font face="Verdana" size="2">heme-iron-source foods, such as meat.</font></p>     <p ALIGN="justify" style="word-spacing: 0; line-height: 100%; margin-bottom: 0"><font face="Verdana" size="2">It is known that parents’ obesity is a strong predictor for</font> <font face="Verdana" size="2">obesity in the children, as a function of both genetic and</font> <font face="Verdana" size="2">environmental influence, as inadequate feeding habits and</font> <font face="Verdana" size="2">lifestyles developed within family. Such an influence can be</font> <font face="Verdana" size="2">still higher between mother and son, because most of the time</font> <font face="Verdana" size="2">she is more responsible for the direct child care, so she can</font> <font face="Verdana" size="2">interfere into feeding and lifestyle of her children. This close</font> <font face="Verdana" size="2">relationship between the mother’s nutritional state and the</font> <font face="Verdana" size="2">child’ was confirmed by the results from this study, because</font> <font face="Verdana" size="2">besides the highest values for BMI, body fat percentage, and</font> <font face="Verdana" size="2">waist circumference in the obese children’s mother group in</font> <font face="Verdana" size="2">relation to the eutrophic ones, there were found correlation</font> <font face="Verdana" size="2">among all anthropometrical and body composition measures</font> <font face="Verdana" size="2">of the mothers with their children, except for the waist/hip</font> <font face="Verdana" size="2">relationship of the last ones. This discovery reinforces the</font> <font face="Verdana" size="2">idea that the maternal influence on their children’s nutritional</font> <font face="Verdana" size="2">state tends to be superior to the paternal’, just because the</font> <font face="Verdana" size="2">mother’s proximity with the child’s education, as she can</font> <font face="Verdana" size="2">interfere into decision about what the child can eat during</font> <font face="Verdana" size="2">leisure moments, which tend to be similar to the maternal</font> <font face="Verdana" size="2">lifestyle.</font></p>     <p ALIGN="justify" style="word-spacing: 0; line-height: 100%; margin-bottom: 0"><font face="Verdana" size="2">It is not pertinent to disregard the maternal genetic</font> <font face="Verdana" size="2">influence, possibly existing between the maternal obesity and</font> <font face="Verdana" size="2">children’s obesity. According to Maffeis (4), the stronger risk</font> <font face="Verdana" size="2">factor for childhood obesity is still the parents’ obesity, by</font> <font face="Verdana" size="2">occurring as a result from either the genetic map and</font> <font face="Verdana" size="2">environmental influences, as well as the same family</font> <font face="Verdana" size="2">environment between them. However, the influence of the</font> <font face="Verdana" size="2">parents’ nutritional state on their children’s obesity, that is</font> <font face="Verdana" size="2">partly due to genetic components, it is also strongly determined</font> <font face="Verdana" size="2">by the family’s food intake. It is important to emphasize that</font> <font face="Verdana" size="2">the mother’s feeding habit tends to be adopted by the child,</font> <font face="Verdana" size="2">because the mothers are usually more involved into preparation</font> <font face="Verdana" size="2">and choice of the foods (30). Similar resulted were observed</font> <font face="Verdana" size="2">by Nguyen et al. (18) who verified the children’s feeding to</font> <font face="Verdana" size="2">be more similar to the mother’ than to father’. Studies had</font> <font face="Verdana" size="2">observed that maternal overweight (BMI &gt; 25 kg/m2) and</font> <font face="Verdana" size="2">obesity (BMI &gt; 30 kg/m2) was a risk factor for obesity in</font> <font face="Verdana" size="2">children, whereas paternal BMI showed no association (30-</font> <font face="Verdana" size="2">32). Authors had verified that both parents’ overweight (BMI</font> <font face="Verdana" size="2">&gt; 25 kg/m2) and obesity (BMI &gt; 30 kg/m2) were significantly</font> <font face="Verdana" size="2">associated to the obesity in 6 and 7-years old children, and it</font> <font face="Verdana" size="2">should be emphasized that the strength of association between</font> <font face="Verdana" size="2">maternal obesity and the child’s overweight was almost double</font> <font face="Verdana" size="2">the paternal obesity (21,33).</font></p>     <p ALIGN="justify" style="word-spacing: 0; line-height: 100%; margin-bottom: 0"><font face="Verdana" size="2">The success of the obesity treatment in childhood includes</font> <font face="Verdana" size="2">self-monitoring, change in feeding behavior and mainly the</font> <font face="Verdana" size="2">parents’ decreased overweight, what will probably contribute</font> <font face="Verdana" size="2">to the positive modification in the child’ feeding and lifestyle</font> <font face="Verdana" size="2">(34). According to Mossberg (35), the possibility an obese child</font> <font face="Verdana" size="2">to continue presenting obesity will intensively depend on the</font> <font face="Verdana" size="2">obesity level in the family members, especially the mother’.</font> <font face="Verdana" size="2">Kain et al. (36), analyzed the combined influence of the anthropometric</font> <font face="Verdana" size="2">and socioeconomic variables upon childhood</font> <font face="Verdana" size="2">obesity, and observed the maternal obesity to be the factor</font> <font face="Verdana" size="2">showing higher correlation with this nutritional disturbance,</font> <font face="Verdana" size="2">a fact implicating that the actions to preventing the childhoodobesity must involve the mother in the sense she adopts healthy</font> <font face="Verdana" size="2">life habits, therefore being able to transmit them to their children.</font> </p>     <p ALIGN="justify" style="word-spacing: 0; line-height: 100%; margin-bottom: 0"><font face="Verdana" size="2">Concerning to the presence of chronic-degenerative diseases</font> <font face="Verdana" size="2">in close relatives, the results emphasize the influence of</font> <font face="Verdana" size="2">the close relatives who are obese and present dyslipidemia on</font> <font face="Verdana" size="2">the children’s obesity, which occurs exactly because these</font> <font face="Verdana" size="2">children pertain to families with probably inadequate lifestyles,</font> <font face="Verdana" size="2">such as undesirable feeding habits and sedentariness, besides</font> <font face="Verdana" size="2">genetic influence. The modification of the parents’ lifestyle is</font> <font face="Verdana" size="2">important for the treatment of the childhood obesity, mainly</font> <font face="Verdana" size="2">when the child presents genetic tendency. In addition, it is</font> <font face="Verdana" size="2">worth to emphasize that the parents’ example can extend to</font> <font face="Verdana" size="2">other members of the family, therefore favoring the positive</font> <font face="Verdana" size="2">modification of the child’s lifestyle and its permanence</font> <font face="Verdana" size="2">throughout the life, since many children have a tendency to</font> <font face="Verdana" size="2">accompanying their parents, who they usually see as model.</font></p>     <p ALIGN="justify" style="word-spacing: 0; line-height: 100%; margin-bottom: 0"><font face="Verdana" size="2">The family lifestyle, also including the feeding habits, influences</font> <font face="Verdana" size="2">the development of the children’s feeding preferences,</font> <font face="Verdana" size="2">so affecting their body weight. The feeding patterns of those</font> <font face="Verdana" size="2">individuals with excessive adiposity may be explained, at least</font> <font face="Verdana" size="2">partly, by the family’s similar preferences for some foods. The</font> <font face="Verdana" size="2">parent’s lipid intake and body fat are usually associated to</font> <font face="Verdana" size="2">their children’s fat intake and adiposity (18). Shamir et al.</font> <font face="Verdana" size="2">(19) verified those children from which the relatives presented</font> <font face="Verdana" size="2">dyslipidemia showed significantly higher values for total-cholesterol,</font> <font face="Verdana" size="2">LDL, apo-B and triglycerides, compared with the control</font> <font face="Verdana" size="2">group.</font></p>     <p ALIGN="justify" style="word-spacing: 0; line-height: 100%; margin-bottom: 0"><font face="Verdana" size="2">The family obesity history is an independent risk factor</font> <font face="Verdana" size="2">for the increased weight in children (37). Youssef et al. (20),</font> <font face="Verdana" size="2">followed-up either the children whose relatives’ history were</font> <font face="Verdana" size="2">positive for cardiovascular diseases until their adult phase and</font> <font face="Verdana" size="2">children without family history. Those authors observed that</font> <font face="Verdana" size="2">the first children presented higher values for BMI, subscapular</font> <font face="Verdana" size="2">and triceps cutaneous skinfolds since the childhood to adult</font> <font face="Verdana" size="2">phase, and manifested hyperinsulinemia when reached the</font> <font face="Verdana" size="2">adult phase. These observations evidence the important</font> <font face="Verdana" size="2">implication for working the healthiest lifestyle with the family.</font></p>     <p ALIGN="justify" style="word-spacing: 0; line-height: 100%; margin-bottom: 0"><font face="Verdana" size="2">Davison &amp; Birch (38) emphasized the family centralization</font> <font face="Verdana" size="2">in the etiology of the infantile excessive weight, as well</font> <font face="Verdana" size="2">as the need for the parents’ support during the treatment of</font> <font face="Verdana" size="2">obesity in childhood. According to those authors, the risk factors</font> <font face="Verdana" size="2">tend to occur within the family, since parents with excessive</font> <font face="Verdana" size="2">weight tend to practice low physical activities and to consume</font> <font face="Verdana" size="2">higher percent of the total energy value under fat form.</font> <font face="Verdana" size="2">The same may happen in relation to the habits of the family</font> <font face="Verdana" size="2">members presenting chronic-degenerative diseases. It is worth</font> <font face="Verdana" size="2">to emphasize that the children’s lifestyle can be affected by</font> <font face="Verdana" size="2">their close relatives living together in the same environment.</font></p>     <p ALIGN="justify" style="word-spacing: 0; line-height: 100%; margin-bottom: 0"><font face="Verdana" size="2">A limitation of our study is that adiposity was assessed</font> <font face="Verdana" size="2">with anthropometric measurements, which are less accurate</font> <font face="Verdana" size="2">than those of dual-energy X-ray absortiometry (DXA). However,</font> <font face="Verdana" size="2">waist circumference is considered as an appropriate</font> <font face="Verdana" size="2">marker of abdominal obesity in children (39) and the equations</font> <font face="Verdana" size="2">based on skinfold thickness as a good indicator of overall</font> <font face="Verdana" size="2">adiposity (10). Furthermore, it is possible that the reduction</font> <font face="Verdana" size="2">of the sample size of fathers has limited the statistical</font> <font face="Verdana" size="2">significance among the variables. An advantage of this study</font> <font face="Verdana" size="2">was the whole anthropometric evaluation was only conducted</font> <font face="Verdana" size="2">by one of the authors of this study, to avoid possible biases in</font> <font face="Verdana" size="2">checking the measures.</font></p>     <p ALIGN="justify" style="word-spacing: 0; line-height: 100%; margin-bottom: 0"><font face="Verdana" size="2">This study allows to conclude that there are body differences</font> <font face="Verdana" size="2">between the eutrophic and obese children, as evidencing</font> <font face="Verdana" size="2">a higher percent fat in the obese children, which predominates</font> <font face="Verdana" size="2">in their central region, besides presenting higher serum</font> <font face="Verdana" size="2">values for triglycerides. It is important to emphasize the relationship</font> <font face="Verdana" size="2">between the excessive body fat and its central distribution</font> <font face="Verdana" size="2">with the increased lipid profile. Besides, mother’s obesity</font> <font face="Verdana" size="2">is a factor associated to childhood obesity because the</font> <font face="Verdana" size="2">obese mothers with high percent body fat and its accumulation</font> <font face="Verdana" size="2">in the central region present children aged 6 to 8 years</font> <font face="Verdana" size="2">with these characteristics. Though, no differences and/or correlation were found for the fathers’ parameters. The influence</font> <font face="Verdana" size="2">from the obese and dislipidemic close relatives upon children’s</font> <font face="Verdana" size="2">obesity is important to be considered.</font></p>     ]]></body>
<body><![CDATA[<p ALIGN="justify" style="word-spacing: 0; line-height: 100%; margin-bottom: 0"><font face="Verdana" size="2"><b>ACKNOWLEDGEMENTS</b></font></p>     <p ALIGN="justify" style="word-spacing: 0; line-height: 100%; margin-bottom: 0"><font face="Verdana" size="2">The authors thank to Improvement Coordination of Graduate-</font> <font face="Verdana" size="2">Level Staff (CAPES) by the scholarship, to Research Supporting</font> <font face="Verdana" size="2">Foundation of Minas Gerais State (FAPEMIG) by financing</font> <font face="Verdana" size="2">the project, to the Health and Nutrition Department</font> <font face="Verdana" size="2">of Federal University of Viçosa by the support, to the children</font> <font face="Verdana" size="2">and their parents by their participation in this study.</font></p>     <p ALIGN="justify" style="word-spacing: 0; line-height: 100%; margin-bottom: 0"><font face="Verdana" size="2"><b>REFERENCES</b></font></p>     <!-- ref --><p ALIGN="justify" style="word-spacing: 0; line-height: 100%; margin-bottom: 0"><font face="Verdana" size="2">1. Steinberger J, Daniels SR. Obesity, insulin resistance, diabetes,</font> <font face="Verdana" size="2">and cardiovascular risk in children. An American Heart</font> <font face="Verdana" size="2">Association Scientific Statement from the atherosclerosis,</font> <font face="Verdana" size="2">hypertension, and obesity in the young Committee (Council on</font> <font face="Verdana" size="2">cardiovascular disease in the young) and the diabetes Committee</font> <font face="Verdana" size="2">(Council on nutrition, physical activity, and metabolism).</font> <font face="Verdana" size="2">Circulation 2003; 107: 1448-53.</font>&nbsp;&nbsp;&nbsp;&nbsp;&nbsp;&nbsp;&nbsp;&nbsp;[&#160;<a href="javascript:void(0);" onclick="javascript: window.open('/scielo.php?script=sci_nlinks&ref=476954&pid=S0004-0622200700020000600001&lng=','','width=640,height=500,resizable=yes,scrollbars=1,menubar=yes,');">Links</a>&#160;]<!-- end-ref --><!-- ref --><p ALIGN="justify" style="word-spacing: 0; line-height: 100%; margin-bottom: 0"><font face="Verdana" size="2">2. Freedman DS, Dietz WH, Srinivasan SR, Berenson GS. The</font> <font face="Verdana" size="2">relation of overweight to cardiovascular risk factors among</font> <font face="Verdana" size="2">children and adolescents: the Bogalusa Heart Study. Pediatrics</font> <font face="Verdana" size="2">1999; 103: 1175-82.</font>&nbsp;&nbsp;&nbsp;&nbsp;&nbsp;&nbsp;&nbsp;&nbsp;[&#160;<a href="javascript:void(0);" onclick="javascript: window.open('/scielo.php?script=sci_nlinks&ref=476955&pid=S0004-0622200700020000600002&lng=','','width=640,height=500,resizable=yes,scrollbars=1,menubar=yes,');">Links</a>&#160;]<!-- end-ref --><!-- ref --><p ALIGN="justify" style="word-spacing: 0; line-height: 100%; margin-bottom: 0"><font face="Verdana" size="2">3. Gower BA. Syndrome X in children: influence of ethnicity and</font> <font face="Verdana" size="2">visceral fat. Am. J Hum Biol 1999; 11: 249-57.</font>&nbsp;&nbsp;&nbsp;&nbsp;&nbsp;&nbsp;&nbsp;&nbsp;[&#160;<a href="javascript:void(0);" onclick="javascript: window.open('/scielo.php?script=sci_nlinks&ref=476956&pid=S0004-0622200700020000600003&lng=','','width=640,height=500,resizable=yes,scrollbars=1,menubar=yes,');">Links</a>&#160;]<!-- end-ref --><!-- ref --><p ALIGN="justify" style="word-spacing: 0; line-height: 100%; margin-bottom: 0"><font face="Verdana" size="2">4. Maffeis C. Childhood obesity: the genetic-environmental interface.</font> <font face="Verdana" size="2">Baillière’s Clinical Endocrinology and Metabolism</font> <font face="Verdana" size="2">1999; 13: 31-46.</font>&nbsp;&nbsp;&nbsp;&nbsp;&nbsp;&nbsp;&nbsp;&nbsp;[&#160;<a href="javascript:void(0);" onclick="javascript: window.open('/scielo.php?script=sci_nlinks&ref=476957&pid=S0004-0622200700020000600004&lng=','','width=640,height=500,resizable=yes,scrollbars=1,menubar=yes,');">Links</a>&#160;]<!-- end-ref --><!-- ref --><p ALIGN="justify" style="word-spacing: 0; line-height: 100%; margin-bottom: 0"><font face="Verdana" size="2">5. Scaglioni S, Agostoni C, De Notaris R, Radaelli G, Radice N,</font> <font face="Verdana" size="2">Valenti M et al. Early macronutrient intake and overweight at</font> <font face="Verdana" size="2">five years of age. Int J Obes 2000; 24: 777-81.</font>&nbsp;&nbsp;&nbsp;&nbsp;&nbsp;&nbsp;&nbsp;&nbsp;[&#160;<a href="javascript:void(0);" onclick="javascript: window.open('/scielo.php?script=sci_nlinks&ref=476958&pid=S0004-0622200700020000600005&lng=','','width=640,height=500,resizable=yes,scrollbars=1,menubar=yes,');">Links</a>&#160;]<!-- end-ref --><!-- ref --><p ALIGN="justify" style="word-spacing: 0; line-height: 100%; margin-bottom: 0"><font face="Verdana" size="2">6. Reis EC, Kip KE, Marroquin OC, Kiesau M, Hipps L, Peters</font> <font face="Verdana" size="2">RE, Reis SE. Screening children to identify families at increased</font> <font face="Verdana" size="2">risk for cardiovascular disease. Pediatrics 2006; 118:e1789-</font> <font face="Verdana" size="2">e1797.</font>&nbsp;&nbsp;&nbsp;&nbsp;&nbsp;&nbsp;&nbsp;&nbsp;[&#160;<a href="javascript:void(0);" onclick="javascript: window.open('/scielo.php?script=sci_nlinks&ref=476959&pid=S0004-0622200700020000600006&lng=','','width=640,height=500,resizable=yes,scrollbars=1,menubar=yes,');">Links</a>&#160;]<!-- end-ref --><!-- ref --><p ALIGN="justify" style="word-spacing: 0; line-height: 100%; margin-bottom: 0"><font face="Verdana" size="2">7. Center for Disease Control and Prevention / National Center</font> <font face="Verdana" size="2">for Health Statistic. 2000 CDC Growth Charts for the United</font> <font face="Verdana" size="2">States: Methods and Development. Vital and Health Stat 2000;</font> <font face="Verdana" size="2">11 (246).</font>&nbsp;&nbsp;&nbsp;&nbsp;&nbsp;&nbsp;&nbsp;&nbsp;[&#160;<a href="javascript:void(0);" onclick="javascript: window.open('/scielo.php?script=sci_nlinks&ref=476960&pid=S0004-0622200700020000600007&lng=','','width=640,height=500,resizable=yes,scrollbars=1,menubar=yes,');">Links</a>&#160;]<!-- end-ref --><!-- ref --><p ALIGN="justify" style="word-spacing: 0; line-height: 100%; margin-bottom: 0"><font face="Verdana" size="2">8. Must A, Dallal GE, Dietz WH. Reference data for obesity: 85th</font> <font face="Verdana" size="2">and 95th percentiles of body mass index (wt/ht2) and triceps</font> <font face="Verdana" size="2">skinfold thickness. Am J Clin Nutr 1991; 53: 839-46.</font>&nbsp;&nbsp;&nbsp;&nbsp;&nbsp;&nbsp;&nbsp;&nbsp;[&#160;<a href="javascript:void(0);" onclick="javascript: window.open('/scielo.php?script=sci_nlinks&ref=476961&pid=S0004-0622200700020000600008&lng=','','width=640,height=500,resizable=yes,scrollbars=1,menubar=yes,');">Links</a>&#160;]<!-- end-ref --><!-- ref --><p ALIGN="justify" style="word-spacing: 0; line-height: 100%; margin-bottom: 0"><font face="Verdana" size="2">9. Jelliffe DB. Evaluación del estado de nutrición de la comunidad.</font> <font face="Verdana" size="2">Organización Mundial de Salud, Ginebra, 1968. (OMS -</font> <font face="Verdana" size="2">Série de monografías-53).</font>&nbsp;&nbsp;&nbsp;&nbsp;&nbsp;&nbsp;&nbsp;&nbsp;[&#160;<a href="javascript:void(0);" onclick="javascript: window.open('/scielo.php?script=sci_nlinks&ref=476962&pid=S0004-0622200700020000600009&lng=','','width=640,height=500,resizable=yes,scrollbars=1,menubar=yes,');">Links</a>&#160;]<!-- end-ref --><!-- ref --><p ALIGN="justify" style="word-spacing: 0; line-height: 100%; margin-bottom: 0"><font face="Verdana" size="2">10. Slaughter MH, Lohman TG, Boileau RA, Horswill CA, Stillman</font> <font face="Verdana" size="2">RJ, Van Loan MD et al. Skinfold equations for estimation of</font> <font face="Verdana" size="2">body fatness in children and youth. Hum Biol 1988; 60: 709-</font> <font face="Verdana" size="2">23.</font>&nbsp;&nbsp;&nbsp;&nbsp;&nbsp;&nbsp;&nbsp;&nbsp;[&#160;<a href="javascript:void(0);" onclick="javascript: window.open('/scielo.php?script=sci_nlinks&ref=476963&pid=S0004-0622200700020000600010&lng=','','width=640,height=500,resizable=yes,scrollbars=1,menubar=yes,');">Links</a>&#160;]<!-- end-ref --><!-- ref --><p ALIGN="justify" style="word-spacing: 0; line-height: 100%; margin-bottom: 0"><font face="Verdana" size="2">11. Lohman TG. Measuring body fat using skinfolds. Champaign,</font> <font face="Verdana" size="2">IL: Human Kinetics, 1987.</font>&nbsp;&nbsp;&nbsp;&nbsp;&nbsp;&nbsp;&nbsp;&nbsp;[&#160;<a href="javascript:void(0);" onclick="javascript: window.open('/scielo.php?script=sci_nlinks&ref=476964&pid=S0004-0622200700020000600011&lng=','','width=640,height=500,resizable=yes,scrollbars=1,menubar=yes,');">Links</a>&#160;]<!-- end-ref --><!-- ref --><p ALIGN="justify" style="word-spacing: 0; line-height: 100%; margin-bottom: 0"><font face="Verdana" size="2">12. World Health Organization. Iron deficiency anaemia. Assessment,</font> <font face="Verdana" size="2">prevention and control. A guide for programme managers.</font> <font face="Verdana" size="2">Geneva: WHO, 2001.</font>&nbsp;&nbsp;&nbsp;&nbsp;&nbsp;&nbsp;&nbsp;&nbsp;[&#160;<a href="javascript:void(0);" onclick="javascript: window.open('/scielo.php?script=sci_nlinks&ref=476965&pid=S0004-0622200700020000600012&lng=','','width=640,height=500,resizable=yes,scrollbars=1,menubar=yes,');">Links</a>&#160;]<!-- end-ref --><!-- ref --><p ALIGN="justify" style="word-spacing: 0; line-height: 100%; margin-bottom: 0"><font face="Verdana" size="2">13. American Academy of Pediatrics. National cholesterol education</font> <font face="Verdana" size="2">program: report of the expert panel on blood cholesterol</font> <font face="Verdana" size="2">levels in children and adolescents. Pediatrics 1992; 89: S495-</font> <font face="Verdana" size="2">S584.</font>&nbsp;&nbsp;&nbsp;&nbsp;&nbsp;&nbsp;&nbsp;&nbsp;[&#160;<a href="javascript:void(0);" onclick="javascript: window.open('/scielo.php?script=sci_nlinks&ref=476966&pid=S0004-0622200700020000600013&lng=','','width=640,height=500,resizable=yes,scrollbars=1,menubar=yes,');">Links</a>&#160;]<!-- end-ref --><!-- ref --><p ALIGN="justify" style="word-spacing: 0; line-height: 100%; margin-bottom: 0"><font face="Verdana" size="2">14. American Diabetes Association. Diagnosis and classification</font> <font face="Verdana" size="2">of diabetes mellitus. Diabetes Care 2004; 27 (Suppl.): S5-S10.</font>&nbsp;&nbsp;&nbsp;&nbsp;&nbsp;&nbsp;&nbsp;&nbsp;[&#160;<a href="javascript:void(0);" onclick="javascript: window.open('/scielo.php?script=sci_nlinks&ref=476967&pid=S0004-0622200700020000600014&lng=','','width=640,height=500,resizable=yes,scrollbars=1,menubar=yes,');">Links</a>&#160;]<!-- end-ref --><!-- ref --><p ALIGN="justify" style="word-spacing: 0; line-height: 100%; margin-bottom: 0"><font face="Verdana" size="2">15. World Health Organization. Obesity – Preventing and managing</font> <font face="Verdana" size="2">the global epidemic. Geneva, WHO, 1998 (Report of a</font> <font face="Verdana" size="2">WHO Consultation on Obesity).</font>&nbsp;&nbsp;&nbsp;&nbsp;&nbsp;&nbsp;&nbsp;&nbsp;[&#160;<a href="javascript:void(0);" onclick="javascript: window.open('/scielo.php?script=sci_nlinks&ref=476968&pid=S0004-0622200700020000600015&lng=','','width=640,height=500,resizable=yes,scrollbars=1,menubar=yes,');">Links</a>&#160;]<!-- end-ref --><!-- ref --><p ALIGN="justify" style="word-spacing: 0; line-height: 100%; margin-bottom: 0"><font face="Verdana" size="2">16. Lohman TG. Advances in body composition assessment. Current</font> <font face="Verdana" size="2">issues in exercise science series. Monograph nº 3.</font> <font face="Verdana" size="2">Champaign, IL: Human Kinetics, 1992.</font>&nbsp;&nbsp;&nbsp;&nbsp;&nbsp;&nbsp;&nbsp;&nbsp;[&#160;<a href="javascript:void(0);" onclick="javascript: window.open('/scielo.php?script=sci_nlinks&ref=476969&pid=S0004-0622200700020000600016&lng=','','width=640,height=500,resizable=yes,scrollbars=1,menubar=yes,');">Links</a>&#160;]<!-- end-ref --><!-- ref --><p ALIGN="justify" style="word-spacing: 0; line-height: 100%; margin-bottom: 0"><font face="Verdana" size="2">17. Heyward VH, Stolarczyk LM. Avaliação da composição corporal</font> <font face="Verdana" size="2">aplicada. São Paulo: MANOLE; 2000. 243p.</font>&nbsp;&nbsp;&nbsp;&nbsp;&nbsp;&nbsp;&nbsp;&nbsp;[&#160;<a href="javascript:void(0);" onclick="javascript: window.open('/scielo.php?script=sci_nlinks&ref=476970&pid=S0004-0622200700020000600017&lng=','','width=640,height=500,resizable=yes,scrollbars=1,menubar=yes,');">Links</a>&#160;]<!-- end-ref --><!-- ref --><p ALIGN="justify" style="word-spacing: 0; line-height: 100%; margin-bottom: 0"><font face="Verdana" size="2">18. Nguyen VT, Larson DE, Johnson RK, Goran MI. Fat intake</font> <font face="Verdana" size="2">and adiposity in children of lean and obese parents. Am J Clin</font> <font face="Verdana" size="2">Nutr 1996; 63: 507-13.</font>&nbsp;&nbsp;&nbsp;&nbsp;&nbsp;&nbsp;&nbsp;&nbsp;[&#160;<a href="javascript:void(0);" onclick="javascript: window.open('/scielo.php?script=sci_nlinks&ref=476971&pid=S0004-0622200700020000600018&lng=','','width=640,height=500,resizable=yes,scrollbars=1,menubar=yes,');">Links</a>&#160;]<!-- end-ref --><!-- ref --><p ALIGN="justify" style="word-spacing: 0; line-height: 100%; margin-bottom: 0"><font face="Verdana" size="2">19. Shamir R, Tershakovec AM, Gallagher PR, Liacouras CA,</font> <font face="Verdana" size="2">Hayman LL, Cortner JA. The influence of age and relative</font> <font face="Verdana" size="2">weight on the presentation of familial combined hyperlipidemia</font> <font face="Verdana" size="2">in childhood. Atherosclerosis 1996; 121: 85-91.</font>&nbsp;&nbsp;&nbsp;&nbsp;&nbsp;&nbsp;&nbsp;&nbsp;[&#160;<a href="javascript:void(0);" onclick="javascript: window.open('/scielo.php?script=sci_nlinks&ref=476972&pid=S0004-0622200700020000600019&lng=','','width=640,height=500,resizable=yes,scrollbars=1,menubar=yes,');">Links</a>&#160;]<!-- end-ref --><!-- ref --><p ALIGN="justify" style="word-spacing: 0; line-height: 100%; margin-bottom: 0"><font face="Verdana" size="2">20. Youssef AA, Valdez R, Elkasabany A, Srinivasan SR, Berenson</font> <font face="Verdana" size="2">GS. Time-course of adiposity and fasting insulin from childhood</font> <font face="Verdana" size="2">to young adulthood in offspring of parents with coronary</font> <font face="Verdana" size="2">artery disease: The Bogalusa Heart Study. Ann Epidemiol</font> <font face="Verdana" size="2">2002; 12: 553-9.</font>&nbsp;&nbsp;&nbsp;&nbsp;&nbsp;&nbsp;&nbsp;&nbsp;[&#160;<a href="javascript:void(0);" onclick="javascript: window.open('/scielo.php?script=sci_nlinks&ref=476973&pid=S0004-0622200700020000600020&lng=','','width=640,height=500,resizable=yes,scrollbars=1,menubar=yes,');">Links</a>&#160;]<!-- end-ref --><!-- ref --><p ALIGN="justify" style="word-spacing: 0; line-height: 100%; margin-bottom: 0"><font face="Verdana" size="2">21. Hui LL, Nelson EAS, Yu LM, Li AM, Fok TF. Risk factors for</font> <font face="Verdana" size="2">childhood overweight in 6- to 7-y-old Hong Kong children.</font> <font face="Verdana" size="2">Int J Obes 2003; 27: 1411-8.</font>&nbsp;&nbsp;&nbsp;&nbsp;&nbsp;&nbsp;&nbsp;&nbsp;[&#160;<a href="javascript:void(0);" onclick="javascript: window.open('/scielo.php?script=sci_nlinks&ref=476974&pid=S0004-0622200700020000600021&lng=','','width=640,height=500,resizable=yes,scrollbars=1,menubar=yes,');">Links</a>&#160;]<!-- end-ref --><!-- ref --><p ALIGN="justify" style="word-spacing: 0; line-height: 100%; margin-bottom: 0"><font face="Verdana" size="2">22. Gulliford MC, Mahabir D, Rocke B, Chinn S, Rona R. Overweight,</font> <font face="Verdana" size="2">obesity and skinfold thicknesses of children of African</font> <font face="Verdana" size="2">or Indian descent in Trinidad and Tobago. Int J Epidemiol</font> <font face="Verdana" size="2">2001; 30: 989-98.</font>&nbsp;&nbsp;&nbsp;&nbsp;&nbsp;&nbsp;&nbsp;&nbsp;[&#160;<a href="javascript:void(0);" onclick="javascript: window.open('/scielo.php?script=sci_nlinks&ref=476975&pid=S0004-0622200700020000600022&lng=','','width=640,height=500,resizable=yes,scrollbars=1,menubar=yes,');">Links</a>&#160;]<!-- end-ref --><!-- ref --><p ALIGN="justify" style="word-spacing: 0; line-height: 100%; margin-bottom: 0"><font face="Verdana" size="2">23. Garn SM, Clark DC. Nutrition, growth, development, and</font> <font face="Verdana" size="2">maturation: findings from the ten-state nutrition survey of 1968-</font> <font face="Verdana" size="2">1970. Pediatrics 1975; 56: 306-19.</font>&nbsp;&nbsp;&nbsp;&nbsp;&nbsp;&nbsp;&nbsp;&nbsp;[&#160;<a href="javascript:void(0);" onclick="javascript: window.open('/scielo.php?script=sci_nlinks&ref=476976&pid=S0004-0622200700020000600023&lng=','','width=640,height=500,resizable=yes,scrollbars=1,menubar=yes,');">Links</a>&#160;]<!-- end-ref --><!-- ref --><p ALIGN="justify" style="word-spacing: 0; line-height: 100%; margin-bottom: 0"><font face="Verdana" size="2">24. Mamalakis G, Kafatos A, Manios Y, Kalogeropoulos N,</font> <font face="Verdana" size="2">Andrikopoulos N. Adipose fat quality vs. quantity: relationships</font> <font face="Verdana" size="2">with children’s serum lipid levels. Prev Med 2001; 33:</font> <font face="Verdana" size="2">525-35.</font>&nbsp;&nbsp;&nbsp;&nbsp;&nbsp;&nbsp;&nbsp;&nbsp;[&#160;<a href="javascript:void(0);" onclick="javascript: window.open('/scielo.php?script=sci_nlinks&ref=476977&pid=S0004-0622200700020000600024&lng=','','width=640,height=500,resizable=yes,scrollbars=1,menubar=yes,');">Links</a>&#160;]<!-- end-ref --><!-- ref --><p ALIGN="justify" style="word-spacing: 0; line-height: 100%; margin-bottom: 0"><font face="Verdana" size="2">25. Arner P. Differences in lipolysis between human subcutaneous</font> <font face="Verdana" size="2">and omental adipose tissues. Ann Med 1995; 27: 435-8.</font>&nbsp;&nbsp;&nbsp;&nbsp;&nbsp;&nbsp;&nbsp;&nbsp;[&#160;<a href="javascript:void(0);" onclick="javascript: window.open('/scielo.php?script=sci_nlinks&ref=476978&pid=S0004-0622200700020000600025&lng=','','width=640,height=500,resizable=yes,scrollbars=1,menubar=yes,');">Links</a>&#160;]<!-- end-ref --><!-- ref --><p ALIGN="justify" style="word-spacing: 0; line-height: 100%; margin-bottom: 0"><font face="Verdana" size="2">26. Bjorntorp P. Abdominal fat distribution and the metabolic syndrome.</font> <font face="Verdana" size="2">J Cardiovasc Pharmacol 1992; 20 (Suppl 8): S26-S28.</font>&nbsp;&nbsp;&nbsp;&nbsp;&nbsp;&nbsp;&nbsp;&nbsp;[&#160;<a href="javascript:void(0);" onclick="javascript: window.open('/scielo.php?script=sci_nlinks&ref=476979&pid=S0004-0622200700020000600026&lng=','','width=640,height=500,resizable=yes,scrollbars=1,menubar=yes,');">Links</a>&#160;]<!-- end-ref --><!-- ref --><p ALIGN="justify" style="word-spacing: 0; line-height: 100%; margin-bottom: 0"><font face="Verdana" size="2">27. Sheehan MT, Jensen MD. Metabolic complications of obesity.</font> <font face="Verdana" size="2">Med Clin North Am 2000; 84: 363-85.</font>&nbsp;&nbsp;&nbsp;&nbsp;&nbsp;&nbsp;&nbsp;&nbsp;[&#160;<a href="javascript:void(0);" onclick="javascript: window.open('/scielo.php?script=sci_nlinks&ref=476980&pid=S0004-0622200700020000600027&lng=','','width=640,height=500,resizable=yes,scrollbars=1,menubar=yes,');">Links</a>&#160;]<!-- end-ref --><!-- ref --><p ALIGN="justify" style="word-spacing: 0; line-height: 100%; margin-bottom: 0"><font face="Verdana" size="2">28. Botton J, Heude B, Kettaneh A, Borys J-M, Lommez A, Bresson</font> <font face="Verdana" size="2">J-L, Ducimetiere P, Charles M-A, the FLVS Study Group.</font> <font face="Verdana" size="2">Cardiovascular risk factor levels and their relationships with</font> <font face="Verdana" size="2">overweight and fat distribution in children: The Fleurbaix</font> <font face="Verdana" size="2">Laventie Ville Santé II study. Metabolism Clinical and Experimental</font> <font face="Verdana" size="2">2007;56:614-22.</font>&nbsp;&nbsp;&nbsp;&nbsp;&nbsp;&nbsp;&nbsp;&nbsp;[&#160;<a href="javascript:void(0);" onclick="javascript: window.open('/scielo.php?script=sci_nlinks&ref=476981&pid=S0004-0622200700020000600028&lng=','','width=640,height=500,resizable=yes,scrollbars=1,menubar=yes,');">Links</a>&#160;]<!-- end-ref --><!-- ref --><p ALIGN="justify" style="word-spacing: 0; line-height: 100%; margin-bottom: 0"><font face="Verdana" size="2">29. Asato Y, Katsuren K, Ohshiro T, Kikawa K, Shimabukuro T,</font> <font face="Verdana" size="2">Ohta T. Relationship between lipid abnormalities and insulin</font> <font face="Verdana" size="2">resistance in Japanese school children. Arterioscler Thromb</font> <font face="Verdana" size="2">Vasc Biol 2006;26:2781-6.</font>&nbsp;&nbsp;&nbsp;&nbsp;&nbsp;&nbsp;&nbsp;&nbsp;[&#160;<a href="javascript:void(0);" onclick="javascript: window.open('/scielo.php?script=sci_nlinks&ref=476982&pid=S0004-0622200700020000600029&lng=','','width=640,height=500,resizable=yes,scrollbars=1,menubar=yes,');">Links</a>&#160;]<!-- end-ref --><!-- ref --><p ALIGN="justify" style="word-spacing: 0; line-height: 100%; margin-bottom: 0"><font face="Verdana" size="2">30. Marins VMR, Almeida RMVR, Pereira RA, Barros MBA. The</font> <font face="Verdana" size="2">relationship between parental nutritional status and overweight</font> <font face="Verdana" size="2">children/adolescents in Rio de Janeiro, Brazil. Public Health</font> <font face="Verdana" size="2">2004; 118: 43-9.</font>&nbsp;&nbsp;&nbsp;&nbsp;&nbsp;&nbsp;&nbsp;&nbsp;[&#160;<a href="javascript:void(0);" onclick="javascript: window.open('/scielo.php?script=sci_nlinks&ref=476983&pid=S0004-0622200700020000600030&lng=','','width=640,height=500,resizable=yes,scrollbars=1,menubar=yes,');">Links</a>&#160;]<!-- end-ref --><!-- ref --><p ALIGN="justify" style="word-spacing: 0; line-height: 100%; margin-bottom: 0"><font face="Verdana" size="2">31. Johannsen DL, Johannsen NM, Specker BL. Influence of parents’</font> <font face="Verdana" size="2">eating behaviors and child feeding practices in children’s</font> <font face="Verdana" size="2">weight status. Obesity 2006;14(3):431-9.</font>&nbsp;&nbsp;&nbsp;&nbsp;&nbsp;&nbsp;&nbsp;&nbsp;[&#160;<a href="javascript:void(0);" onclick="javascript: window.open('/scielo.php?script=sci_nlinks&ref=476984&pid=S0004-0622200700020000600031&lng=','','width=640,height=500,resizable=yes,scrollbars=1,menubar=yes,');">Links</a>&#160;]<!-- end-ref --><!-- ref --><p ALIGN="justify" style="word-spacing: 0; line-height: 100%; margin-bottom: 0"><font face="Verdana" size="2">32. Psarra G, Nassis GP, Sidossis LS. Short-term predictors of</font> <font face="Verdana" size="2">abdominal obesity in children. Eur J Public Health</font> <font face="Verdana" size="2">2005;16(5):520-5.</font>&nbsp;&nbsp;&nbsp;&nbsp;&nbsp;&nbsp;&nbsp;&nbsp;[&#160;<a href="javascript:void(0);" onclick="javascript: window.open('/scielo.php?script=sci_nlinks&ref=476985&pid=S0004-0622200700020000600032&lng=','','width=640,height=500,resizable=yes,scrollbars=1,menubar=yes,');">Links</a>&#160;]<!-- end-ref --><!-- ref --><p ALIGN="justify" style="word-spacing: 0; line-height: 100%; margin-bottom: 0"><font face="Verdana" size="2">33. Reilly JJ, Armstrong J, Dorosty AR, Emmett PM, Ness A,</font> <font face="Verdana" size="2">Rogers I, Steer C, Sherriff A, the Avon Longitudinal Study of</font> <font face="Verdana" size="2">Parents and Children Study Team. Early life factors for obesity</font> <font face="Verdana" size="2">in childhood: cohort study. BMJ 2005;330:1357-64.</font>&nbsp;&nbsp;&nbsp;&nbsp;&nbsp;&nbsp;&nbsp;&nbsp;[&#160;<a href="javascript:void(0);" onclick="javascript: window.open('/scielo.php?script=sci_nlinks&ref=476986&pid=S0004-0622200700020000600033&lng=','','width=640,height=500,resizable=yes,scrollbars=1,menubar=yes,');">Links</a>&#160;]<!-- end-ref --><!-- ref --><p ALIGN="justify" style="word-spacing: 0; line-height: 100%; margin-bottom: 0"><font face="Verdana" size="2">34. Epstein LH, Mccurley J, Wing RR, Valoski A. Five-year follow-</font> <font face="Verdana" size="2">up of family-based behavioral treatments for childhood</font> <font face="Verdana" size="2">obesity. J. Consult. Clin Psychol 1990; 58: 661-4.</font>&nbsp;&nbsp;&nbsp;&nbsp;&nbsp;&nbsp;&nbsp;&nbsp;[&#160;<a href="javascript:void(0);" onclick="javascript: window.open('/scielo.php?script=sci_nlinks&ref=476987&pid=S0004-0622200700020000600034&lng=','','width=640,height=500,resizable=yes,scrollbars=1,menubar=yes,');">Links</a>&#160;]<!-- end-ref --><!-- ref --><p ALIGN="justify" style="word-spacing: 0; line-height: 100%; margin-bottom: 0"><font face="Verdana" size="2">35. Mossberg H-O. 40-year follow-up of overweight children. Lancet</font> <font face="Verdana" size="2">1989; 26: 491-3.</font>&nbsp;&nbsp;&nbsp;&nbsp;&nbsp;&nbsp;&nbsp;&nbsp;[&#160;<a href="javascript:void(0);" onclick="javascript: window.open('/scielo.php?script=sci_nlinks&ref=476988&pid=S0004-0622200700020000600035&lng=','','width=640,height=500,resizable=yes,scrollbars=1,menubar=yes,');">Links</a>&#160;]<!-- end-ref --><!-- ref --><p ALIGN="justify" style="word-spacing: 0; line-height: 100%; margin-bottom: 0"><font face="Verdana" size="2">36. Kain J, Albala C, García F, Andrade M. Obesidad en el</font> <font face="Verdana" size="2">preescolar: evolución antropométrica y determinantes</font> <font face="Verdana" size="2">socioeconómicos. Rev Med Chil 1998; 126: 271-8.</font>&nbsp;&nbsp;&nbsp;&nbsp;&nbsp;&nbsp;&nbsp;&nbsp;[&#160;<a href="javascript:void(0);" onclick="javascript: window.open('/scielo.php?script=sci_nlinks&ref=476989&pid=S0004-0622200700020000600036&lng=','','width=640,height=500,resizable=yes,scrollbars=1,menubar=yes,');">Links</a>&#160;]<!-- end-ref --><!-- ref --><p ALIGN="justify" style="word-spacing: 0; line-height: 100%; margin-bottom: 0"><font face="Verdana" size="2">37. Klesges RC, Klesges LM, Eck LH, Shelton ML. A longitudinal</font> <font face="Verdana" size="2">analysis of accelerated weight gain in preschool children.</font> <font face="Verdana" size="2">Pediatrics 1995; 95: 126-30.</font>&nbsp;&nbsp;&nbsp;&nbsp;&nbsp;&nbsp;&nbsp;&nbsp;[&#160;<a href="javascript:void(0);" onclick="javascript: window.open('/scielo.php?script=sci_nlinks&ref=476990&pid=S0004-0622200700020000600037&lng=','','width=640,height=500,resizable=yes,scrollbars=1,menubar=yes,');">Links</a>&#160;]<!-- end-ref --><!-- ref --><p ALIGN="justify" style="word-spacing: 0; line-height: 100%; margin-bottom: 0"><font face="Verdana" size="2">38. Davison KK, Birch LL. Child and parent characteristics as predictors</font> <font face="Verdana" size="2">of change in girls’ body mass index. Int J Obes 2001;</font> <font face="Verdana" size="2">25: 1834-42.</font>&nbsp;&nbsp;&nbsp;&nbsp;&nbsp;&nbsp;&nbsp;&nbsp;[&#160;<a href="javascript:void(0);" onclick="javascript: window.open('/scielo.php?script=sci_nlinks&ref=476991&pid=S0004-0622200700020000600038&lng=','','width=640,height=500,resizable=yes,scrollbars=1,menubar=yes,');">Links</a>&#160;]<!-- end-ref --><!-- ref --><p ALIGN="justify" style="word-spacing: 0; line-height: 100%; margin-bottom: 0"><font face="Verdana" size="2">39. McCarthy HD, Jarrett KV, Crawley HF. The development of</font> <font face="Verdana" size="2">waist circumference percentiles in British children aged 5.0-</font> <font face="Verdana" size="2">16.9 y. Eur J Clin Nutr 2001; 55:902-7.</font>&nbsp;&nbsp;&nbsp;&nbsp;&nbsp;&nbsp;&nbsp;&nbsp;[&#160;<a href="javascript:void(0);" onclick="javascript: window.open('/scielo.php?script=sci_nlinks&ref=476992&pid=S0004-0622200700020000600039&lng=','','width=640,height=500,resizable=yes,scrollbars=1,menubar=yes,');">Links</a>&#160;]<!-- end-ref --> ]]></body>
<back>
<ref-list>
<ref id="B1">
<label>1</label><nlm-citation citation-type="journal">
<person-group person-group-type="author">
<name>
<surname><![CDATA[Steinberger]]></surname>
<given-names><![CDATA[J]]></given-names>
</name>
<name>
<surname><![CDATA[Daniels]]></surname>
<given-names><![CDATA[SR]]></given-names>
</name>
</person-group>
<article-title xml:lang="en"><![CDATA[Obesity, insulin resistance, diabetes, and cardiovascular risk in children: An American Heart Association Scientific Statement from the atherosclerosis, hypertension, and obesity in the young Committee (Council on cardiovascular disease in the young) and the diabetes Committee (Council on nutrition, physical activity, and metabolism)]]></article-title>
<source><![CDATA[Circulation]]></source>
<year>2003</year>
<volume>107</volume>
<page-range>1448-53</page-range></nlm-citation>
</ref>
<ref id="B2">
<label>2</label><nlm-citation citation-type="journal">
<person-group person-group-type="author">
<name>
<surname><![CDATA[Freedman]]></surname>
<given-names><![CDATA[DS]]></given-names>
</name>
<name>
<surname><![CDATA[Dietz]]></surname>
<given-names><![CDATA[WH]]></given-names>
</name>
<name>
<surname><![CDATA[Srinivasan]]></surname>
<given-names><![CDATA[SR]]></given-names>
</name>
<name>
<surname><![CDATA[Berenson]]></surname>
<given-names><![CDATA[GS]]></given-names>
</name>
</person-group>
<article-title xml:lang="en"><![CDATA[The relation of overweight to cardiovascular risk factors among children and adolescents: the Bogalusa Heart Study]]></article-title>
<source><![CDATA[Pediatrics]]></source>
<year>1999</year>
<volume>103</volume>
<page-range>1175-82</page-range></nlm-citation>
</ref>
<ref id="B3">
<label>3</label><nlm-citation citation-type="journal">
<person-group person-group-type="author">
<name>
<surname><![CDATA[Gower]]></surname>
<given-names><![CDATA[BA]]></given-names>
</name>
</person-group>
<article-title xml:lang="en"><![CDATA[Syndrome X in children: influence of ethnicity and visceral fat]]></article-title>
<source><![CDATA[Am. J Hum Biol]]></source>
<year>1999</year>
<volume>11</volume>
<page-range>249-57</page-range></nlm-citation>
</ref>
<ref id="B4">
<label>4</label><nlm-citation citation-type="journal">
<person-group person-group-type="author">
<name>
<surname><![CDATA[Maffeis]]></surname>
<given-names><![CDATA[C]]></given-names>
</name>
</person-group>
<article-title xml:lang="en"><![CDATA[Childhood obesity: the genetic-environmental interface]]></article-title>
<source><![CDATA[Baillière’s Clinical Endocrinology and Metabolism]]></source>
<year>1999</year>
<volume>13</volume>
<page-range>31-46</page-range></nlm-citation>
</ref>
<ref id="B5">
<label>5</label><nlm-citation citation-type="journal">
<person-group person-group-type="author">
<name>
<surname><![CDATA[Scaglioni]]></surname>
<given-names><![CDATA[S]]></given-names>
</name>
<name>
<surname><![CDATA[Agostoni]]></surname>
<given-names><![CDATA[C]]></given-names>
</name>
<name>
<surname><![CDATA[De Notaris]]></surname>
<given-names><![CDATA[R]]></given-names>
</name>
<name>
<surname><![CDATA[Radaelli]]></surname>
<given-names><![CDATA[G]]></given-names>
</name>
<name>
<surname><![CDATA[Radice]]></surname>
<given-names><![CDATA[N]]></given-names>
</name>
<name>
<surname><![CDATA[Valenti]]></surname>
<given-names><![CDATA[M]]></given-names>
</name>
</person-group>
<article-title xml:lang="en"><![CDATA[Early macronutrient intake and overweight at five years of age]]></article-title>
<source><![CDATA[Int J Obes]]></source>
<year>2000</year>
<volume>24</volume>
<page-range>777-81</page-range></nlm-citation>
</ref>
<ref id="B6">
<label>6</label><nlm-citation citation-type="journal">
<person-group person-group-type="author">
<name>
<surname><![CDATA[Reis]]></surname>
<given-names><![CDATA[EC]]></given-names>
</name>
<name>
<surname><![CDATA[Kip]]></surname>
<given-names><![CDATA[KE]]></given-names>
</name>
<name>
<surname><![CDATA[Marroquin]]></surname>
<given-names><![CDATA[OC]]></given-names>
</name>
<name>
<surname><![CDATA[Kiesau]]></surname>
<given-names><![CDATA[M]]></given-names>
</name>
<name>
<surname><![CDATA[Hipps]]></surname>
<given-names><![CDATA[L]]></given-names>
</name>
<name>
<surname><![CDATA[Peters]]></surname>
<given-names><![CDATA[RE]]></given-names>
</name>
<name>
<surname><![CDATA[Reis]]></surname>
<given-names><![CDATA[SE]]></given-names>
</name>
</person-group>
<article-title xml:lang="en"><![CDATA[Screening children to identify families at increased risk for cardiovascular disease]]></article-title>
<source><![CDATA[Pediatrics]]></source>
<year>2006</year>
<volume>118</volume>
<page-range>e1789- e1797</page-range></nlm-citation>
</ref>
<ref id="B7">
<label>7</label><nlm-citation citation-type="book">
<collab>Center for Disease Control and Prevention / National Center for Health Statistic</collab>
<source><![CDATA[CDC Growth Charts for the United States: Methods and Development]]></source>
<year>2000</year>
<volume>11</volume>
<page-range>246</page-range><publisher-name><![CDATA[Vital and Health Stat 2000]]></publisher-name>
</nlm-citation>
</ref>
<ref id="B8">
<label>8</label><nlm-citation citation-type="journal">
<person-group person-group-type="author">
<name>
<surname><![CDATA[Must]]></surname>
<given-names><![CDATA[A]]></given-names>
</name>
<name>
<surname><![CDATA[Dallal]]></surname>
<given-names><![CDATA[GE]]></given-names>
</name>
<name>
<surname><![CDATA[Dietz]]></surname>
<given-names><![CDATA[WH]]></given-names>
</name>
</person-group>
<article-title xml:lang="en"><![CDATA[Reference data for obesity: 85th and 95th percentiles of body mass index (wt/ht2) and triceps skinfold thickness]]></article-title>
<source><![CDATA[Am J Clin Nutr]]></source>
<year>1991</year>
<volume>53</volume>
<page-range>839-46</page-range></nlm-citation>
</ref>
<ref id="B9">
<label>9</label><nlm-citation citation-type="book">
<person-group person-group-type="author">
<name>
<surname><![CDATA[Jelliffe]]></surname>
<given-names><![CDATA[DB]]></given-names>
</name>
</person-group>
<source><![CDATA[Evaluación del estado de nutrición de la comunidad]]></source>
<year>1968</year>
<publisher-loc><![CDATA[Ginebra ]]></publisher-loc>
<publisher-name><![CDATA[Organización Mundial de Salud]]></publisher-name>
</nlm-citation>
</ref>
<ref id="B10">
<label>10</label><nlm-citation citation-type="journal">
<person-group person-group-type="author">
<name>
<surname><![CDATA[Slaughter]]></surname>
<given-names><![CDATA[MH]]></given-names>
</name>
<name>
<surname><![CDATA[Lohman]]></surname>
<given-names><![CDATA[TG]]></given-names>
</name>
<name>
<surname><![CDATA[Boileau]]></surname>
<given-names><![CDATA[RA]]></given-names>
</name>
<name>
<surname><![CDATA[Horswill]]></surname>
<given-names><![CDATA[CA]]></given-names>
</name>
<name>
<surname><![CDATA[Stillman]]></surname>
<given-names><![CDATA[RJ]]></given-names>
</name>
<name>
<surname><![CDATA[Van Loan]]></surname>
<given-names><![CDATA[MD]]></given-names>
</name>
</person-group>
<article-title xml:lang="en"><![CDATA[Skinfold equations for estimation of body fatness in children and youth]]></article-title>
<source><![CDATA[Hum Biol]]></source>
<year>1988</year>
<volume>60</volume>
<page-range>709- 23</page-range></nlm-citation>
</ref>
<ref id="B11">
<label>11</label><nlm-citation citation-type="book">
<person-group person-group-type="author">
<name>
<surname><![CDATA[Lohman]]></surname>
<given-names><![CDATA[TG]]></given-names>
</name>
</person-group>
<source><![CDATA[Measuring body fat using skinfolds]]></source>
<year>1987</year>
<publisher-loc><![CDATA[Champaign ]]></publisher-loc>
<publisher-name><![CDATA[Human Kinetics]]></publisher-name>
</nlm-citation>
</ref>
<ref id="B12">
<label>12</label><nlm-citation citation-type="book">
<collab>World Health Organization</collab>
<source><![CDATA[Iron deficiency anaemia. Assessment, prevention and control: A guide for programme managers]]></source>
<year>2001</year>
<publisher-loc><![CDATA[Geneva ]]></publisher-loc>
<publisher-name><![CDATA[WHO]]></publisher-name>
</nlm-citation>
</ref>
<ref id="B13">
<label>13</label><nlm-citation citation-type="journal">
<collab>American Academy of Pediatrics</collab>
<article-title xml:lang="en"><![CDATA[National cholesterol education program: report of the expert panel on blood cholesterol levels in children and adolescents]]></article-title>
<source><![CDATA[Pediatrics]]></source>
<year>1992</year>
<volume>89</volume>
<page-range>S495- S584</page-range></nlm-citation>
</ref>
<ref id="B14">
<label>14</label><nlm-citation citation-type="journal">
<collab>American Diabetes Association</collab>
<article-title xml:lang="en"><![CDATA[Diagnosis and classification of diabetes mellitus]]></article-title>
<source><![CDATA[Diabetes Care]]></source>
<year>2004</year>
<volume>27</volume>
<page-range>S5-S10</page-range></nlm-citation>
</ref>
<ref id="B15">
<label>15</label><nlm-citation citation-type="book">
<collab>World Health Organization</collab>
<source><![CDATA[Obesity - Preventing and managing the global epidemic]]></source>
<year>1998</year>
<publisher-loc><![CDATA[Geneva ]]></publisher-loc>
<publisher-name><![CDATA[WHO]]></publisher-name>
</nlm-citation>
</ref>
<ref id="B16">
<label>16</label><nlm-citation citation-type="book">
<person-group person-group-type="author">
<name>
<surname><![CDATA[Lohman]]></surname>
<given-names><![CDATA[TG]]></given-names>
</name>
</person-group>
<source><![CDATA[Advances in body composition assessment: Current issues in exercise science series. Monograph nº 3]]></source>
<year>1992</year>
<publisher-loc><![CDATA[Champaign ]]></publisher-loc>
<publisher-name><![CDATA[Human Kinetics]]></publisher-name>
</nlm-citation>
</ref>
<ref id="B17">
<label>17</label><nlm-citation citation-type="book">
<person-group person-group-type="author">
<name>
<surname><![CDATA[Heyward]]></surname>
<given-names><![CDATA[VH]]></given-names>
</name>
<name>
<surname><![CDATA[Stolarczyk]]></surname>
<given-names><![CDATA[LM]]></given-names>
</name>
</person-group>
<source><![CDATA[Avaliação da composição corporal aplicada]]></source>
<year>2000</year>
<page-range>243</page-range><publisher-loc><![CDATA[São Paulo ]]></publisher-loc>
<publisher-name><![CDATA[MANOLE]]></publisher-name>
</nlm-citation>
</ref>
<ref id="B18">
<label>18</label><nlm-citation citation-type="journal">
<person-group person-group-type="author">
<name>
<surname><![CDATA[Nguyen]]></surname>
<given-names><![CDATA[VT]]></given-names>
</name>
<name>
<surname><![CDATA[Larson]]></surname>
<given-names><![CDATA[DE]]></given-names>
</name>
<name>
<surname><![CDATA[Johnson]]></surname>
<given-names><![CDATA[RK]]></given-names>
</name>
<name>
<surname><![CDATA[Goran]]></surname>
<given-names><![CDATA[MI]]></given-names>
</name>
</person-group>
<article-title xml:lang="en"><![CDATA[Fat intake and adiposity in children of lean and obese parents]]></article-title>
<source><![CDATA[Am J Clin Nutr]]></source>
<year>1996</year>
<volume>63</volume>
<page-range>507-13</page-range></nlm-citation>
</ref>
<ref id="B19">
<label>19</label><nlm-citation citation-type="journal">
<person-group person-group-type="author">
<name>
<surname><![CDATA[Shamir]]></surname>
<given-names><![CDATA[R]]></given-names>
</name>
<name>
<surname><![CDATA[Tershakovec]]></surname>
<given-names><![CDATA[AM]]></given-names>
</name>
<name>
<surname><![CDATA[Gallagher]]></surname>
<given-names><![CDATA[PR]]></given-names>
</name>
<name>
<surname><![CDATA[Liacouras]]></surname>
<given-names><![CDATA[CA]]></given-names>
</name>
<name>
<surname><![CDATA[Hayman]]></surname>
<given-names><![CDATA[LL]]></given-names>
</name>
<name>
<surname><![CDATA[Cortner]]></surname>
<given-names><![CDATA[JA]]></given-names>
</name>
</person-group>
<article-title xml:lang="en"><![CDATA[The influence of age and relative weight on the presentation of familial combined hyperlipidemia in childhood]]></article-title>
<source><![CDATA[Atherosclerosis]]></source>
<year>1996</year>
<volume>121</volume>
<page-range>85-91</page-range></nlm-citation>
</ref>
<ref id="B20">
<label>20</label><nlm-citation citation-type="journal">
<person-group person-group-type="author">
<name>
<surname><![CDATA[Youssef]]></surname>
<given-names><![CDATA[AA]]></given-names>
</name>
<name>
<surname><![CDATA[Valdez]]></surname>
<given-names><![CDATA[R]]></given-names>
</name>
<name>
<surname><![CDATA[Elkasabany]]></surname>
<given-names><![CDATA[A]]></given-names>
</name>
<name>
<surname><![CDATA[Srinivasan]]></surname>
<given-names><![CDATA[SR]]></given-names>
</name>
<name>
<surname><![CDATA[Berenson]]></surname>
<given-names><![CDATA[GS]]></given-names>
</name>
</person-group>
<article-title xml:lang="en"><![CDATA[Time-course of adiposity and fasting insulin from childhood to young adulthood in offspring of parents with coronary artery disease: The Bogalusa Heart Study]]></article-title>
<source><![CDATA[Ann Epidemiol]]></source>
<year>2002</year>
<volume>12</volume>
<page-range>553-9</page-range></nlm-citation>
</ref>
<ref id="B21">
<label>21</label><nlm-citation citation-type="journal">
<person-group person-group-type="author">
<name>
<surname><![CDATA[Hui]]></surname>
<given-names><![CDATA[LL]]></given-names>
</name>
<name>
<surname><![CDATA[Nelson]]></surname>
<given-names><![CDATA[EAS]]></given-names>
</name>
<name>
<surname><![CDATA[Yu]]></surname>
<given-names><![CDATA[LM]]></given-names>
</name>
<name>
<surname><![CDATA[Li]]></surname>
<given-names><![CDATA[AM]]></given-names>
</name>
<name>
<surname><![CDATA[Fok]]></surname>
<given-names><![CDATA[TF]]></given-names>
</name>
</person-group>
<article-title xml:lang="en"><![CDATA[Risk factors for childhood overweight in 6- to 7-y-old Hong Kong children]]></article-title>
<source><![CDATA[Int J Obes]]></source>
<year>2003</year>
<volume>27</volume>
<page-range>1411-8</page-range></nlm-citation>
</ref>
<ref id="B22">
<label>22</label><nlm-citation citation-type="journal">
<person-group person-group-type="author">
<name>
<surname><![CDATA[Gulliford]]></surname>
<given-names><![CDATA[MC]]></given-names>
</name>
<name>
<surname><![CDATA[Mahabir]]></surname>
<given-names><![CDATA[D]]></given-names>
</name>
<name>
<surname><![CDATA[Rocke]]></surname>
<given-names><![CDATA[B]]></given-names>
</name>
<name>
<surname><![CDATA[Chinn]]></surname>
<given-names><![CDATA[S]]></given-names>
</name>
<name>
<surname><![CDATA[Rona]]></surname>
<given-names><![CDATA[R]]></given-names>
</name>
</person-group>
<article-title xml:lang="en"><![CDATA[Overweight, obesity and skinfold thicknesses of children of African or Indian descent in Trinidad and Tobago]]></article-title>
<source><![CDATA[Int J Epidemiol]]></source>
<year>2001</year>
<volume>30</volume>
<page-range>989-98</page-range></nlm-citation>
</ref>
<ref id="B23">
<label>23</label><nlm-citation citation-type="journal">
<person-group person-group-type="author">
<name>
<surname><![CDATA[Garn]]></surname>
<given-names><![CDATA[SM]]></given-names>
</name>
<name>
<surname><![CDATA[Clark]]></surname>
<given-names><![CDATA[DC]]></given-names>
</name>
</person-group>
<article-title xml:lang="en"><![CDATA[Nutrition, growth, development, and maturation: findings from the ten-state nutrition survey of 1968- 1970]]></article-title>
<source><![CDATA[Pediatrics]]></source>
<year>1975</year>
<volume>56</volume>
<page-range>306-19</page-range></nlm-citation>
</ref>
<ref id="B24">
<label>24</label><nlm-citation citation-type="journal">
<person-group person-group-type="author">
<name>
<surname><![CDATA[Mamalakis]]></surname>
<given-names><![CDATA[G]]></given-names>
</name>
<name>
<surname><![CDATA[Kafatos]]></surname>
<given-names><![CDATA[A]]></given-names>
</name>
<name>
<surname><![CDATA[Manios]]></surname>
<given-names><![CDATA[Y]]></given-names>
</name>
<name>
<surname><![CDATA[Kalogeropoulos]]></surname>
<given-names><![CDATA[N]]></given-names>
</name>
<name>
<surname><![CDATA[Andrikopoulos]]></surname>
<given-names><![CDATA[N]]></given-names>
</name>
</person-group>
<article-title xml:lang="en"><![CDATA[Adipose fat quality vs. quantity: relationships with children’s serum lipid levels]]></article-title>
<source><![CDATA[Prev Med]]></source>
<year>2001</year>
<volume>33</volume>
<page-range>525-35</page-range></nlm-citation>
</ref>
<ref id="B25">
<label>25</label><nlm-citation citation-type="journal">
<person-group person-group-type="author">
<name>
<surname><![CDATA[Arner]]></surname>
<given-names><![CDATA[P]]></given-names>
</name>
</person-group>
<article-title xml:lang="en"><![CDATA[Differences in lipolysis between human subcutaneous and omental adipose tissues]]></article-title>
<source><![CDATA[Ann Med]]></source>
<year>1995</year>
<volume>27</volume>
<page-range>435-8</page-range></nlm-citation>
</ref>
<ref id="B26">
<label>26</label><nlm-citation citation-type="journal">
<person-group person-group-type="author">
<name>
<surname><![CDATA[Bjorntorp]]></surname>
<given-names><![CDATA[P]]></given-names>
</name>
</person-group>
<article-title xml:lang="en"><![CDATA[Abdominal fat distribution and the metabolic syndrome]]></article-title>
<source><![CDATA[J Cardiovasc Pharmacol]]></source>
<year>1992</year>
<volume>20</volume>
<numero>^s8</numero>
<issue>^s8</issue>
<supplement>8</supplement>
<page-range>S26-S28</page-range></nlm-citation>
</ref>
<ref id="B27">
<label>27</label><nlm-citation citation-type="journal">
<person-group person-group-type="author">
<name>
<surname><![CDATA[Sheehan]]></surname>
<given-names><![CDATA[MT]]></given-names>
</name>
<name>
<surname><![CDATA[Jensen]]></surname>
<given-names><![CDATA[MD]]></given-names>
</name>
</person-group>
<article-title xml:lang="en"><![CDATA[Metabolic complications of obesity]]></article-title>
<source><![CDATA[Med Clin North Am]]></source>
<year>2000</year>
<volume>84</volume>
<page-range>363-85</page-range></nlm-citation>
</ref>
<ref id="B28">
<label>28</label><nlm-citation citation-type="journal">
<person-group person-group-type="author">
<name>
<surname><![CDATA[Botton]]></surname>
<given-names><![CDATA[J]]></given-names>
</name>
<name>
<surname><![CDATA[Heude]]></surname>
<given-names><![CDATA[B]]></given-names>
</name>
<name>
<surname><![CDATA[Kettaneh]]></surname>
<given-names><![CDATA[A]]></given-names>
</name>
<name>
<surname><![CDATA[Borys]]></surname>
<given-names><![CDATA[J-M]]></given-names>
</name>
<name>
<surname><![CDATA[Lommez]]></surname>
<given-names><![CDATA[A]]></given-names>
</name>
<name>
<surname><![CDATA[Bresson]]></surname>
<given-names><![CDATA[J-L]]></given-names>
</name>
<name>
<surname><![CDATA[Ducimetiere]]></surname>
<given-names><![CDATA[P]]></given-names>
</name>
<name>
<surname><![CDATA[Charles]]></surname>
<given-names><![CDATA[M-A]]></given-names>
</name>
</person-group>
<article-title xml:lang="en"><![CDATA[the FLVS Study Group. Cardiovascular risk factor levels and their relationships with overweight and fat distribution in children: The Fleurbaix Laventie Ville Santé II study]]></article-title>
<source><![CDATA[Metabolism Clinical and Experimental]]></source>
<year>2007</year>
<volume>56</volume>
<page-range>614-22</page-range></nlm-citation>
</ref>
<ref id="B29">
<label>29</label><nlm-citation citation-type="journal">
<person-group person-group-type="author">
<name>
<surname><![CDATA[Asato]]></surname>
<given-names><![CDATA[Y]]></given-names>
</name>
<name>
<surname><![CDATA[Katsuren]]></surname>
<given-names><![CDATA[K]]></given-names>
</name>
<name>
<surname><![CDATA[Ohshiro]]></surname>
<given-names><![CDATA[T]]></given-names>
</name>
<name>
<surname><![CDATA[Kikawa]]></surname>
<given-names><![CDATA[K]]></given-names>
</name>
<name>
<surname><![CDATA[Shimabukuro]]></surname>
<given-names><![CDATA[T]]></given-names>
</name>
<name>
<surname><![CDATA[Ohta]]></surname>
<given-names><![CDATA[T]]></given-names>
</name>
</person-group>
<article-title xml:lang="en"><![CDATA[Relationship between lipid abnormalities and insulin resistance in Japanese school children]]></article-title>
<source><![CDATA[Arterioscler Thromb Vasc Biol]]></source>
<year>2006</year>
<volume>26</volume>
<page-range>2781-6</page-range></nlm-citation>
</ref>
<ref id="B30">
<label>30</label><nlm-citation citation-type="journal">
<person-group person-group-type="author">
<name>
<surname><![CDATA[Marins]]></surname>
<given-names><![CDATA[VMR]]></given-names>
</name>
<name>
<surname><![CDATA[Almeida]]></surname>
<given-names><![CDATA[RMVR]]></given-names>
</name>
<name>
<surname><![CDATA[Pereira]]></surname>
<given-names><![CDATA[RA]]></given-names>
</name>
<name>
<surname><![CDATA[Barros]]></surname>
<given-names><![CDATA[MBA]]></given-names>
</name>
</person-group>
<article-title xml:lang="en"><![CDATA[The relationship between parental nutritional status and overweight children/adolescents in Rio de Janeiro, Brazil]]></article-title>
<source><![CDATA[Public Health]]></source>
<year>2004</year>
<volume>118</volume>
<page-range>43-9</page-range></nlm-citation>
</ref>
<ref id="B31">
<label>31</label><nlm-citation citation-type="journal">
<person-group person-group-type="author">
<name>
<surname><![CDATA[Johannsen]]></surname>
<given-names><![CDATA[DL]]></given-names>
</name>
<name>
<surname><![CDATA[Johannsen]]></surname>
<given-names><![CDATA[NM]]></given-names>
</name>
<name>
<surname><![CDATA[Specker]]></surname>
<given-names><![CDATA[BL]]></given-names>
</name>
</person-group>
<article-title xml:lang="en"><![CDATA[Influence of parents’ eating behaviors and child feeding practices in children’s weight status]]></article-title>
<source><![CDATA[Obesity]]></source>
<year>2006</year>
<volume>14</volume>
<numero>3</numero>
<issue>3</issue>
<page-range>431-9</page-range></nlm-citation>
</ref>
<ref id="B32">
<label>32</label><nlm-citation citation-type="journal">
<person-group person-group-type="author">
<name>
<surname><![CDATA[Psarra]]></surname>
<given-names><![CDATA[G]]></given-names>
</name>
<name>
<surname><![CDATA[Nassis]]></surname>
<given-names><![CDATA[GP]]></given-names>
</name>
<name>
<surname><![CDATA[Sidossis]]></surname>
<given-names><![CDATA[LS]]></given-names>
</name>
</person-group>
<article-title xml:lang="en"><![CDATA[Short-term predictors of abdominal obesity in children]]></article-title>
<source><![CDATA[Eur J Public Health]]></source>
<year>2005</year>
<volume>16</volume>
<numero>5</numero>
<issue>5</issue>
<page-range>520-5</page-range></nlm-citation>
</ref>
<ref id="B33">
<label>33</label><nlm-citation citation-type="journal">
<person-group person-group-type="author">
<name>
<surname><![CDATA[Reilly]]></surname>
<given-names><![CDATA[JJ]]></given-names>
</name>
<name>
<surname><![CDATA[Armstrong]]></surname>
<given-names><![CDATA[J]]></given-names>
</name>
<name>
<surname><![CDATA[Dorosty]]></surname>
<given-names><![CDATA[AR]]></given-names>
</name>
<name>
<surname><![CDATA[Emmett]]></surname>
<given-names><![CDATA[PM]]></given-names>
</name>
<name>
<surname><![CDATA[Ness]]></surname>
<given-names><![CDATA[A]]></given-names>
</name>
<name>
<surname><![CDATA[Rogers]]></surname>
<given-names><![CDATA[I]]></given-names>
</name>
<name>
<surname><![CDATA[Steer]]></surname>
<given-names><![CDATA[C]]></given-names>
</name>
<name>
<surname><![CDATA[Sherriff]]></surname>
<given-names><![CDATA[A]]></given-names>
</name>
</person-group>
<article-title xml:lang="en"><![CDATA[the Avon Longitudinal Study of Parents and Children Study Team. Early life factors for obesity in childhood: cohort study]]></article-title>
<source><![CDATA[BMJ]]></source>
<year>2005</year>
<volume>330</volume>
<page-range>1357-64</page-range></nlm-citation>
</ref>
<ref id="B34">
<label>34</label><nlm-citation citation-type="journal">
<person-group person-group-type="author">
<name>
<surname><![CDATA[Epstein]]></surname>
<given-names><![CDATA[LH]]></given-names>
</name>
<name>
<surname><![CDATA[Mccurley]]></surname>
<given-names><![CDATA[J]]></given-names>
</name>
<name>
<surname><![CDATA[Wing]]></surname>
<given-names><![CDATA[RR]]></given-names>
</name>
<name>
<surname><![CDATA[Valoski]]></surname>
<given-names><![CDATA[A]]></given-names>
</name>
</person-group>
<article-title xml:lang="en"><![CDATA[Five-year follow- up of family-based behavioral treatments for childhood obesity]]></article-title>
<source><![CDATA[J. Consult. Clin Psychol]]></source>
<year>1990</year>
<volume>58</volume>
<page-range>661-4</page-range></nlm-citation>
</ref>
<ref id="B35">
<label>35</label><nlm-citation citation-type="journal">
<article-title xml:lang="en"><![CDATA[Mossberg H-O. 40-year follow-up of overweight children]]></article-title>
<source><![CDATA[Lancet]]></source>
<year>1989</year>
<volume>26</volume>
<page-range>491-3</page-range></nlm-citation>
</ref>
<ref id="B36">
<label>36</label><nlm-citation citation-type="journal">
<person-group person-group-type="author">
<name>
<surname><![CDATA[Kain]]></surname>
<given-names><![CDATA[J]]></given-names>
</name>
<name>
<surname><![CDATA[Albala]]></surname>
<given-names><![CDATA[C]]></given-names>
</name>
<name>
<surname><![CDATA[García]]></surname>
<given-names><![CDATA[F]]></given-names>
</name>
<name>
<surname><![CDATA[Andrade]]></surname>
<given-names><![CDATA[M]]></given-names>
</name>
</person-group>
<article-title xml:lang="es"><![CDATA[Obesidad en el preescolar: evolución antropométrica y determinantes socioeconómicos]]></article-title>
<source><![CDATA[Rev Med Chil]]></source>
<year>1998</year>
<volume>126</volume>
<page-range>271-8</page-range></nlm-citation>
</ref>
<ref id="B37">
<label>37</label><nlm-citation citation-type="journal">
<person-group person-group-type="author">
<name>
<surname><![CDATA[Klesges]]></surname>
<given-names><![CDATA[RC]]></given-names>
</name>
<name>
<surname><![CDATA[Klesges]]></surname>
<given-names><![CDATA[LM]]></given-names>
</name>
<name>
<surname><![CDATA[Eck]]></surname>
<given-names><![CDATA[LH]]></given-names>
</name>
<name>
<surname><![CDATA[Shelton]]></surname>
<given-names><![CDATA[ML]]></given-names>
</name>
</person-group>
<article-title xml:lang="en"><![CDATA[A longitudinal analysis of accelerated weight gain in preschool children]]></article-title>
<source><![CDATA[Pediatrics]]></source>
<year>1995</year>
<volume>95</volume>
<page-range>126-30</page-range></nlm-citation>
</ref>
<ref id="B38">
<label>38</label><nlm-citation citation-type="journal">
<person-group person-group-type="author">
<name>
<surname><![CDATA[Davison]]></surname>
<given-names><![CDATA[KK]]></given-names>
</name>
<name>
<surname><![CDATA[Birch]]></surname>
<given-names><![CDATA[LL]]></given-names>
</name>
</person-group>
<article-title xml:lang="en"><![CDATA[Child and parent characteristics as predictors of change in girls’ body mass index]]></article-title>
<source><![CDATA[Int J Obes]]></source>
<year>2001</year>
<volume>25</volume>
<page-range>1834-42</page-range></nlm-citation>
</ref>
<ref id="B39">
<label>39</label><nlm-citation citation-type="journal">
<person-group person-group-type="author">
<name>
<surname><![CDATA[McCarthy]]></surname>
<given-names><![CDATA[HD]]></given-names>
</name>
<name>
<surname><![CDATA[Jarrett]]></surname>
<given-names><![CDATA[KV]]></given-names>
</name>
<name>
<surname><![CDATA[Crawley]]></surname>
<given-names><![CDATA[HF]]></given-names>
</name>
</person-group>
<article-title xml:lang="en"><![CDATA[The development of waist circumference percentiles in British children aged 5.0- 16.9 y]]></article-title>
<source><![CDATA[Eur J Clin Nutr]]></source>
<year>2001</year>
<volume>55</volume>
<page-range>902-7</page-range></nlm-citation>
</ref>
</ref-list>
</back>
</article>