<?xml version="1.0" encoding="ISO-8859-1"?><article xmlns:mml="http://www.w3.org/1998/Math/MathML" xmlns:xlink="http://www.w3.org/1999/xlink" xmlns:xsi="http://www.w3.org/2001/XMLSchema-instance">
<front>
<journal-meta>
<journal-id>0798-2259</journal-id>
<journal-title><![CDATA[Revista Científica]]></journal-title>
<abbrev-journal-title><![CDATA[Rev. Cient. (Maracaibo)]]></abbrev-journal-title>
<issn>0798-2259</issn>
<publisher>
<publisher-name><![CDATA[UNIVERSIDAD DEL ZULIA]]></publisher-name>
</publisher>
</journal-meta>
<article-meta>
<article-id>S0798-22592008000500009</article-id>
<title-group>
<article-title xml:lang="es"><![CDATA[Comparación de modelos sigmoidales aplicados al crecimiento de lactococcus lactis subsp: Lactis]]></article-title>
<article-title xml:lang="en"><![CDATA[Comparison of Sigmoid Models Applied to the Growth of Lactococcus lactis subsp: Lactis]]></article-title>
</title-group>
<contrib-group>
<contrib contrib-type="author">
<name>
<surname><![CDATA[Castro]]></surname>
<given-names><![CDATA[Gustavo]]></given-names>
</name>
<xref ref-type="aff" rid="A01"/>
</contrib>
<contrib contrib-type="author">
<name>
<surname><![CDATA[Valbuena]]></surname>
<given-names><![CDATA[Emiro]]></given-names>
</name>
<xref ref-type="aff" rid="A01"/>
</contrib>
<contrib contrib-type="author">
<name>
<surname><![CDATA[Sánchez]]></surname>
<given-names><![CDATA[Edgar]]></given-names>
</name>
<xref ref-type="aff" rid="A02"/>
</contrib>
<contrib contrib-type="author">
<name>
<surname><![CDATA[Briñez]]></surname>
<given-names><![CDATA[Wilfido]]></given-names>
</name>
<xref ref-type="aff" rid="A01"/>
</contrib>
<contrib contrib-type="author">
<name>
<surname><![CDATA[Vera]]></surname>
<given-names><![CDATA[Henry]]></given-names>
</name>
<xref ref-type="aff" rid="A01"/>
</contrib>
<contrib contrib-type="author">
<name>
<surname><![CDATA[Leal]]></surname>
<given-names><![CDATA[Merlis]]></given-names>
</name>
<xref ref-type="aff" rid="A01"/>
</contrib>
</contrib-group>
<aff id="A01">
<institution><![CDATA[,Universidad del Zulia Facultad de Ciencias Veterinarias Unidad de Investigación en Ciencia y Tecnología de los Alimentos]]></institution>
<addr-line><![CDATA[ ]]></addr-line>
<country>Venezuela</country>
</aff>
<aff id="A02">
<institution><![CDATA[,Universidad del Zulia Facultad de Ciencias Veterinarias Unidad de Bioestadística]]></institution>
<addr-line><![CDATA[Maracaibo ]]></addr-line>
<country>Venezuela</country>
</aff>
<pub-date pub-type="pub">
<day>00</day>
<month>10</month>
<year>2008</year>
</pub-date>
<pub-date pub-type="epub">
<day>00</day>
<month>10</month>
<year>2008</year>
</pub-date>
<volume>18</volume>
<numero>5</numero>
<fpage>582</fpage>
<lpage>588</lpage>
<copyright-statement/>
<copyright-year/>
<self-uri xlink:href="http://ve.scielo.org/scielo.php?script=sci_arttext&amp;pid=S0798-22592008000500009&amp;lng=en&amp;nrm=iso"></self-uri><self-uri xlink:href="http://ve.scielo.org/scielo.php?script=sci_abstract&amp;pid=S0798-22592008000500009&amp;lng=en&amp;nrm=iso"></self-uri><self-uri xlink:href="http://ve.scielo.org/scielo.php?script=sci_pdf&amp;pid=S0798-22592008000500009&amp;lng=en&amp;nrm=iso"></self-uri><abstract abstract-type="short" xml:lang="es"><p><![CDATA[La microbiología predictiva es una herramienta útil para describir y predecir el crecimiento bacteriano en los alimentos. Para comparar la aplicación de diferentes modelos sigmoidales aplicados al crecimiento de Lactococcus lactis subsp. lactis, se analizaron muestras de leches tomadas del total del ordeño matutino de dos rebaños, bufalino (n=6) y vacuno (n=6), manejados bajo las mismas condiciones, ubicados en el municipio Mara del estado Zulia, Venezuela. Se determinaron algunos parámetros, tales como pH, acidez titulable y presencia de inhibidores. Se preparó una serie de tubos de ensayo con leche esterilizada a 110 ± 2°C por 10 min. y se inocularon con Lactococcus a 1 x 10(4) ufc/mL. Posteriormente, fueron incubados a 36 ± 0,5°C y cada dos horas se prepararon diluciones y siembra en placas con agar M-17. Se determinó el Log10 de ufc/mL para las 0; 2; 4; 6; 8 y 10 horas de incubación. Se realizó un análisis de regresión con los modelos de Gompertz, Logístico, Stannard y Richards, por medio del algoritmo de Marquardt. Se encontró similitud en el ajuste de los modelos aplicados. Los modelos de Stannard y Richards resultaron ser iguales en la estimación de los datos y fueron los que presentaron mayor dificultad para alcanzar el criterio de convergencia. El modelo de Gompertz de tres parámetros presentó diferencia significativa con los modelos de cuatro parámetros. Se considera los modelos de Gompertz y Logístico (con cuatro parámetros), modificados por Gibson, como los mejores para modelar y predecir el crecimiento del microorganismo en estudio.]]></p></abstract>
<abstract abstract-type="short" xml:lang="en"><p><![CDATA[Predictive Microbiology is a useful tool to describe and predict the bacterial growing in food. Milk samples from total morning milking of two herds, buffalo (n=6) and cattle (n=6), managed under similar conditions, located in Mara Municipality, Zulia State, Venezuela, were analyzed to compare the application of different sigmoid models to the growth of Lactococcus lactis subsp. lactis strain. Sanitary quality was determined by means of pH, acidity titration and detection of inhibitors. A series of assay tubes were prepared with sterilized milk at 110 ± 2°C for 10 min. The milk in the assay tubes was inoculated with Lactococcus at 1 x 10(4) ufc/mL. Then, the assay tubes were incubated at 36 ± 0.5°C and every two hours dilutions and culture were prepared in Petrie dishes with M-17 agar. Log10 of ufc/mL was determined for 0; 2; 4; 6; 8 y 10 hours post incubation. A regressions analysis with Gompertz, Logistic, Stannard and Richards models through Marquardt algorithm was used. Similarity was found when models were adjusted. The Stannard and Richards models were equal for the data estimation and they presented the greatest difficulty to reach the convergent criterion. The three parameters Gompertz model showed significant difference compare to the four parameters models. The Gompertz and Logistic models (with four parameters) modified by Gibson are considered the best to model and predict the growing of the microorganism under study.]]></p></abstract>
<kwd-group>
<kwd lng="es"><![CDATA[Lactococcus lactis]]></kwd>
<kwd lng="es"><![CDATA[microbiología predictiva]]></kwd>
<kwd lng="es"><![CDATA[Gompertz]]></kwd>
<kwd lng="es"><![CDATA[búfala]]></kwd>
<kwd lng="en"><![CDATA[Lactococcus lactis]]></kwd>
<kwd lng="en"><![CDATA[predicitive microbiology]]></kwd>
<kwd lng="en"><![CDATA[Gompertz]]></kwd>
<kwd lng="en"><![CDATA[buffalo]]></kwd>
</kwd-group>
</article-meta>
</front><body><![CDATA[  <BASEFONT SIZE="3">     <p ALIGN="center" style="word-spacing: 0; line-height: 100%"><b><span style="color: black"><font face="Verdana" size="3">Comparación de modelos sigmoidales aplicados al crecimiento de <i>lactococcus lactis </i>subsp. <i>Lactis</i>.</font></span></b></p>     <P ALIGN="CENTER" style="word-spacing: 0; line-height: 100%"><font size="3"><B><FONT COLOR="000000" face="Verdana"> Co</FONT></B><FONT COLOR="000000" face="Verdana"><B>mparison of Sigmoid Models Applied to the Growth of </B><I><B>Lactococcus lactis  </B></I><B>subsp.</B><I><B>  Lactis.</B></I></FONT></font></P>     <P ALIGN="CENTER" style="word-spacing: 0; line-height: 100%"><font size="2"><B><FONT COLOR="000000" face="Verdana"> Gustavo Castro</FONT></B><FONT COLOR="000000" face="Verdana"><SUP><B>1*</B></SUP><B>, Emiro Valbuena</B><SUP><B>1</B></SUP><B>, Edgar Sánchez</B><SUP><B>2</B></SUP><B>, Wilfido Briñez</B><SUP><B>1</B></SUP><B>,  Henry Vera</B><SUP><B>1</B></SUP><B> y Merlis Leal</B><SUP><B>1 </B></SUP> </FONT></font></P>      <P ALIGN="justify" style="word-spacing: 0; line-height: 100%"><font size="2"><FONT COLOR="000000" face="Verdana"> <SUP> 1 </SUP>Unidad de Investigación en Ciencia y Tecnología de los Alimentos. Venezuela. E-mail: gcastro@luz.edu.ve.</FONT></font></P>      <P ALIGN="justify" style="word-spacing: 0; line-height: 100%"><font size="2"><SUP><FONT COLOR="000000" face="Verdana">2 </FONT> </SUP><FONT COLOR="000000" face="Verdana">Unidad de Bioestadística. Facultad de Ciencias Veterinarias,  Universidad del Zulia. Maracaibo, Venezuela.</FONT></font></P>    <P ALIGN="justify" style="word-spacing: 0; line-height: 100%"><B><FONT COLOR="000000" face="Verdana" size="2">RESUMEN</FONT></B></P>      <P ALIGN="justify" style="word-spacing: 0; line-height: 100%"><FONT COLOR="000000" size="2" face="Verdana"> La microbiología predictiva es una herramienta útil para describir y predecir  el crecimiento bacteriano en los alimentos. Para comparar la aplicación  de diferentes modelos sigmoidales aplicados al crecimiento de <I>Lactococcus  lactis</I> subsp. <I>lactis</I>, se analizaron muestras de leches tomadas del total  del ordeño matutino de dos rebaños, bufalino (n=6) y vacuno (n=6), manejados  bajo las mismas condiciones, ubicados en el municipio Mara del estado Zulia,  Venezuela. Se determinaron algunos parámetros, tales como pH, acidez titulable  y presencia de inhibidores. Se preparó una serie de tubos de ensayo con  &nbsp;leche esterilizada a 110 ± 2°C por 10 min. y se inocularon con <I>Lactococcus</I>  a 1 x 10<SUP>4</SUP> ufc/mL. Posteriormente, fueron incubados a 36 ± 0,5°C y cada  dos horas se prepararon diluciones y siembra en placas con agar M-17. Se  determinó el Log<SUB>10</SUB> de ufc/mL para las 0; 2; 4; 6; 8 y 10 horas de incubación.  Se realizó un análisis de regresión con los modelos de Gompertz, Logístico,  Stannard y Richards, por medio del algoritmo de Marquardt. Se encontró  similitud en el ajuste de los modelos aplicados. Los modelos de Stannard  y Richards resultaron ser iguales en la estimación de los datos y fueron  los que presentaron mayor dificultad para alcanzar el criterio de convergencia.  El modelo de Gompertz de tres parámetros presentó diferencia significativa  con los modelos de cuatro parámetros. Se considera los modelos de Gompertz  y Logístico (con cuatro parámetros), modificados por Gibson, como los mejores  para modelar y predecir el crecimiento del microorganismo en estudio. </FONT></P>      <P ALIGN="justify" style="word-spacing: 0; line-height: 100%"><font face="Verdana" size="2"><B><FONT COLOR="000000"> Palabras clave</FONT></B><FONT COLOR="000000"><B>: </B></FONT><i>Lactococcus lactis</i>, microbiología predictiva, Gompertz, búfala.</font></P>      <P ALIGN="justify" style="word-spacing: 0; line-height: 100%"><B><FONT COLOR="000000" size="2" face="Verdana"> ABSTRACT </FONT></B></P>      ]]></body>
<body><![CDATA[<P ALIGN="justify" style="word-spacing: 0; line-height: 100%"><FONT COLOR="000000" size="2" face="Verdana"> Predictive Microbiology is a useful tool to describe and predict the bacterial  growing in food. Milk samples from total morning milking of two herds,  buffalo (n=6) and cattle (n=6), managed under similar conditions, located  in Mara Municipality, Zulia State, Venezuela, were analyzed to compare  the application of different sigmoid models to the growth of <I>Lactococcus  lactis</I> subsp. <I>lactis</I> strain. Sanitary quality was determined by means of  pH, acidity titration and detection of inhibitors. A series of assay tubes  were prepared with sterilized milk at 110 ± 2°C for 10 min. The milk in  the assay tubes was inoculated with <I>Lactococcus</I> at 1 x 10<SUP>4</SUP> ufc/mL. Then,  the assay tubes were incubated at 36 ± 0.5°C and every two hours dilutions  and culture were prepared in Petrie dishes with M-17 agar. Log<SUB>10</SUB> of ufc/mL  was determined for 0; 2; 4; 6; 8 y 10 hours post incubation. A regressions  analysis with Gompertz, Logistic, Stannard and Richards models through  Marquardt algorithm was used. Similarity was found when models were adjusted.  The Stannard and Richards models were equal for the data estimation and  they presented the greatest difficulty to reach the convergent criterion.  The three parameters Gompertz model showed significant difference compare  to the four parameters models. The Gompertz and Logistic models (with four  parameters) modified by Gibson are considered the best to model and predict  the growing of the microorganism under study. </FONT></P>      <P ALIGN="justify" style="word-spacing: 0; line-height: 100%"><font face="Verdana" size="2"><B><FONT COLOR="000000"> Key words</FONT></B><FONT COLOR="000000"><B>: </B></FONT><i>Lactococcus lactis</i>, predicitive microbiology, Gompertz, buffalo.</font></P>      <p ALIGN="justify" style="word-spacing: 0; line-height: 100%"><font size="2"><b><font COLOR="000000" face="Verdana">Recibido:</font></b><font COLOR="000000" face="Verdana"> 23 / 03 / 2006. <b>Aceptado:</b> 13 / 12 / 2007.</font></font>      <P ALIGN="justify" style="word-spacing: 0; line-height: 100%"><font size="2"><B><FONT COLOR="000000" face="Verdana"> INTRODUCC</FONT></B><FONT COLOR="000000" face="Verdana"><B>IÓN</B></FONT></font></P>      <P ALIGN="justify" style="word-spacing: 0; line-height: 100%"><FONT COLOR="000000" size="2" face="Verdana"> El estudio de los microorganismos ocupa una atención especial en la ciencia  de los alimentos, de ellos dependen muchas de las características organolépticas  de los mismos, a la vez que afectan su vida comercial. Son de interés los  microorganismos patógenos, por los problemas que puedan causar en el consumidor  y por otro lado, los cultivos iniciadores, por los beneficios que aportan  a la industria de los alimentos. Sean beneficiosos o no, es necesario conocer  sus características de crecimiento, los factores que los afectan y como  se pueden controlar. </FONT></P>      <P ALIGN="justify" style="word-spacing: 0; line-height: 100%"><FONT COLOR="000000" size="2" face="Verdana"> La microbiología predictiva es una ciencia multidisciplinaria (abarca las  áreas de la microbiología, ingeniería, estadística), que basada en el estudio  del crecimiento de los microorganismos, especialmente las bacterias, ha  desarrollado o adaptado modelos matemáticos para describir y predecir el  comportamiento de los microorganismos bajo diferentes condiciones [11,  12]. En la ciencia de los alimentos, la microbiología predictiva es útil  para el estudio de la inocuidad de los alimentos, tiempo de vida útil y  en la optimización o desarrollo de los procesos de producción y comercialización  [22]. </FONT></P>      <P ALIGN="justify" style="word-spacing: 0; line-height: 100%"><FONT COLOR="000000" size="2" face="Verdana"> Existen en la literatura, diferentes modelos matemáticos utilizados para  describir el crecimiento bacteriano, algunos toman en cuenta el consumo  de sustrato, tal como el de Monod y otros como el de Gompertz, Richards,  Standard, Schnute, Brody y el modelo Logístico, no lo toman en cuenta [11,  12]. En el presente estudio, el consumo de sustrato no fue tomado en cuenta,  ya que se considera que en la leche existen, en tales concentraciones,  como para permitir el crecimiento máximo de los microorganismos. Igualmente  se han aplicado las redes neurales para predecir el crecimiento microbiano  [5-8, 13, 15, 20]. </FONT></P>      <P ALIGN="justify" style="word-spacing: 0; line-height: 100%"><FONT COLOR="000000" size="2" face="Verdana"> Las fases de crecimiento de mayor interés en alimentos corresponden a las  tres primeras (adaptación, exponencial y estacionaria), ya que es en ellas  donde ocurren los mayores problemas microbiológicos (producción de metabolitos  importantes, cambios en las características de los alimentos, producción  de toxinas, etc.). Tomando esas tres fases de la curva, el crecimiento  presenta una forma sigmoidal, de allí que varios modelos sean desarrollados  para ajustarse a dicha forma [1]. </FONT></P>      <P ALIGN="justify" style="word-spacing: 0; line-height: 100%"><FONT COLOR="000000" size="2" face="Verdana"> El Modelo de Gompertz fue primero descrito en la ciencia actuarial para  ajustar datos de mortalidad humana [11] y se considera que es la ecuación  primaria más ampliamente utilizada para describir el crecimiento microbiano  en alimentos bajo condiciones ambientales controladas y definidas [21].  Esta función está basada en una relación exponencial entre la velocidad  de crecimiento específico y la densidad de la población. A partir de este  modelo se pueden desarrollar modelos secundarios [10, 11, 19]. En la literatura  se encuentran algunas variantes para escribir esta ecuación, una con tres  parámetros y otra forma modificada por Gibson y col., con cuatro [10, 12]. </FONT></P>      <P ALIGN="justify" style="word-spacing: 0; line-height: 100%"><FONT COLOR="000000" size="2" face="Verdana"> El modelo logístico, también muy utilizado en estudios predictivos, presenta  algunas variantes en la literatura e igualmente una forma modificada por  Gibson y col. [10, 12]. El Modelo de Stannard, descrito por dicho autor  en 1985, fue reparametrizado por Zwietering y col. [11, 22]. Otro modelo  sigmoidal que se encuentra en la literatura, no solo aplicado al crecimiento  microbiano, es el modelo de Richards [1, 10, 22], el cual ha sido considerado  como un modelo flexible comparado con algunos modelos de tres parámetros,  gracias a que posee un parámetro de forma que le permite modelar las curvas  con mayor precisión. Sin embargo, ha sido también criticado, ya que dicho  parámetro no tiene significado biológico y en ciertas ocasiones genera  problemas para ajustar los datos experimentales [12]. </FONT></P>      ]]></body>
<body><![CDATA[<P ALIGN="justify" style="word-spacing: 0; line-height: 100%"><FONT COLOR="000000" size="2" face="Verdana"> No existen en la literatura consultada, bases claras para la selección  de cual modelo utilizar o para decir cual es el ideal para casos particulares.  Algunos de los principios que se han considerados deben cumplir dichos  modelos y que permiten de algún modo seleccionarlos son: parsimonia (simplicidad):  los modelos deben contener la mínima cantidad posible de parámetros; parametrización:  deben usarse parámetros con las mejores propiedades de estimación; rango  de aplicabilidad: el modelo debe poder ajustar todos los datos observados;  especificación estocástica: el error también debe ser modelado; interpretabilidad:  se prefieren parámetros con interpretación física [15]. Zwietering y col.,  hicieron énfasis en la importancia de la parsimonia e interpretabilidad  de los parámetros [22]. </FONT></P>      <P ALIGN="justify" style="word-spacing: 0; line-height: 100%"><FONT COLOR="000000" size="2" face="Verdana"> El <I>Lactococcus lactis </I>subsp. <I>lactis</I> &nbsp;es una bacteria ácido láctica, capaz  de producir nisina, una bacteriocina ampliamente usada en la industria  alimentaria como preservativo biológico [16,17,19]. Diferentes trabajos  han sido publicados reportando la eficacia de este microorganismo en inhibir  el crecimiento de bacterias patógenas, entre ellas <I>Listeria monocytogenes  </I>y <I>Staphylococcus aureus</I> [16,17], razón por la cual puede ser empleado como  biopreservativo en la industria láctea; pero para ello, previamente es  necesario estudiar su crecimiento en los productos lácteos. </FONT></P>      <P ALIGN="justify" style="word-spacing: 0; line-height: 100%"><FONT COLOR="000000" size="2" face="Verdana"> El objetivo del presente estudio fue comparar la aplicabilidad de varios  modelos predictivos sigmoidales al crecimiento del <I>Lactococcus lactis </I>subsp.  <I>lactis</I> en leche estéril de vaca y búfala. </FONT></P>      <P ALIGN="justify" style="word-spacing: 0; line-height: 100%"><font size="2"><B><FONT COLOR="000000" face="Verdana"> M</FONT></B><FONT COLOR="000000" face="Verdana"><B>ATERIALES Y MÉTODOS</B></FONT></font></P>      <P ALIGN="justify" style="word-spacing: 0; line-height: 100%"><FONT COLOR="000000" size="2" face="Verdana"> Durante un período de tres meses, se recolectaron un total de 12 muestras  de leche (250 mL c/u, 6 por especie), del total del ordeño matutino de  un rebaño de búfalos <I>(Bubalus bubalis) </I>y vacunos <I>(Bos taurus-indicus)</I> establecidos  en la hacienda “Cordero”, ubicada en la parroquia “Luis Vicente”, municipio  Mara del estado Zulia, Venezuela, a las márgenes del río Limón. </FONT></P>      <P ALIGN="justify" style="word-spacing: 0; line-height: 100%"><FONT COLOR="000000" size="2" face="Verdana"> Las muestras tomadas asépticamente, fueron envasadas en recipientes de  vidrio estériles y colocadas en refrigeración, para luego ser transportadas  hacia el laboratorio de Ciencia y Tecnología de la Leche de la Facultad  de Ciencias Veterinarias de la Universidad del Zulia, para su análisis  y ejecución del estudio. A las muestras se les determinaron algunos parámetros,  tales como el pH a 25°C, la acidez titulable y la presencia de inhibidores. </FONT></P>      <P ALIGN="justify" style="word-spacing: 0; line-height: 100%"><FONT COLOR="000000" size="2" face="Verdana"> La determinación del pH se hizo empleando un potenciómetro marca Orión  modelo 420-A (Orion Research INC, EUA), el cual posee un electrodo marca  Orión modelo 91-57B, calibrado con dos soluciones buffer, una de pH 7 ±  0,1 y otra de pH 4 ± 0,1 a 25°C, distribuidos por la misma casa comercial. </FONT></P>      <P ALIGN="justify" style="word-spacing: 0; line-height: 100%"><FONT COLOR="000000" size="2" face="Verdana"> La acidez titulable se realizó mediante el procedimiento descrito en la  norma COVENIN 658-86 [3], expresando los resultados en “mL de NaOH 0,1N/100  mL de leche”. </FONT></P>      <P ALIGN="justify" style="word-spacing: 0; line-height: 100%"><FONT COLOR="000000" size="2" face="Verdana"> La detección de inhibidores se realizó con el fin de asegurar que las muestras  estuviesen libres de sustancias que pudiesen afectar el crecimiento del  microorganismo en estudio. Se llevo a cabo mediante la técnica del DELVOTEST  SP<SUP>®</SUP> (DSM Food Specialties, Delft, Holanda), el cual contiene varias ampollas  con un medio sólido, donde se encuentran células del <I>Bacillus stearothermophilus</I>  var. <I>calidolactis</I>, bacteria muy sensible a cantidades trazas de inhibidores  en la leche como penicilina, tetraciclinas, sulfamidas, etc. </FONT></P>      <P ALIGN="justify" style="word-spacing: 0; line-height: 100%"><FONT COLOR="000000" size="2" face="Verdana"> Posterior a los análisis previos, se procedió a esterilizar aproximadamente  100 mL de leche de ambas especies, en autoclave a 110 ± 2°C por 10 min,  parámetros bajo los cuales se evita el pardeamiento no enzimático, a la  vez que se asegura una eficiente reducción de la carga bacteriana. </FONT></P>      ]]></body>
<body><![CDATA[<P ALIGN="justify" style="word-spacing: 0; line-height: 100%"><FONT COLOR="000000" size="2" face="Verdana"> De las muestras esterilizadas se preparó una batería de 12 tubos de ensayo,  conteniendo 9 mL de leche estéril, los cuales se inocularon con 1 mL de  un cultivo conteniendo aproximadamente 1 x 10<SUP>4</SUP> ufc/mL de <I>Lactococcus lactis</I>  subsp. <I>lactis</I> (ATCC 11454), mantenido en leche descremada. Con ello se  esperaba que por efecto de dilución, la población microbiana inicial en  cada tubo estuviese en aproximadamente 1 x 10<SUP>3</SUP> ufc/mL. Las muestras se  incubaron a 36 ± 0,5°C en un baño maría y cada dos horas (de 0 a 10 horas  de incubación) se retiraba un tubo de muestra de cada especie, para proceder  a realizar diluciones seriadas y siembra en profundidad, en placas con  agar M-17 (Himedia<SUP>®</SUP> Laboratories Limited; Bombai, India), las cuales fueron  incubadas en estufa a 37 ± 1°C por 24 horas. Periodo después del cual se  hizo el conteo de colonias, según la norma COVENIN 902-87 [4] y determinó  el crecimiento bacteriano en unidades formadoras de colonias por mililitro  (ufc/mL). </FONT></P>      <P ALIGN="justify" style="word-spacing: 0; line-height: 100%"><FONT COLOR="000000" size="2" face="Verdana"> Los datos en ufc/mL fueron convertidos a logaritmo base 10 y modelados  con las ecuaciones presentadas en la <a href="#TABLA I"> TABLA&nbsp;I</a>; aplicando un análisis de regresión  no lineal, usando para ello el módulo NLIN del paquete estadístico SAS  8,1 [18]. El método para la estimación de los parámetros (método Marquardt)  y el criterio de convergencia utilizado fue predeterminado por el programa  estadístico señalado. </FONT></P>      <div align="center">       <center>   <table width="550" border="1">     <tr>       <td VALIGN="TOP" COLSPAN="3" width="540">             <p ALIGN="CENTER"><font COLOR="000000" face="Verdana" size="2"><b><a name="TABLA I">TABLA         I</a>. </b>MODELOS PREDICTIVOS DE CRECIMIENTO UTILIZADOS EN EL ESTUDIO/         PREDICTIVE MODELS OF GROWTH USED IN STUDY</font></p>       </td>     </tr>     <tr>       <td VALIGN="TOP" width="97">             <p ALIGN="CENTER"><font COLOR="000000" size="2" face="Verdana">Modelo</font></p>       </td>       <td VALIGN="TOP" width="291">             <p ALIGN="CENTER"><font COLOR="000000" size="2" face="Verdana">Expresión</font></p>       </td>       <td VALIGN="TOP" width="140">             <p ALIGN="CENTER"><font COLOR="000000" size="2" face="Verdana">Nomenclatura         en el texto</font></p>       </td>     </tr>     <tr>       <td VALIGN="TOP" ROWSPAN="2" width="97">             <p ALIGN="CENTER"><font COLOR="000000" size="2" face="Verdana">Gompertz</font></p>       </td>       <td VALIGN="TOP" width="291">             <p ALIGN="CENTER"><font COLOR="000000" size="2" face="Verdana">Log N<sub>(t)</sub>=         A × exp (-exp (B-M × t))</font></p>       </td>       <td VALIGN="TOP" width="140">             ]]></body>
<body><![CDATA[<p ALIGN="CENTER"><font COLOR="000000" size="2" face="Verdana">Gompertz-1</font></p>       </td>     </tr>     <tr>       <td VALIGN="TOP" width="291">             <p ALIGN="CENTER"><font COLOR="000000" size="2" face="Verdana">Log N<sub>(t)</sub>=         A+D × exp(-exp(-B × (t-M))</font></p>       </td>       <td VALIGN="TOP" width="140">             <p ALIGN="CENTER"><font COLOR="000000" size="2" face="Verdana">Gompertz-2</font></p>       </td>     </tr>     <tr>       <td VALIGN="TOP" ROWSPAN="2" width="97">             <p ALIGN="CENTER"><font COLOR="000000" size="2" face="Verdana">Logístico</font></p>       </td>       <td VALIGN="TOP" width="291">             <p ALIGN="CENTER"><font COLOR="000000" size="2" face="Verdana">Log N<sub>(t)</sub>=         <img border="0" src="/img/fbpe/rc/v18n5/art09form1.gif" width="96" height="38"></font></td>       <td VALIGN="TOP" width="140">             
<p ALIGN="CENTER"><font COLOR="000000" size="2" face="Verdana">Logístico-1</font></p>       </td>     </tr>     <tr>       <td VALIGN="TOP" width="291">             <p ALIGN="CENTER"><font COLOR="000000" size="2" face="Verdana">Log N<sub>(t)</sub>=         </font><img border="0" src="/img/fbpe/rc/v18n5/art09form2.gif" width="135" height="37"></td>       <td VALIGN="TOP" width="140">             
<p ALIGN="CENTER"><font COLOR="000000" size="2" face="Verdana">Logístico-2</font></p>       </td>     </tr>     <tr>       <td VALIGN="TOP" width="97">             <p ALIGN="CENTER"><font COLOR="000000" size="2" face="Verdana">Stannard</font></p>       </td>       <td VALIGN="TOP" width="291">             <p ALIGN="CENTER"><font COLOR="000000" size="2" face="Verdana">Log N<sub>(t)</sub>=         <img border="0" src="/img/fbpe/rc/v18n5/art09form3.gif" width="143" height="45"></font></td>       <td VALIGN="TOP" width="140">             
]]></body>
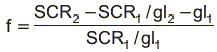
<body><![CDATA[<p ALIGN="CENTER"><font COLOR="000000" size="2" face="Verdana">Stannard</font></p>       </td>     </tr>     <tr>       <td VALIGN="TOP" width="97">             <p ALIGN="CENTER"><font COLOR="000000" size="2" face="Verdana">Richards</font></p>       </td>       <td VALIGN="TOP" width="291">             <p ALIGN="CENTER"><font COLOR="000000" size="2" face="Verdana"><font face="Verdana">Log         N<sub>(t)</sub> =A(1 + v × exp ( k ( </font></font><font COLOR="000000" size="2" face="Symbol">t         </font><font face="Verdana" COLOR="000000" size="2">- t))<sup>(–1/v)</sup></font></p>       </td>       <td VALIGN="TOP" width="140">             <p ALIGN="CENTER"><font COLOR="000000" size="2" face="Verdana">Richards</font></p>       </td>     </tr>     <tr>       <td VALIGN="TOP" COLSPAN="3" width="540">             <p ALIGN="LEFT"><font COLOR="000000" size="2" face="Verdana">LogN:         logaritmo común de poblaciones bacterianas (UFC/mL). t: tiempo de         incubación (horas). A: logaritmo común de la población inicial en         UFC/mL (inoculo). D: logaritmo común de la diferencia entre la población         inicial y final en la fase estacionaria. B: representa la pendiente de         la curva y describe la tasa de crecimiento. M: tiempo en el cual la tasa         de crecimiento es de mayor magnitud. k; p; t; v: parámetros de ajustes         (sin significancia biológica).</font></p>       </td>     </tr>   </table>   </center> </div>      <P ALIGN="justify" style="word-spacing: 0; line-height: 100%"><FONT COLOR="000000" size="2" face="Verdana"> La comparación de los diferentes modelos ajustados, se realizó tomando  en cuenta la facilidad de los mismos para alcanzar el ajuste, determinada  por el número de iteraciones y el tiempo necesario para alcanzar el criterio  de convergencia [9, 14]. Los valores para los coeficientes de determinación  (<I>R</I><SUP><I>2</I></SUP>), se emplearon para comparar entre los modelos con igual número de  parámetros.  </FONT></P>      <P ALIGN="justify" style="word-spacing: 0; line-height: 100%"><FONT COLOR="000000" size="2" face="Verdana"> Para comparar entre los modelos de tres parámetros y cuatro parámetros  se utilizó la prueba de falta de ajuste (lack to fit), asumiendo como modelo  de referencia aquel que presentó un menor error, medido por la suma de  cuadrado de las residuales (SCR), y que en el estudio le correspondió a  los Modelos de Richard y Stannard. En esta prueba, la diferencia entre  las SCR del modelo de tres y cuatro parámetros se compara con la SCR del  modelo de cuatro parámetros [11, 22]. Esta relación es calculada mediante  la siguiente expresión:  </FONT></P>      <P ALIGN="center" style="word-spacing: 0; line-height: 100%"><img border="0" src="/img/fbpe/rc/v18n5/art09form4.gif" width="217" height="52"></P>      
<P ALIGN="justify" style="word-spacing: 0; line-height: 100%"><FONT COLOR="000000" size="2" face="Verdana"> donde: </FONT></P>      <P ALIGN="justify" style="word-spacing: 0; line-height: 100%"><FONT COLOR="000000" size="2" face="Verdana"> SCR<SUB>2</SUB> 	=</FONT> <FONT COLOR="000000" size="2" face="Verdana"> suma de cuadrados del modelo de tres parámetros</FONT></P>      ]]></body>
<body><![CDATA[<P ALIGN="justify" style="word-spacing: 0; line-height: 100%"><FONT COLOR="000000" size="2" face="Verdana"> SCR<SUB>1</SUB> 	= </FONT><FONT COLOR="000000" size="2" face="Verdana"> suma de cuadrados del modelo de cuatro parámetros (referencia) </FONT></P>      <P ALIGN="justify" style="word-spacing: 0; line-height: 100%"><FONT COLOR="000000" size="2" face="Verdana"> gl<SUB>2</SUB> 			= </FONT><FONT COLOR="000000" size="2" face="Verdana"> grados de libertad del modelo de tres parámetros </FONT></P>      <P ALIGN="justify" style="word-spacing: 0; line-height: 100%"><FONT COLOR="000000" size="2" face="Verdana"> gl<SUB>1</SUB> 			= </FONT><FONT COLOR="000000" size="2" face="Verdana"> grados de libertad del modelo de cuatro parámetros (referencia) y probada  frente al valor tabulado de F<SUB>gl1, gl2-gl1</SUB>.  </FONT></P>      <P ALIGN="justify" style="word-spacing: 0; line-height: 100%"><FONT COLOR="000000" size="2" face="Verdana"> Esta prueba no es de completa validez estadística cuando se aplica a modelos  sigmoidales, ya que su normal aplicación es para modelos lineales, pero  ha sido utilizada por otros autores y permite tener una idea de la conveniencia  en la aplicación de los modelos [11, 22]. </FONT></P>      <P ALIGN="justify" style="word-spacing: 0; line-height: 100%"><font size="2"><B><FONT COLOR="000000" face="Verdana"> RESULTADOS </FONT></B><FONT COLOR="000000" face="Verdana"> <B> Y DISCUSIÓN</B> </FONT></font></P>      <P ALIGN="justify" style="word-spacing: 0; line-height: 100%"><FONT COLOR="000000" size="2" face="Verdana"> Las <a href="#TABLA II"> TABLA II</a> y <a href="#TABLA III">III</a>, muestran los valores correspondientes de los diferentes  parámetros estimados para cada uno de los modelos aplicados al crecimiento  del <I>L. lactis </I>subsp. <I>lactis </I>en leche de vaca y búfala, respectivamente.  Con los mismos se pueden construir las diferentes ecuaciones de predicción.  En dichas TABLAS se puede observar que en algunos modelos, los valores  para ciertos parámetros coinciden, lo cual da una idea de la similitud  en el ajuste entre ellos. </FONT></P>      <p ALIGN="CENTER"><font face="Verdana" size="2" color="000000"><b><a name="TABLA II">TABLA II</a>. </b>PARÁMETROS ESTIMADOS POR LOS DIFERENTES MODELOS APLICADOS AL CRECIMIENTO DE <i>Lactococcus lactis </i>subsp. <i>lactis </i>EN LECHE DE VACA / PARAMETERS ESTIMATED BY DIFFERENT MODELS &nbsp;APPLIED TO THE GROWTH OF <i>Lactococcus lactis </i>subsp<i>. lactis</i> IN COW’S MILK.</font></p>     <div align="center">       <center>   <table width="520" border="1">     <tr>       <td VALIGN="top" ROWSPAN="2" align="center">             <p ALIGN="center"><font COLOR="000000" SIZE="2" face="Verdana">Modelo</font></p>       </td>       <td VALIGN="top" COLSPAN="8" align="center">             ]]></body>
<body><![CDATA[<p ALIGN="CENTER"><font COLOR="000000" SIZE="2" face="Verdana">Parámetros</font></p>       </td>     </tr>     <tr>       <td VALIGN="top" align="center">             <p ALIGN="CENTER"><font COLOR="000000" SIZE="2" face="Verdana">A</font></p>       </td>       <td VALIGN="top" align="center">             <p ALIGN="CENTER"><font COLOR="000000" SIZE="2" face="Verdana">B</font></p>       </td>       <td VALIGN="top" align="center">             <p ALIGN="CENTER"><font COLOR="000000" SIZE="2" face="Verdana">D</font></p>       </td>       <td VALIGN="top" align="center">             <p ALIGN="CENTER"><font COLOR="000000" SIZE="2" face="Verdana">M</font></p>       </td>       <td VALIGN="top" align="center">             <p ALIGN="CENTER"><font COLOR="000000" SIZE="2" face="Verdana">p</font></p>       </td>       <td VALIGN="top" align="center">             <p ALIGN="CENTER"><font COLOR="000000" SIZE="2" face="Verdana">k</font></p>       </td>       <td VALIGN="top" align="center">             <p ALIGN="CENTER"><font COLOR="000000" SIZE="2" face="Verdana">v</font></p>       </td>       <td VALIGN="top" align="center">             <p ALIGN="CENTER"><font COLOR="000000" SIZE="2" face="Verdana">t</font></p>       </td>     </tr>     <tr>       <td VALIGN="top" align="center">             <p ALIGN="LEFT"><font COLOR="000000" SIZE="2" face="Verdana">Gompertz-1</font></p>       </td>       <td VALIGN="top" align="center">             ]]></body>
<body><![CDATA[<p ALIGN="CENTER"><font COLOR="000000" SIZE="2" face="Verdana">11,4015</font></p>       </td>       <td VALIGN="top" align="center">             <p ALIGN="CENTER"><font COLOR="000000" SIZE="2" face="Verdana">0,1673</font></p>       </td>       <td VALIGN="top" align="center">             <p ALIGN="CENTER"><font COLOR="000000" SIZE="2" face="Verdana">-</font></p>       </td>       <td VALIGN="top" align="center">             <p ALIGN="CENTER"><font COLOR="000000" SIZE="2" face="Verdana">0,1555</font></p>       </td>       <td VALIGN="top" align="center">             <p ALIGN="CENTER"><font COLOR="000000" SIZE="2" face="Verdana">-</font></p>       </td>       <td VALIGN="top" align="center">             <p ALIGN="CENTER"><font COLOR="000000" SIZE="2" face="Verdana">-</font></p>       </td>       <td VALIGN="top" align="center">             <p ALIGN="CENTER"><font COLOR="000000" SIZE="2" face="Verdana">-</font></p>       </td>       <td VALIGN="top" align="center">             <p ALIGN="CENTER"><font COLOR="000000" SIZE="2" face="Verdana">-</font></p>       </td>     </tr>     <tr>       <td VALIGN="top" align="center">             <p ALIGN="LEFT"><font COLOR="000000" SIZE="2" face="Verdana">Gompertz-2</font></p>       </td>       <td VALIGN="top" align="center">             <p ALIGN="CENTER"><font COLOR="000000" SIZE="2" face="Verdana">3,1926</font></p>       </td>       <td VALIGN="top" align="center">             ]]></body>
<body><![CDATA[<p ALIGN="CENTER"><font COLOR="000000" SIZE="2" face="Verdana">0,2963</font></p>       </td>       <td VALIGN="top" align="center">             <p ALIGN="CENTER"><font COLOR="000000" SIZE="2" face="Verdana">6,4535</font></p>       </td>       <td VALIGN="top" align="center">             <p ALIGN="CENTER"><font COLOR="000000" SIZE="2" face="Verdana">3,3829</font></p>       </td>       <td VALIGN="top" align="center">             <p ALIGN="CENTER"><font COLOR="000000" SIZE="2" face="Verdana">-</font></p>       </td>       <td VALIGN="top" align="center">             <p ALIGN="CENTER"><font COLOR="000000" SIZE="2" face="Verdana">-</font></p>       </td>       <td VALIGN="top" align="center">             <p ALIGN="CENTER"><font COLOR="000000" SIZE="2" face="Verdana">-</font></p>       </td>       <td VALIGN="top" align="center">             <p ALIGN="CENTER"><font COLOR="000000" SIZE="2" face="Verdana">-</font></p>       </td>     </tr>     <tr>       <td VALIGN="top" align="center">             <p ALIGN="LEFT"><font COLOR="000000" SIZE="2" face="Verdana">Logístico-1</font></p>       </td>       <td VALIGN="top" align="center">             <p ALIGN="CENTER"><font COLOR="000000" SIZE="2" face="Verdana">10,1837</font></p>       </td>       <td VALIGN="top" align="center">             <p ALIGN="CENTER"><font COLOR="000000" SIZE="2" face="Verdana">0,6407</font></p>       </td>       <td VALIGN="top" align="center">             ]]></body>
<body><![CDATA[<p ALIGN="CENTER"><font COLOR="000000" SIZE="2" face="Verdana">-</font></p>       </td>       <td VALIGN="top" align="center">             <p ALIGN="CENTER"><font COLOR="000000" SIZE="2" face="Verdana">0,2533</font></p>       </td>       <td VALIGN="top" align="center">             <p ALIGN="CENTER"><font COLOR="000000" SIZE="2" face="Verdana">-</font></p>       </td>       <td VALIGN="top" align="center">             <p ALIGN="CENTER"><font COLOR="000000" SIZE="2" face="Verdana">-</font></p>       </td>       <td VALIGN="top" align="center">             <p ALIGN="CENTER"><font COLOR="000000" SIZE="2" face="Verdana">-</font></p>       </td>       <td VALIGN="top" align="center">             <p ALIGN="CENTER"><font COLOR="000000" SIZE="2" face="Verdana">-</font></p>       </td>     </tr>     <tr>       <td VALIGN="top" align="center">             <p ALIGN="LEFT"><font COLOR="000000" SIZE="2" face="Verdana">Logístico-2</font></p>       </td>       <td VALIGN="top" align="center">             <p ALIGN="CENTER"><font COLOR="000000" SIZE="2" face="Verdana">2,3701</font></p>       </td>       <td VALIGN="top" align="center">             <p ALIGN="CENTER"><font COLOR="000000" SIZE="2" face="Verdana">0,3988</font></p>       </td>       <td VALIGN="top" align="center">             <p ALIGN="CENTER"><font COLOR="000000" SIZE="2" face="Verdana">6,9584</font></p>       </td>       <td VALIGN="top" align="center">             ]]></body>
<body><![CDATA[<p ALIGN="CENTER"><font COLOR="000000" SIZE="2" face="Verdana">3,8239</font></p>       </td>       <td VALIGN="top" align="center">             <p ALIGN="CENTER"><font COLOR="000000" SIZE="2" face="Verdana">-</font></p>       </td>       <td VALIGN="top" align="center">             <p ALIGN="CENTER"><font COLOR="000000" SIZE="2" face="Verdana">-</font></p>       </td>       <td VALIGN="top" align="center">             <p ALIGN="CENTER"><font COLOR="000000" SIZE="2" face="Verdana">-</font></p>       </td>       <td VALIGN="top" align="center">             <p ALIGN="CENTER"><font COLOR="000000" SIZE="2" face="Verdana">-</font></p>       </td>     </tr>     <tr>       <td VALIGN="top" align="center">             <p ALIGN="LEFT"><font COLOR="000000" SIZE="2" face="Verdana">Stannard</font></p>       </td>       <td VALIGN="top" align="center">             <p ALIGN="CENTER"><font COLOR="000000" SIZE="2" face="Verdana">9,0455</font></p>       </td>       <td VALIGN="top" align="center">             <p ALIGN="CENTER"><font COLOR="000000" SIZE="2" face="Verdana">-0,9170</font></p>       </td>       <td VALIGN="top" align="center">             <p ALIGN="CENTER"><font COLOR="000000" SIZE="2" face="Verdana">-</font></p>       </td>       <td VALIGN="top" align="center">             <p ALIGN="CENTER"><font COLOR="000000" SIZE="2" face="Verdana">-</font></p>       </td>       <td VALIGN="top" align="center">             ]]></body>
<body><![CDATA[<p ALIGN="CENTER"><font COLOR="000000" SIZE="2" face="Verdana">0,2226</font></p>       </td>       <td VALIGN="top" align="center">             <p ALIGN="CENTER"><font COLOR="000000" SIZE="2" face="Verdana">0,1335</font></p>       </td>       <td VALIGN="top" align="center">             <p ALIGN="CENTER"><font COLOR="000000" SIZE="2" face="Verdana">-</font></p>       </td>       <td VALIGN="top" align="center">             <p ALIGN="CENTER"><font COLOR="000000" SIZE="2" face="Verdana">-</font></p>       </td>     </tr>     <tr>       <td VALIGN="top" align="center">             <p ALIGN="LEFT"><font COLOR="000000" SIZE="2" face="Verdana">Richards</font></p>       </td>       <td VALIGN="top" align="center">             <p ALIGN="CENTER"><font COLOR="000000" SIZE="2" face="Verdana">9,0455</font></p>       </td>       <td VALIGN="top" align="center">             <p ALIGN="CENTER"><font COLOR="000000" SIZE="2" face="Verdana">-</font></p>       </td>       <td VALIGN="top" align="center">             <p ALIGN="CENTER"><font COLOR="000000" SIZE="2" face="Verdana">-</font></p>       </td>       <td VALIGN="top" align="center">             <p ALIGN="CENTER"><font COLOR="000000" SIZE="2" face="Verdana">-</font></p>       </td>       <td VALIGN="top" align="center">             <p ALIGN="CENTER"><font COLOR="000000" SIZE="2" face="Verdana">-</font></p>       </td>       <td VALIGN="top" align="center">             ]]></body>
<body><![CDATA[<p ALIGN="CENTER"><font COLOR="000000" SIZE="2" face="Verdana">0,5998</font></p>       </td>       <td VALIGN="top" align="center">             <p ALIGN="CENTER"><font COLOR="000000" SIZE="2" face="Verdana">4,4915</font></p>       </td>       <td VALIGN="top" align="center">             <p ALIGN="CENTER"><font COLOR="000000" SIZE="2" face="Verdana">4,3629</font></p>       </td>     </tr>   </table>   </center> </div>     <p ALIGN="CENTER"><font face="Verdana" size="2" color="000000"><b><a name="TABLA III">TABLA III</a>. </b>PARÁMETROS ESTIMADOS POR LOS DIFERENTES MODELOS APLICADOS AL CRECIMIENTO DE <i>Lactococcus lactis</i> subsp. <i>lactis </i>EN LECHE DE BÚFALA / PARAMETERS ESTIMATED BY DIFFERENT MODELS APPLIED TO THE GROWTH OF <i>Lactococcus lactis </i>subsp<i>. lactis</i> IN BUFFALO’S MILK</font></p>     <div align="center">       <center>   <table width="550" border="1">     <tr>       <td VALIGN="top" ROWSPAN="2" align="center">             <p ALIGN="center"><font COLOR="000000" SIZE="2" face="Verdana">Modelo</font></p>       </td>       <td VALIGN="top" COLSPAN="8" align="center">             <p ALIGN="CENTER"><font COLOR="000000" SIZE="2" face="Verdana">Parámetros</font></p>       </td>     </tr>     <tr>       <td VALIGN="top" align="center">             <p ALIGN="CENTER"><font COLOR="000000" SIZE="2" face="Verdana">A</font></p>       </td>       <td VALIGN="top" align="center">             <p ALIGN="CENTER"><font COLOR="000000" SIZE="2" face="Verdana">B</font></p>       </td>       <td VALIGN="top" align="center">             ]]></body>
<body><![CDATA[<p ALIGN="CENTER"><font COLOR="000000" SIZE="2" face="Verdana">D</font></p>       </td>       <td VALIGN="top" align="center">             <p ALIGN="CENTER"><font COLOR="000000" SIZE="2" face="Verdana">M</font></p>       </td>       <td VALIGN="top" align="center">             <p ALIGN="CENTER"><font COLOR="000000" SIZE="2" face="Verdana">p</font></p>       </td>       <td VALIGN="top" align="center">             <p ALIGN="CENTER"><font COLOR="000000" SIZE="2" face="Verdana">k</font></p>       </td>       <td VALIGN="top" align="center">             <p ALIGN="CENTER"><font COLOR="000000" SIZE="2" face="Verdana">v</font></p>       </td>       <td VALIGN="top" align="center">             <p ALIGN="CENTER"><font COLOR="000000" SIZE="2" face="Verdana">t</font></p>       </td>     </tr>     <tr>       <td VALIGN="top" align="center">             <p ALIGN="LEFT"><font COLOR="000000" SIZE="2" face="Verdana">Gompertz-1</font></p>       </td>       <td VALIGN="top" align="center">             <p ALIGN="CENTER"><font COLOR="000000" SIZE="2" face="Verdana">11,4382</font></p>       </td>       <td VALIGN="top" align="center">             <p ALIGN="CENTER"><font COLOR="000000" SIZE="2" face="Verdana">0,1740</font></p>       </td>       <td VALIGN="top" align="center">             <p ALIGN="CENTER"><font COLOR="000000" SIZE="2" face="Verdana">-</font></p>       </td>       <td VALIGN="top" align="center">             ]]></body>
<body><![CDATA[<p ALIGN="CENTER"><font COLOR="000000" SIZE="2" face="Verdana">0,1596</font></p>       </td>       <td VALIGN="top" align="center">             <p ALIGN="CENTER"><font COLOR="000000" SIZE="2" face="Verdana">-</font></p>       </td>       <td VALIGN="top" align="center">             <p ALIGN="CENTER"><font COLOR="000000" SIZE="2" face="Verdana">-</font></p>       </td>       <td VALIGN="top" align="center">             <p ALIGN="CENTER"><font COLOR="000000" SIZE="2" face="Verdana">-</font></p>       </td>       <td VALIGN="top" align="center">             <p ALIGN="CENTER"><font COLOR="000000" SIZE="2" face="Verdana">-</font></p>       </td>     </tr>     <tr>       <td VALIGN="top" align="center">             <p ALIGN="LEFT"><font COLOR="000000" SIZE="2" face="Verdana">Gompertz-2</font></p>       </td>       <td VALIGN="top" align="center">             <p ALIGN="CENTER"><font COLOR="000000" SIZE="2" face="Verdana">3,0634</font></p>       </td>       <td VALIGN="top" align="center">             <p ALIGN="CENTER"><font COLOR="000000" SIZE="2" face="Verdana">0,2848</font></p>       </td>       <td VALIGN="top" align="center">             <p ALIGN="CENTER"><font COLOR="000000" SIZE="2" face="Verdana">6,7836</font></p>       </td>       <td VALIGN="top" align="center">             <p ALIGN="CENTER"><font COLOR="000000" SIZE="2" face="Verdana">3,2946</font></p>       </td>       <td VALIGN="top" align="center">             ]]></body>
<body><![CDATA[<p ALIGN="CENTER"><font COLOR="000000" SIZE="2" face="Verdana">-</font></p>       </td>       <td VALIGN="top" align="center">             <p ALIGN="CENTER"><font COLOR="000000" SIZE="2" face="Verdana">-</font></p>       </td>       <td VALIGN="top" align="center">             <p ALIGN="CENTER"><font COLOR="000000" SIZE="2" face="Verdana">-</font></p>       </td>       <td VALIGN="top" align="center">             <p ALIGN="CENTER"><font COLOR="000000" SIZE="2" face="Verdana">-</font></p>       </td>     </tr>     <tr>       <td VALIGN="top" align="center">             <p ALIGN="LEFT"><font COLOR="000000" SIZE="2" face="Verdana">Logístico-1</font></p>       </td>       <td VALIGN="top" align="center">             <p ALIGN="CENTER"><font COLOR="000000" SIZE="2" face="Verdana">10,2523</font></p>       </td>       <td VALIGN="top" align="center">             <p ALIGN="CENTER"><font COLOR="000000" SIZE="2" face="Verdana">0,6567</font></p>       </td>       <td VALIGN="top" align="center">             <p ALIGN="CENTER"><font COLOR="000000" SIZE="2" face="Verdana">-</font></p>       </td>       <td VALIGN="top" align="center">             <p ALIGN="CENTER"><font COLOR="000000" SIZE="2" face="Verdana">0,2587</font></p>       </td>       <td VALIGN="top" align="center">             <p ALIGN="CENTER"><font COLOR="000000" SIZE="2" face="Verdana">-</font></p>       </td>       <td VALIGN="top" align="center">             ]]></body>
<body><![CDATA[<p ALIGN="CENTER"><font COLOR="000000" SIZE="2" face="Verdana">-</font></p>       </td>       <td VALIGN="top" align="center">             <p ALIGN="CENTER"><font COLOR="000000" SIZE="2" face="Verdana">-</font></p>       </td>       <td VALIGN="top" align="center">             <p ALIGN="CENTER"><font COLOR="000000" SIZE="2" face="Verdana">-</font></p>       </td>     </tr>     <tr>       <td VALIGN="top" align="center">             <p ALIGN="LEFT"><font COLOR="000000" SIZE="2" face="Verdana">Logístico-2</font></p>       </td>       <td VALIGN="top" align="center">             <p ALIGN="CENTER"><font COLOR="000000" SIZE="2" face="Verdana">2,2350</font></p>       </td>       <td VALIGN="top" align="center">             <p ALIGN="CENTER"><font COLOR="000000" SIZE="2" face="Verdana">0,3899</font></p>       </td>       <td VALIGN="top" align="center">             <p ALIGN="CENTER"><font COLOR="000000" SIZE="2" face="Verdana">7,2408</font></p>       </td>       <td VALIGN="top" align="center">             <p ALIGN="CENTER"><font COLOR="000000" SIZE="2" face="Verdana">3,7547</font></p>       </td>       <td VALIGN="top" align="center">             <p ALIGN="CENTER"><font COLOR="000000" SIZE="2" face="Verdana">-</font></p>       </td>       <td VALIGN="top" align="center">             <p ALIGN="CENTER"><font COLOR="000000" SIZE="2" face="Verdana">-</font></p>       </td>       <td VALIGN="top" align="center">             ]]></body>
<body><![CDATA[<p ALIGN="CENTER"><font COLOR="000000" SIZE="2" face="Verdana">-</font></p>       </td>       <td VALIGN="top" align="center">             <p ALIGN="CENTER"><font COLOR="000000" SIZE="2" face="Verdana">-</font></p>       </td>     </tr>     <tr>       <td VALIGN="top" align="center">             <p ALIGN="LEFT"><font COLOR="000000" SIZE="2" face="Verdana">Stannard</font></p>       </td>       <td VALIGN="top" align="center">             <p ALIGN="CENTER"><font COLOR="000000" SIZE="2" face="Verdana">9,1214</font></p>       </td>       <td VALIGN="top" align="center">             <p ALIGN="CENTER"><font COLOR="000000" SIZE="2" face="Verdana">-0,9274</font></p>       </td>       <td VALIGN="top" align="center">             <p ALIGN="CENTER"><font COLOR="000000" SIZE="2" face="Verdana">-</font></p>       </td>       <td VALIGN="top" align="center">             <p ALIGN="CENTER"><font COLOR="000000" SIZE="2" face="Verdana">-</font></p>       </td>       <td VALIGN="top" align="center">             <p ALIGN="CENTER"><font COLOR="000000" SIZE="2" face="Verdana">0,2178</font></p>       </td>       <td VALIGN="top" align="center">             <p ALIGN="CENTER"><font COLOR="000000" SIZE="2" face="Verdana">0,1353</font></p>       </td>       <td VALIGN="top" align="center">             <p ALIGN="CENTER"><font COLOR="000000" SIZE="2" face="Verdana">-</font></p>       </td>       <td VALIGN="top" align="center">             ]]></body>
<body><![CDATA[<p ALIGN="CENTER"><font COLOR="000000" SIZE="2" face="Verdana">-</font></p>       </td>     </tr>     <tr>       <td VALIGN="top" align="center">             <p ALIGN="LEFT"><font COLOR="000000" SIZE="2" face="Verdana">Richards</font></p>       </td>       <td VALIGN="top" align="center">             <p ALIGN="CENTER"><font COLOR="000000" SIZE="2" face="Verdana">9,1215</font></p>       </td>       <td VALIGN="top" align="center">             <p ALIGN="CENTER"><font COLOR="000000" SIZE="2" face="Verdana">-</font></p>       </td>       <td VALIGN="top" align="center">             <p ALIGN="CENTER"><font COLOR="000000" SIZE="2" face="Verdana">-</font></p>       </td>       <td VALIGN="top" align="center">             <p ALIGN="CENTER"><font COLOR="000000" SIZE="2" face="Verdana">-</font></p>       </td>       <td VALIGN="top" align="center">             <p ALIGN="CENTER"><font COLOR="000000" SIZE="2" face="Verdana">-</font></p>       </td>       <td VALIGN="top" align="center">             <p ALIGN="CENTER"><font COLOR="000000" SIZE="2" face="Verdana">0,6214</font></p>       </td>       <td VALIGN="top" align="center">             <p ALIGN="CENTER"><font COLOR="000000" SIZE="2" face="Verdana">4,5923</font></p>       </td>       <td VALIGN="top" align="center">             <p ALIGN="CENTER"><font COLOR="000000" SIZE="2" face="Verdana">4,4007</font></p>       </td>     </tr>   </table>   </center> </div>      ]]></body>
<body><![CDATA[<P ALIGN="justify" style="word-spacing: 0; line-height: 100%"><FONT COLOR="000000" size="2" face="Verdana"> En las <a href="#TABLA IV"> TABLAS IV </a> y <a href="#TABLA V"> V </a> se presentan los SCR, cuadrado medio de las residuales  (CMR) y los <I>R</I><SUP>2</SUP> de los diferentes modelos aplicados al crecimiento del <I>Lactococcus</I>  en leche de vaca y búfala, respectivamente. Se observa que los <I>R</I><SUP>2</SUP> están  por encima de 0,99 lo cual significa que todos los modelos ajustaron bien  a los datos experimentales, tanto para leche de vaca como para leche de  búfala. La similitud en el ajuste de los diferentes modelos puede ser apreciado  por los valores obtenidos en el CMR y la SCR.  </FONT></P>      <div align="center">       <center>   <table width="550" border="1">     <tr>       <td VALIGN="TOP" COLSPAN="6">             <p ALIGN="CENTER"><font face="Verdana" size="2" color="000000"><b><a name="TABLA IV">TABLA         IV</a>. </b>DIFICULTAD PARA EL AJUSTE DE LOS DIFERENTES MODELOS         APLICADOS AL CRECIMIENTO DE <i>Lactococcus lactis </i>subsp. <i>lactis </i>EN         LECHE DE VACA / DIFFICULTY FOR THE FIT OF DIFFERENT MODELS APPLIED TO         THE GROWTH OF <i>Lactococcus lactis </i>subsp<i>. lactis</i> IN COW’S         MILK.</font></p>       </td>     </tr>     <tr>       <td VALIGN="TOP">             <p ALIGN="LEFT"><font COLOR="000000" SIZE="2" face="Verdana">Modelo</font></p>       </td>       <td VALIGN="TOP">             <p ALIGN="CENTER"><font COLOR="000000" SIZE="2" face="Verdana">Tiempo</font></p>       </td>       <td VALIGN="TOP">             <p ALIGN="CENTER"><font COLOR="000000" SIZE="2" face="Verdana">Nº         Iteraciones</font></p>       </td>       <td VALIGN="TOP">             <p ALIGN="CENTER"><font COLOR="000000" SIZE="2" face="Verdana">SCR</font></p>       </td>       <td VALIGN="TOP">             <p ALIGN="CENTER"><font COLOR="000000" SIZE="2" face="Verdana">CMR</font></p>       </td>       <td VALIGN="TOP">             <p ALIGN="CENTER"><font color="000000" face="Verdana" size="2"><i>R</i><sup><i>2</i></sup></font></p>       </td>     </tr>     <tr>       <td VALIGN="TOP">             ]]></body>
<body><![CDATA[<p ALIGN="LEFT"><font COLOR="000000" SIZE="2" face="Verdana">Gompertz-1</font></p>       </td>       <td VALIGN="TOP">             <p ALIGN="CENTER"><font COLOR="000000" SIZE="2" face="Verdana">0,12</font></p>       </td>       <td VALIGN="TOP">             <p ALIGN="CENTER"><font COLOR="000000" SIZE="2" face="Verdana">18</font></p>       </td>       <td VALIGN="TOP">             <p ALIGN="CENTER"><font COLOR="000000" SIZE="2" face="Verdana">3,9368</font></p>       </td>       <td VALIGN="TOP">             <p ALIGN="CENTER"><font COLOR="000000" SIZE="2" face="Verdana">0,1192</font></p>       </td>       <td VALIGN="TOP">             <p ALIGN="CENTER"><font COLOR="000000" SIZE="2" face="Verdana">0,9975</font></p>       </td>     </tr>     <tr>       <td VALIGN="TOP">             <p ALIGN="LEFT"><font COLOR="000000" SIZE="2" face="Verdana">Gompertz-2</font></p>       </td>       <td VALIGN="TOP">             <p ALIGN="CENTER"><font COLOR="000000" SIZE="2" face="Verdana">0,10</font></p>       </td>       <td VALIGN="TOP">             <p ALIGN="CENTER"><font COLOR="000000" SIZE="2" face="Verdana">8</font></p>       </td>       <td VALIGN="TOP">             <p ALIGN="CENTER"><font COLOR="000000" SIZE="2" face="Verdana">3,4947</font></p>       </td>       <td VALIGN="TOP">             ]]></body>
<body><![CDATA[<p ALIGN="CENTER"><font COLOR="000000" SIZE="2" face="Verdana">0,1092</font></p>       </td>       <td VALIGN="TOP">             <p ALIGN="CENTER"><font COLOR="000000" SIZE="2" face="Verdana">0,9978</font></p>       </td>     </tr>     <tr>       <td VALIGN="TOP">             <p ALIGN="LEFT"><font COLOR="000000" SIZE="2" face="Verdana">Logístico-1</font></p>       </td>       <td VALIGN="TOP">             <p ALIGN="CENTER"><font COLOR="000000" SIZE="2" face="Verdana">0,09</font></p>       </td>       <td VALIGN="TOP">             <p ALIGN="CENTER"><font COLOR="000000" SIZE="2" face="Verdana">8</font></p>       </td>       <td VALIGN="TOP">             <p ALIGN="CENTER"><font COLOR="000000" SIZE="2" face="Verdana">3,7116</font></p>       </td>       <td VALIGN="TOP">             <p ALIGN="CENTER"><font COLOR="000000" SIZE="2" face="Verdana">0,1125</font></p>       </td>       <td VALIGN="TOP">             <p ALIGN="CENTER"><font COLOR="000000" SIZE="2" face="Verdana">0,9977</font></p>       </td>     </tr>     <tr>       <td VALIGN="TOP">             <p ALIGN="LEFT"><font COLOR="000000" SIZE="2" face="Verdana">Logístico-2</font></p>       </td>       <td VALIGN="TOP">             <p ALIGN="CENTER"><font COLOR="000000" SIZE="2" face="Verdana">0,07</font></p>       </td>       <td VALIGN="TOP">             ]]></body>
<body><![CDATA[<p ALIGN="CENTER"><font COLOR="000000" SIZE="2" face="Verdana">7</font></p>       </td>       <td VALIGN="TOP">             <p ALIGN="CENTER"><font COLOR="000000" SIZE="2" face="Verdana">3,4574</font></p>       </td>       <td VALIGN="TOP">             <p ALIGN="CENTER"><font COLOR="000000" SIZE="2" face="Verdana">0,1080</font></p>       </td>       <td VALIGN="TOP">             <p ALIGN="CENTER"><font COLOR="000000" SIZE="2" face="Verdana">0,9978</font></p>       </td>     </tr>     <tr>       <td VALIGN="TOP">             <p ALIGN="LEFT"><font COLOR="000000" SIZE="2" face="Verdana">Stannard</font></p>       </td>       <td VALIGN="TOP">             <p ALIGN="CENTER"><font COLOR="000000" SIZE="2" face="Verdana">0,12</font></p>       </td>       <td VALIGN="TOP">             <p ALIGN="CENTER"><font COLOR="000000" SIZE="2" face="Verdana">25</font></p>       </td>       <td VALIGN="TOP">             <p ALIGN="CENTER"><font COLOR="000000" SIZE="2" face="Verdana">3,4377</font></p>       </td>       <td VALIGN="TOP">             <p ALIGN="CENTER"><font COLOR="000000" SIZE="2" face="Verdana">0,1074</font></p>       </td>       <td VALIGN="TOP">             <p ALIGN="CENTER"><font COLOR="000000" SIZE="2" face="Verdana">0,9978</font></p>       </td>     </tr>     <tr>       <td VALIGN="TOP">             ]]></body>
<body><![CDATA[<p ALIGN="LEFT"><font COLOR="000000" SIZE="2" face="Verdana">Richards</font></p>       </td>       <td VALIGN="TOP">             <p ALIGN="CENTER"><font COLOR="000000" SIZE="2" face="Verdana">0,12</font></p>       </td>       <td VALIGN="TOP">             <p ALIGN="CENTER"><font COLOR="000000" SIZE="2" face="Verdana">15</font></p>       </td>       <td VALIGN="TOP">             <p ALIGN="CENTER"><font COLOR="000000" SIZE="2" face="Verdana">3,4377</font></p>       </td>       <td VALIGN="TOP">             <p ALIGN="CENTER"><font COLOR="000000" SIZE="2" face="Verdana">0,1074</font></p>       </td>       <td VALIGN="TOP">             <p ALIGN="CENTER"><font COLOR="000000" SIZE="2" face="Verdana">0,9978</font></p>       </td>     </tr>     <tr>       <td VALIGN="TOP" COLSPAN="6">             <p ALIGN="LEFT"><font color="000000" face="Verdana" size="2">SCR: suma         de cuadrado de residuales; CMR: cuadrado medio de residuales; <i>R</i><sup><i>2</i></sup><sub>:</sub>coeficientes         de determinación.</font></p>       </td>     </tr>   </table>   </center> </div>     <p ALIGN="CENTER"><font face="Verdana" size="2" color="000000"><b><a name="TABLA V">TABLA V</a>. </b>DIFICULTAD PARA EL AJUSTE DE LOS DIFERENTES MODELOS APLICADOS AL CRECIMIENTO DE <i>Lactococcus lactis </i>subsp. <i>lactis </i>EN LECHE DE BÚFALA / DIFFICULTY FOR THE FIT OF DIFFERENT MODELS APPLIED TO THE GROWTH OF <i>Lactococcus lactis</i> subsp. <i>lactis</i> IN BUFFALO´S MILK.</font></p>     <div align="center">       <center>   <table width="550" border="1">     <tr>       <td VALIGN="TOP">             ]]></body>
<body><![CDATA[<p ALIGN="LEFT"><font COLOR="000000" SIZE="2" face="Verdana">Modelo</font></p>       </td>       <td VALIGN="TOP">             <p ALIGN="CENTER"><font COLOR="000000" SIZE="2" face="Verdana">Tiempo</font></p>       </td>       <td VALIGN="TOP">             <p ALIGN="CENTER"><font COLOR="000000" SIZE="2" face="Verdana">Nº         Iteraciones</font></p>       </td>       <td VALIGN="TOP">             <p ALIGN="CENTER"><font COLOR="000000" SIZE="2" face="Verdana">SCR</font></p>       </td>       <td VALIGN="TOP">             <p ALIGN="CENTER"><font COLOR="000000" SIZE="2" face="Verdana">CMR</font></p>       </td>       <td VALIGN="TOP">             <p ALIGN="CENTER"><font color="000000" face="Verdana" size="2"><i>R</i><sup><i>2</i></sup></font></p>       </td>     </tr>     <tr>       <td VALIGN="TOP">             <p ALIGN="LEFT"><font COLOR="000000" SIZE="2" face="Verdana">Gompertz-1</font></p>       </td>       <td VALIGN="TOP">             <p ALIGN="CENTER"><font COLOR="000000" SIZE="2" face="Verdana">0,20</font></p>       </td>       <td VALIGN="TOP">             <p ALIGN="CENTER"><font COLOR="000000" SIZE="2" face="Verdana">18</font></p>       </td>       <td VALIGN="TOP">             <p ALIGN="CENTER"><font COLOR="000000" SIZE="2" face="Verdana">4,2812</font></p>       </td>       <td VALIGN="TOP">             ]]></body>
<body><![CDATA[<p ALIGN="CENTER"><font COLOR="000000" SIZE="2" face="Verdana">0,1297</font></p>       </td>       <td VALIGN="TOP">             <p ALIGN="CENTER"><font COLOR="000000" SIZE="2" face="Verdana">0,9974</font></p>       </td>     </tr>     <tr>       <td VALIGN="TOP">             <p ALIGN="LEFT"><font COLOR="000000" SIZE="2" face="Verdana">Gompertz-2</font></p>       </td>       <td VALIGN="TOP">             <p ALIGN="CENTER"><font COLOR="000000" SIZE="2" face="Verdana">0,18</font></p>       </td>       <td VALIGN="TOP">             <p ALIGN="CENTER"><font COLOR="000000" SIZE="2" face="Verdana">8</font></p>       </td>       <td VALIGN="TOP">             <p ALIGN="CENTER"><font COLOR="000000" SIZE="2" face="Verdana">3,9169</font></p>       </td>       <td VALIGN="TOP">             <p ALIGN="CENTER"><font COLOR="000000" SIZE="2" face="Verdana">0,1224</font></p>       </td>       <td VALIGN="TOP">             <p ALIGN="CENTER"><font COLOR="000000" SIZE="2" face="Verdana">0,9976</font></p>       </td>     </tr>     <tr>       <td VALIGN="TOP">             <p ALIGN="LEFT"><font COLOR="000000" SIZE="2" face="Verdana">Logístico-1</font></p>       </td>       <td VALIGN="TOP">             <p ALIGN="CENTER"><font COLOR="000000" SIZE="2" face="Verdana">0,14</font></p>       </td>       <td VALIGN="TOP">             ]]></body>
<body><![CDATA[<p ALIGN="CENTER"><font COLOR="000000" SIZE="2" face="Verdana">9</font></p>       </td>       <td VALIGN="TOP">             <p ALIGN="CENTER"><font COLOR="000000" SIZE="2" face="Verdana">4,0561</font></p>       </td>       <td VALIGN="TOP">             <p ALIGN="CENTER"><font COLOR="000000" SIZE="2" face="Verdana">0,1229</font></p>       </td>       <td VALIGN="TOP">             <p ALIGN="CENTER"><font COLOR="000000" SIZE="2" face="Verdana">0,9976</font></p>       </td>     </tr>     <tr>       <td VALIGN="TOP">             <p ALIGN="LEFT"><font COLOR="000000" SIZE="2" face="Verdana">Logístico-2</font></p>       </td>       <td VALIGN="TOP">             <p ALIGN="CENTER"><font COLOR="000000" SIZE="2" face="Verdana">0,10</font></p>       </td>       <td VALIGN="TOP">             <p ALIGN="CENTER"><font COLOR="000000" SIZE="2" face="Verdana">8</font></p>       </td>       <td VALIGN="TOP">             <p ALIGN="CENTER"><font COLOR="000000" SIZE="2" face="Verdana">3,8438</font></p>       </td>       <td VALIGN="TOP">             <p ALIGN="CENTER"><font COLOR="000000" SIZE="2" face="Verdana">0,1201</font></p>       </td>       <td VALIGN="TOP">             <p ALIGN="CENTER"><font COLOR="000000" SIZE="2" face="Verdana">0,9977</font></p>       </td>     </tr>     <tr>       <td VALIGN="TOP">             ]]></body>
<body><![CDATA[<p ALIGN="LEFT"><font COLOR="000000" SIZE="2" face="Verdana">Stannard</font></p>       </td>       <td VALIGN="TOP">             <p ALIGN="CENTER"><font COLOR="000000" SIZE="2" face="Verdana">0,17</font></p>       </td>       <td VALIGN="TOP">             <p ALIGN="CENTER"><font COLOR="000000" SIZE="2" face="Verdana">38</font></p>       </td>       <td VALIGN="TOP">             <p ALIGN="CENTER"><font COLOR="000000" SIZE="2" face="Verdana">3,7772</font></p>       </td>       <td VALIGN="TOP">             <p ALIGN="CENTER"><font COLOR="000000" SIZE="2" face="Verdana">0,1180</font></p>       </td>       <td VALIGN="TOP">             <p ALIGN="CENTER"><font COLOR="000000" SIZE="2" face="Verdana">0,9977</font></p>       </td>     </tr>     <tr>       <td VALIGN="TOP">             <p ALIGN="LEFT"><font COLOR="000000" SIZE="2" face="Verdana">Richards</font></p>       </td>       <td VALIGN="TOP">             <p ALIGN="CENTER"><font COLOR="000000" SIZE="2" face="Verdana">0,17</font></p>       </td>       <td VALIGN="TOP">             <p ALIGN="CENTER"><font COLOR="000000" SIZE="2" face="Verdana">17</font></p>       </td>       <td VALIGN="TOP">             <p ALIGN="CENTER"><font COLOR="000000" SIZE="2" face="Verdana">3,7772</font></p>       </td>       <td VALIGN="TOP">             ]]></body>
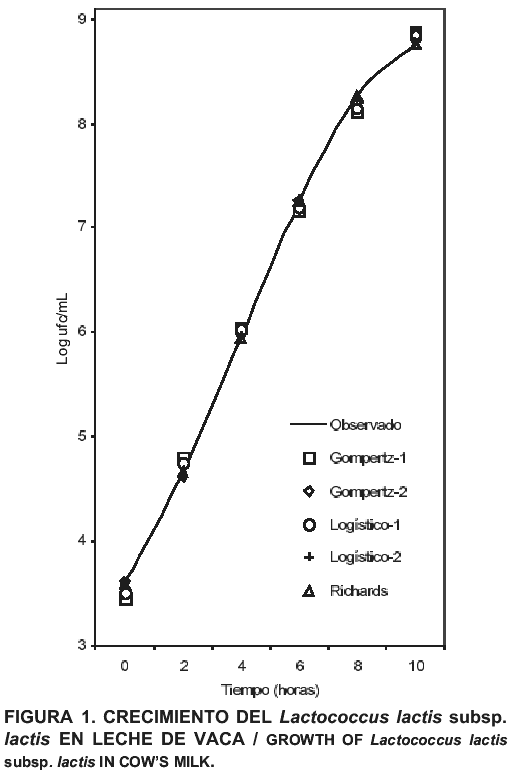
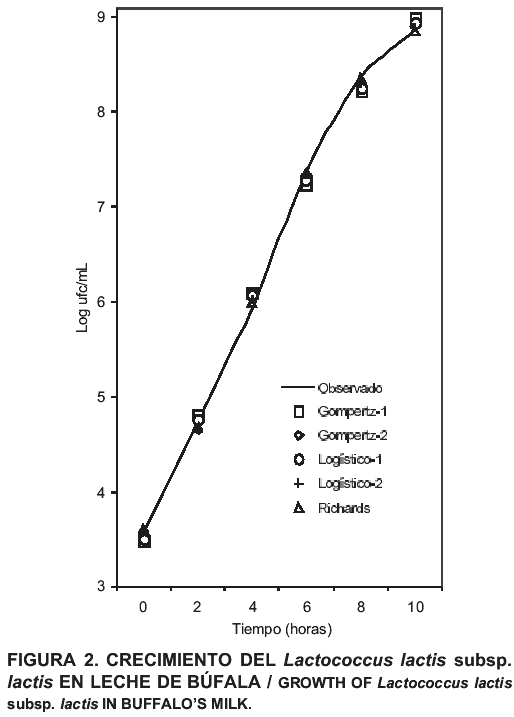
<body><![CDATA[<p ALIGN="CENTER"><font COLOR="000000" SIZE="2" face="Verdana">0,1180</font></p>       </td>       <td VALIGN="TOP">             <p ALIGN="CENTER"><font COLOR="000000" SIZE="2" face="Verdana">0,9977</font></p>       </td>     </tr>     <tr>       <td VALIGN="TOP" COLSPAN="6">             <p ALIGN="LEFT"><font color="000000" face="Verdana" size="2">SCR: suma         de cuadrado de residuales; CMR: cuadrado medio de residuales; <i>R</i><sup><i>2</i></sup><sub>:</sub>coeficientes         de determinación.</font></p>       </td>     </tr>   </table>   </center> </div>      <P ALIGN="justify" style="word-spacing: 0; line-height: 100%"><FONT COLOR="000000" size="2" face="Verdana"> Las <a href="#TABLA IV"> TABLAS IV</a> y <a href="#TABLA V"> V</a> también presentan los valores para el tiempo y número  de iteraciones necesarias para alcanzar el criterio de convergencia, lo  cual es utilizado para la comparación entre los modelos [9]. Se puede observar  que el tiempo tomado por los diferentes modelos para encontrar el ajuste  no es significativo (menos de 1 segundo), lo cual se debe a la poca cantidad  de datos experimentales obtenidos (36 para cada tipo de leche). </FONT></P>      <P ALIGN="justify" style="word-spacing: 0; line-height: 100%"><FONT COLOR="000000" size="2" face="Verdana"> Los modelos Stannard y Richards fueron los que tomaron mayor tiempo y además  presentaron un mayor número de iteraciones, comparado con los demás, siendo  el de Stannard el que presentó mayor número de iteraciones. La dificultad  mayor se observó al ajustar los datos para leche de búfala. Lo anterior  sugiere que estos modelos, a pesar de tener igual número de parámetros  que el de Gompertz-2 y Logístico-2, presentan mayor dificultad en el ajuste,  lo cual contradice uno de los principios antes expuestos y que se requiere  deban cumplir los modelos predictivos, como lo es la parsimonia. Estos  además, presentan parámetros de ajuste que no tienen significado biológico  y por lo tanto, ninguna interpretación.  </FONT></P>      <P ALIGN="justify" style="word-spacing: 0; line-height: 100%"><FONT COLOR="000000" size="2" face="Verdana"> El modelo que según el tiempo y el número de iteraciones resultó con mayor  facilidad, fue el modelo Logístico-2, tanto en leche de vaca como en la  de búfala. Esta observación concuerda con lo reportado por López y col.,  quien al comparar los modelos de Richards, Brody y Von Bertalanffy, encontró  que el primero fue el que presentó mayor dificultad en alcanzar el ajuste  de los datos experimentales [9]. </FONT></P>      <P ALIGN="justify" style="word-spacing: 0; line-height: 100%"><FONT COLOR="000000" size="2" face="Verdana"> La comparación de los modelos por medio de los valores del <I>R</I><SUP><I>2</I></SUP> solo es válido  entre aquellos con igual número de parámetros, ya que a medida que el número  de éstos aumentan, el <I>R</I><SUP><I>2</I></SUP> se acerca a la unidad por disminución del error  [22]. Tomando en cuenta esto, al comparar los modelos de tres parámetros,  Gompertz-1 y Logístico-1 entre ellos, y los de cuatro parámetros Gompertz-2,  Logístico-2, Stannard y Richard, por simple observación de los <I>R</I><SUP><I>2</I></SUP>, se concluye  que no hay diferencia en el ajuste realizado por los mismos. </FONT></P>      <P ALIGN="justify" style="word-spacing: 0; line-height: 100%"><FONT COLOR="000000" size="2" face="Verdana"> La prueba de falta de ajuste utilizada para comparar los modelos con diferentes  números de parámetros mostró diferencia significativa (P&lt;0,05) entre el  modelo Richards (tomado como referencia) y el modelo Gompertz-1. Mientras  que en la comparación con el modelo Logístico-1, no se encontró diferencia  significativa, aunque el error resultó mayor en este modelo que en los  de cuatro parámetros. Esta diferencia fue encontrada para ambos tipos de  leche evaluadas. </FONT></P>      <P ALIGN="justify" style="word-spacing: 0; line-height: 100%"><FONT COLOR="000000" size="2" face="Verdana"> Las<a href="#fig1"> FIGS. 1</a> y <a href="#fig2"> 2</a> presentan las curvas obtenidas con los datos observados  y ajustados por los diferentes modelos para leche de vaca y búfala, respectivamente.  En ellas se pueden apreciar también la similitud en el ajuste de los diferentes  modelos a los datos observados experimentalmente, además de la similitud  del ajuste entre los diferentes modelos. Debido a que los modelos Stannard  y Richards resultaron ser iguales en el ajuste, por lo cual los datos estimados  son idénticos, se omitió la curva para el modelo de Stannard. </FONT></P>      <P ALIGN="center" style="word-spacing: 0; line-height: 100%"><a name="fig1"><img border="0" src="/img/fbpe/rc/v18n5/art09fig1.gif" width="514" height="772"></a></P>      
]]></body>
<body><![CDATA[<P ALIGN="center" style="word-spacing: 0; line-height: 100%"><a name="fig2"><img border="0" src="/img/fbpe/rc/v18n5/art09fig2.gif" width="514" height="717"></a></P>      
<P ALIGN="justify" style="word-spacing: 0; line-height: 100%"><FONT COLOR="000000" size="2" face="Verdana"> Zwietering y col. [22], compararon los modelos de Gompertz (tres parámetros),  Logístico (tres parámetros), Stannard y Richards, encontrando que todos  los modelos ajustaron bien a la data experimental, aunque concluyeron que  el modelo de Gompertz fue suficiente para describir la curva de crecimiento  bacteriano, debido en parte a su facilidad de ajuste. Este resultado contrasta  con el obtenido en el presente estudio, donde el modelo que presentó mayor  error fue el de Gompertz de tres parámetros. </FONT></P>      <P ALIGN="justify" style="word-spacing: 0; line-height: 100%"><FONT COLOR="000000" size="2" face="Verdana"> Quirino y col. [14], utilizaron cuatro modelos sigmoidales (Brody, Logístico,  Gompertz y Richards) para caracterizar la circunferencia escrotal en toros  Nellore en crecimiento, utilizando la metodología de López para comparar  los diferentes modelos, encontrando mayor error, menor <I>R</I><SUP><I>2</I></SUP> y mayor dificultad  (numero de iteraciones) para el modelo de Richard y el mejor modelo en  este estudio resultó el modelo Logístico. </FONT></P>      <P ALIGN="justify" style="word-spacing: 0; line-height: 100%"><FONT COLOR="000000" size="2" face="Verdana"> Por su parte Cayré y col. [2], compararon el modelo de Gompertz y Logístico  de cuatro parámetros ambos, en el crecimiento de bacterias lácticas en  emulsiones cárnicas para predecir vida útil, concluyendo en que no existen  diferencias entre los modelos ajustados. </FONT></P>      <P ALIGN="justify" style="word-spacing: 0; line-height: 100%"><B><FONT COLOR="000000" size="2" face="Verdana"> CONCLUSIONES </FONT></B></P>      <P ALIGN="justify" style="word-spacing: 0; line-height: 100%"><FONT COLOR="000000" size="2" face="Verdana"> Todos los modelos presentaron un ajuste aceptable a los datos experimentales  obtenidos, tanto para leche de vaca como para leche de búfala. </FONT></P>      <P ALIGN="justify" style="word-spacing: 0; line-height: 100%"><FONT COLOR="000000" size="2" face="Verdana"> No se observaron diferencias entre los modelos con igual número de parámetros. </FONT></P>      <P ALIGN="justify" style="word-spacing: 0; line-height: 100%"><FONT COLOR="000000" size="2" face="Verdana"> El modelo de Gompertz de tres parámetros fue de todos, el que presentó  mayor error en el ajuste. </FONT></P>      <P ALIGN="justify" style="word-spacing: 0; line-height: 100%"><FONT COLOR="000000" size="2" face="Verdana"> Los modelos de Stannard y Richards fueron los que presentaron mayor dificultad  para alcanzar el criterio de convergencia. </FONT></P>      <P ALIGN="justify" style="word-spacing: 0; line-height: 100%"><FONT COLOR="000000" size="2" face="Verdana"> Se considera que los modelos Logístico (Logístico-2) y de Gompertz (Gompertz-2)  modificados por Gibson, son los mejores para modelar el crecimiento del  <I>Lactococcus lactis</I> subsp. <I>lactis </I>en leche estéril. </FONT></P>      ]]></body>
<body><![CDATA[<P ALIGN="justify" style="word-spacing: 0; line-height: 100%"><B><FONT COLOR="000000" size="2" face="Verdana"> RECOMENDACIONES </FONT></B></P>      <P ALIGN="justify" style="word-spacing: 0; line-height: 100%"><FONT COLOR="000000" size="2" face="Verdana"> Se recomienda hacer la comparación de los modelos con una mayor cantidad  de datos y bajo diferentes condiciones de crecimiento, a fin de determinar  como se comportan bajo diferentes tratamientos. </FONT></P>      <P ALIGN="justify" style="word-spacing: 0; line-height: 100%"><FONT COLOR="000000" size="2" face="Verdana"> Es ideal también realizar estas comparaciones con otros microorganismos  para determinar si se encuentran los mismos resultados. </FONT></P>      <P ALIGN="justify" style="word-spacing: 0; line-height: 100%"><FONT COLOR="000000" size="2" face="Verdana"> Al momento de realizar estudios de esta naturaleza, se requiere de la integración  de profesionales de las diferentes áreas involucradas (ingeniería, estadística,  microbiología) en la microbiología predictiva, para facilitar la interpretación  y discusión de los resultados obtenidos.  </FONT></P>      <P ALIGN="justify" style="word-spacing: 0; line-height: 100%"><B><FONT COLOR="000000" size="2" face="Verdana"> AGRADECIMIENTO </FONT></B></P>      <P ALIGN="justify" style="word-spacing: 0; line-height: 100%"><FONT COLOR="000000" size="2" face="Verdana"> Los autores agradecen a la División de Investigación de la Facultad de  Ciencias Veterinarias de la Universidad del Zulia, por haber colaborado  con el financiamiento necesario para la realización del estudio. </FONT></P>      <P ALIGN="justify" style="word-spacing: 0; line-height: 100%"><B><FONT COLOR="000000" size="2" face="Verdana"> REFERENCIAS &nbsp;BIBLIOGRÁFICAS </FONT></B></P>      <!-- ref --><p ALIGN="justify" style="word-spacing: 0; line-height: 100%"><font color="000000" face="Verdana" size="2">1. </font><FONT COLOR="000000" size="2" face="Verdana"> BIRCH, C. A New logistic sigmoid growth equation compared with the Richards  growth equation. <B>Ann Bot-London.</B> 83: 713-723. 1999. </FONT>&nbsp;&nbsp;&nbsp;&nbsp;&nbsp;&nbsp;&nbsp;&nbsp;[&#160;<a href="javascript:void(0);" onclick="javascript: window.open('/scielo.php?script=sci_nlinks&ref=1602925&pid=S0798-2259200800050000900001&lng=','','width=640,height=500,resizable=yes,scrollbars=1,menubar=yes,');">Links</a>&#160;]<!-- end-ref --><!-- ref --><p ALIGN="justify" style="word-spacing: 0; line-height: 100%"><font color="000000" face="Verdana" size="2">2. </font><FONT COLOR="000000" size="2" face="Verdana"> CAYRE, M.; VIGNOLO, G.; GARRO, O. Validación y comparación de modelos de  crecimiento microbiano. Universidad Nacional Del Nordeste, Comunicaciones  Científicas y Tecnológicas. Argentina. 4 pp. 2001. </FONT>&nbsp;&nbsp;&nbsp;&nbsp;&nbsp;&nbsp;&nbsp;&nbsp;[&#160;<a href="javascript:void(0);" onclick="javascript: window.open('/scielo.php?script=sci_nlinks&ref=1602926&pid=S0798-2259200800050000900002&lng=','','width=640,height=500,resizable=yes,scrollbars=1,menubar=yes,');">Links</a>&#160;]<!-- end-ref --><!-- ref --><p ALIGN="justify" style="word-spacing: 0; line-height: 100%"><font color="000000" face="Verdana" size="2">3. </font><FONT COLOR="000000" size="2" face="Verdana"> COMISIÓN VENEZOLANA DE NORMAS INDUSTRIALES (COVENIN) Leche fluida. Determinación  de acidez titulable. 3<SUP><U>a</U></SUP> Rev. No 658-1997. 5 pp.1997. </FONT>&nbsp;&nbsp;&nbsp;&nbsp;&nbsp;&nbsp;&nbsp;&nbsp;[&#160;<a href="javascript:void(0);" onclick="javascript: window.open('/scielo.php?script=sci_nlinks&ref=1602927&pid=S0798-2259200800050000900003&lng=','','width=640,height=500,resizable=yes,scrollbars=1,menubar=yes,');">Links</a>&#160;]<!-- end-ref --><!-- ref --><p ALIGN="justify" style="word-spacing: 0; line-height: 100%"><font color="000000" face="Verdana" size="2">4. </font><FONT COLOR="000000" size="2" face="Verdana"> COMISIÓN VENEZOLANA DE NORMAS INDUSTRIALES (COVENIN). Alimentos. Método  para recuento de colonias de bacterias aerobias en placas de Petri. No  902-87. 6 pp. 1987. </FONT>&nbsp;&nbsp;&nbsp;&nbsp;&nbsp;&nbsp;&nbsp;&nbsp;[&#160;<a href="javascript:void(0);" onclick="javascript: window.open('/scielo.php?script=sci_nlinks&ref=1602928&pid=S0798-2259200800050000900004&lng=','','width=640,height=500,resizable=yes,scrollbars=1,menubar=yes,');">Links</a>&#160;]<!-- end-ref --><!-- ref --><p ALIGN="justify" style="word-spacing: 0; line-height: 100%"><font color="000000" face="Verdana" size="2">5. </font><FONT COLOR="000000" size="2" face="Verdana"> GARCÍA, R.; HERVÁS, C.; RODRÍGUEZ, R.; ZURERA, G. Modelling the growth  of <I>Leuconostoc mesenteroides</I> by artificial neural networks. <B>Int J Food  Microbiol</B>. 105(3): 317-332. 2005. </FONT>&nbsp;&nbsp;&nbsp;&nbsp;&nbsp;&nbsp;&nbsp;&nbsp;[&#160;<a href="javascript:void(0);" onclick="javascript: window.open('/scielo.php?script=sci_nlinks&ref=1602929&pid=S0798-2259200800050000900005&lng=','','width=640,height=500,resizable=yes,scrollbars=1,menubar=yes,');">Links</a>&#160;]<!-- end-ref --><!-- ref --><p ALIGN="justify" style="word-spacing: 0; line-height: 100%"><font color="000000" face="Verdana" size="2">6. </font><FONT COLOR="000000" size="2" face="Verdana"> GEERAERD, A.; HERREMANS, C.; HERREMANS, M.; CENES, C.; VAN IMPE, J. Application  of artificial previous neural networks as a non linear technique to describe  bacterial growth in chilled food products. <B>Int J Food Microbiol</B>. 44: 49-68.  1998. </FONT>&nbsp;&nbsp;&nbsp;&nbsp;&nbsp;&nbsp;&nbsp;&nbsp;[&#160;<a href="javascript:void(0);" onclick="javascript: window.open('/scielo.php?script=sci_nlinks&ref=1602930&pid=S0798-2259200800050000900006&lng=','','width=640,height=500,resizable=yes,scrollbars=1,menubar=yes,');">Links</a>&#160;]<!-- end-ref --><!-- ref --><p ALIGN="justify" style="word-spacing: 0; line-height: 100%"><font color="000000" face="Verdana" size="2">7. </font><FONT COLOR="000000" size="2" face="Verdana"> HAJMEER, M.; BASHEER, I. Comparison of logistic regression and neural network-based  classifiers for bacterial growth. <B>Food Microbiol.</B> 20(1): 43-55. 2003. </FONT>&nbsp;&nbsp;&nbsp;&nbsp;&nbsp;&nbsp;&nbsp;&nbsp;[&#160;<a href="javascript:void(0);" onclick="javascript: window.open('/scielo.php?script=sci_nlinks&ref=1602931&pid=S0798-2259200800050000900007&lng=','','width=640,height=500,resizable=yes,scrollbars=1,menubar=yes,');">Links</a>&#160;]<!-- end-ref --><!-- ref --><p ALIGN="justify" style="word-spacing: 0; line-height: 100%"><font color="000000" face="Verdana" size="2">8. </font><FONT COLOR="000000" size="2" face="Verdana"> LATRILLE, E.; CORRIEU, G.; THIBAULT, J. Neural network models for final  process time determination in fermented milk production. <B>Comp Chem</B>. 18(11-12):  1171-1181. 1994. </FONT>&nbsp;&nbsp;&nbsp;&nbsp;&nbsp;&nbsp;&nbsp;&nbsp;[&#160;<a href="javascript:void(0);" onclick="javascript: window.open('/scielo.php?script=sci_nlinks&ref=1602932&pid=S0798-2259200800050000900008&lng=','','width=640,height=500,resizable=yes,scrollbars=1,menubar=yes,');">Links</a>&#160;]<!-- end-ref --><!-- ref --><p ALIGN="justify" style="word-spacing: 0; line-height: 100%"><font color="000000" face="Verdana" size="2">9. </font><FONT COLOR="000000" size="2" face="Verdana"> LÓPEZ DE T., G.; CANDOTTI, J. ; REVERTER, A.; BELLIDO, M.; VASCO, P.; GARCÍA,  L.; BRINKS, J. Effects of growth curve parameters on cow efficiency. <B>J  Anim Sci.</B> 70: 2668-2672. 1992.  </FONT>&nbsp;&nbsp;&nbsp;&nbsp;&nbsp;&nbsp;&nbsp;&nbsp;[&#160;<a href="javascript:void(0);" onclick="javascript: window.open('/scielo.php?script=sci_nlinks&ref=1602933&pid=S0798-2259200800050000900009&lng=','','width=640,height=500,resizable=yes,scrollbars=1,menubar=yes,');">Links</a>&#160;]<!-- end-ref --><!-- ref --><p ALIGN="justify" style="word-spacing: 0; line-height: 100%"><font color="000000" face="Verdana" size="2">10. </font><FONT COLOR="000000" size="2" face="Verdana"> McKELLAR, R.; LU, X. Primary Models. In: McKellar, R., Lu, X. (Eds.). <B>Modeling  microbial responses in foods</B>. CRC Press, Boca Raton, USA, 21-62 pp. 2004. </FONT>&nbsp;&nbsp;&nbsp;&nbsp;&nbsp;&nbsp;&nbsp;&nbsp;[&#160;<a href="javascript:void(0);" onclick="javascript: window.open('/scielo.php?script=sci_nlinks&ref=1602934&pid=S0798-2259200800050000900010&lng=','','width=640,height=500,resizable=yes,scrollbars=1,menubar=yes,');">Links</a>&#160;]<!-- end-ref --><!-- ref --><p ALIGN="justify" style="word-spacing: 0; line-height: 100%"><font color="000000" face="Verdana" size="2">11. </font><FONT COLOR="000000" size="2" face="Verdana"> MCMEEKIN, T.; OLLEY, J.; ROSS, T.; RATKOWSKY, D. Basic concepts and methods.  In: <B>Predictive Microbiology: theory and application</B>. Research Studies Press  LTD, Taunton, Englan. 11-84 pp. 1993. </FONT>&nbsp;&nbsp;&nbsp;&nbsp;&nbsp;&nbsp;&nbsp;&nbsp;[&#160;<a href="javascript:void(0);" onclick="javascript: window.open('/scielo.php?script=sci_nlinks&ref=1602935&pid=S0798-2259200800050000900011&lng=','','width=640,height=500,resizable=yes,scrollbars=1,menubar=yes,');">Links</a>&#160;]<!-- end-ref --><!-- ref --><p ALIGN="justify" style="word-spacing: 0; line-height: 100%"><font color="000000" face="Verdana" size="2">12. </font><FONT COLOR="000000" size="2" face="Verdana"> MCMEEKIN, T.; ROSS, T. Modeling applications. <B>J Food Protect</B>. 59(Suppl):  37-42. 1996. </FONT>&nbsp;&nbsp;&nbsp;&nbsp;&nbsp;&nbsp;&nbsp;&nbsp;[&#160;<a href="javascript:void(0);" onclick="javascript: window.open('/scielo.php?script=sci_nlinks&ref=1602936&pid=S0798-2259200800050000900012&lng=','','width=640,height=500,resizable=yes,scrollbars=1,menubar=yes,');">Links</a>&#160;]<!-- end-ref --><!-- ref --><p ALIGN="justify" style="word-spacing: 0; line-height: 100%"><font color="000000" face="Verdana" size="2">13. </font><FONT COLOR="000000" size="2" face="Verdana"> PANAGOU, E.; KODOGIANNIS, V.; NYCHAS, G. Modelling fungal growth using  radial basis function neural networks: The case of the ascomycetous fungus  <I>Monascus ruber</I> van Tieghem. <B>Int J Food Microbiol</B>. 117(3): 276-286. 2007. </FONT>&nbsp;&nbsp;&nbsp;&nbsp;&nbsp;&nbsp;&nbsp;&nbsp;[&#160;<a href="javascript:void(0);" onclick="javascript: window.open('/scielo.php?script=sci_nlinks&ref=1602937&pid=S0798-2259200800050000900013&lng=','','width=640,height=500,resizable=yes,scrollbars=1,menubar=yes,');">Links</a>&#160;]<!-- end-ref --><!-- ref --><p ALIGN="justify" style="word-spacing: 0; line-height: 100%"><font color="000000" face="Verdana" size="2">14. </font><FONT COLOR="000000" size="2" face="Verdana"> QUIRINO, C.; BERGMANN, J.; VALE, V.; ANDRADE, V.; PEREIRA, J. Evaluation  of four mathematical functions to describe scrotal circumference maduration  in Nellore bulls. <B>Theriogenol</B>. 52(1): 25-34. 1999. </FONT>&nbsp;&nbsp;&nbsp;&nbsp;&nbsp;&nbsp;&nbsp;&nbsp;[&#160;<a href="javascript:void(0);" onclick="javascript: window.open('/scielo.php?script=sci_nlinks&ref=1602938&pid=S0798-2259200800050000900014&lng=','','width=640,height=500,resizable=yes,scrollbars=1,menubar=yes,');">Links</a>&#160;]<!-- end-ref --><!-- ref --><p ALIGN="justify" style="word-spacing: 0; line-height: 100%"><font color="000000" face="Verdana" size="2">15. </font><FONT COLOR="000000" size="2" face="Verdana"> SCHEPERS, A.; THIBAULTB, J.; LACROIXA, C. Comparison of simple neural networks  and nonlinear regression models for descriptive modeling of <I>Lactobacillus</I>  <I>helveticus</I> growth in pH-controlled batch cultures. <B>Enz Microbiol Tech.</B>  26: 431-445. 2000.  </FONT>&nbsp;&nbsp;&nbsp;&nbsp;&nbsp;&nbsp;&nbsp;&nbsp;[&#160;<a href="javascript:void(0);" onclick="javascript: window.open('/scielo.php?script=sci_nlinks&ref=1602939&pid=S0798-2259200800050000900015&lng=','','width=640,height=500,resizable=yes,scrollbars=1,menubar=yes,');">Links</a>&#160;]<!-- end-ref --><!-- ref --><p ALIGN="justify" style="word-spacing: 0; line-height: 100%"><font color="000000" face="Verdana" size="2">16. </font><FONT COLOR="000000" size="2" face="Verdana"> SCHILLINGER, U.; GEISEN, R.; HOLZAPFEL, W.H. Potential of antagonistic  microorganisms and bacteriocins for the biological preservation of food.  <B>Trends Food Sci Tech</B>. 7: 158-164. 1997. </FONT>&nbsp;&nbsp;&nbsp;&nbsp;&nbsp;&nbsp;&nbsp;&nbsp;[&#160;<a href="javascript:void(0);" onclick="javascript: window.open('/scielo.php?script=sci_nlinks&ref=1602940&pid=S0798-2259200800050000900016&lng=','','width=640,height=500,resizable=yes,scrollbars=1,menubar=yes,');">Links</a>&#160;]<!-- end-ref --><!-- ref --><p ALIGN="justify" style="word-spacing: 0; line-height: 100%"><font color="000000" face="Verdana" size="2">17. </font><FONT COLOR="000000" size="2" face="Verdana"> SPELHAUG, S.; HARLANDER, S. Inhibition of foodborne bacterial pathogens  by bacteriocins from <I>Lactococcus lactis </I>y<I> Pedococcus pentosaceous</I>. <B>J Food  Protect</B>. 52(12): 856-862. 1989. </FONT>&nbsp;&nbsp;&nbsp;&nbsp;&nbsp;&nbsp;&nbsp;&nbsp;[&#160;<a href="javascript:void(0);" onclick="javascript: window.open('/scielo.php?script=sci_nlinks&ref=1602941&pid=S0798-2259200800050000900017&lng=','','width=640,height=500,resizable=yes,scrollbars=1,menubar=yes,');">Links</a>&#160;]<!-- end-ref --><!-- ref --><p ALIGN="justify" style="word-spacing: 0; line-height: 100%"><font color="000000" face="Verdana" size="2">18. </font><FONT COLOR="000000" size="2" face="Verdana"> STATISTICAL ANALYSIS SYSTEMS INSTITUTE (SAS). User’s guide statistic. SAS  Institute, Cary, North Carolina. 646 pp. Version 8,1. 2000. </FONT>&nbsp;&nbsp;&nbsp;&nbsp;&nbsp;&nbsp;&nbsp;&nbsp;[&#160;<a href="javascript:void(0);" onclick="javascript: window.open('/scielo.php?script=sci_nlinks&ref=1602942&pid=S0798-2259200800050000900018&lng=','','width=640,height=500,resizable=yes,scrollbars=1,menubar=yes,');">Links</a>&#160;]<!-- end-ref --><!-- ref --><p ALIGN="justify" style="word-spacing: 0; line-height: 100%"><font color="000000" face="Verdana" size="2">19. </font><FONT COLOR="000000" size="2" face="Verdana"> VALBUENA, E.; BARREIRO, J.; SÁNCHEZ, E.; CASTRO, G.; BRÍÑEZ, W.; TOVAR,  A. Modelos cinéticos aplicados al crecimiento de <I>Lactococcus lactis </I>subsp<I>.  lactis</I> en leche. <B>Rev Científ FCV-LUZ. </B>XV(5): 464-475. 2005. </FONT>&nbsp;&nbsp;&nbsp;&nbsp;&nbsp;&nbsp;&nbsp;&nbsp;[&#160;<a href="javascript:void(0);" onclick="javascript: window.open('/scielo.php?script=sci_nlinks&ref=1602943&pid=S0798-2259200800050000900019&lng=','','width=640,height=500,resizable=yes,scrollbars=1,menubar=yes,');">Links</a>&#160;]<!-- end-ref --><!-- ref --><p ALIGN="justify" style="word-spacing: 0; line-height: 100%"><font color="000000" face="Verdana" size="2">20. </font><FONT COLOR="000000" size="2" face="Verdana"> VALERO, A.; HERVÁS, C.; GARCÍA-GIMENO, R.; ZURERA, G. Product unit neural  network models for predicting the growth limits of <I>Listeria monocytogenes</I>.  <B>Food Microbiol. </B>24(5): 452-464. 2007. </FONT>&nbsp;&nbsp;&nbsp;&nbsp;&nbsp;&nbsp;&nbsp;&nbsp;[&#160;<a href="javascript:void(0);" onclick="javascript: window.open('/scielo.php?script=sci_nlinks&ref=1602944&pid=S0798-2259200800050000900020&lng=','','width=640,height=500,resizable=yes,scrollbars=1,menubar=yes,');">Links</a>&#160;]<!-- end-ref --><!-- ref --><p ALIGN="justify" style="word-spacing: 0; line-height: 100%"><font color="000000" face="Verdana" size="2">21. </font><FONT COLOR="000000" size="2" face="Verdana"> WHITING, R.; BUCHANAN, R. Microbial modeling: Scientific status summary.  <B>Food Technol.</B> 48(6): 113-120. 1994. </FONT>&nbsp;&nbsp;&nbsp;&nbsp;&nbsp;&nbsp;&nbsp;&nbsp;[&#160;<a href="javascript:void(0);" onclick="javascript: window.open('/scielo.php?script=sci_nlinks&ref=1602945&pid=S0798-2259200800050000900021&lng=','','width=640,height=500,resizable=yes,scrollbars=1,menubar=yes,');">Links</a>&#160;]<!-- end-ref --><!-- ref --><p ALIGN="justify" style="word-spacing: 0; line-height: 100%"><font color="000000" face="Verdana" size="2">22. </font><FONT COLOR="000000" size="2" face="Verdana"> ZWIETERING, M.; JONGENBURGER, I.; ROMBOUTS, F.; VAN’T RIET, K. Modeling  of the bacterial growth curve. <B>Appl Environ Microbiol</B>. 56(6): 1875-1881.  1990. </FONT>&nbsp;&nbsp;&nbsp;&nbsp;&nbsp;&nbsp;&nbsp;&nbsp;[&#160;<a href="javascript:void(0);" onclick="javascript: window.open('/scielo.php?script=sci_nlinks&ref=1602946&pid=S0798-2259200800050000900022&lng=','','width=640,height=500,resizable=yes,scrollbars=1,menubar=yes,');">Links</a>&#160;]<!-- end-ref --> ]]></body>
<back>
<ref-list>
<ref id="B1">
<label>1</label><nlm-citation citation-type="journal">
<person-group person-group-type="author">
<name>
<surname><![CDATA[BIRCH]]></surname>
<given-names><![CDATA[C]]></given-names>
</name>
</person-group>
<article-title xml:lang="en"><![CDATA[A New logistic sigmoid growth equation compared with the Richards growth equation]]></article-title>
<source><![CDATA[Ann Bot-London.]]></source>
<year>1999</year>
<volume>83</volume>
<page-range>713-723</page-range></nlm-citation>
</ref>
<ref id="B2">
<label>2</label><nlm-citation citation-type="book">
<person-group person-group-type="author">
<name>
<surname><![CDATA[CAYRE]]></surname>
<given-names><![CDATA[M]]></given-names>
</name>
<name>
<surname><![CDATA[VIGNOLO]]></surname>
<given-names><![CDATA[G]]></given-names>
</name>
<name>
<surname><![CDATA[GARRO]]></surname>
<given-names><![CDATA[O]]></given-names>
</name>
</person-group>
<source><![CDATA[Validación y comparación de modelos de crecimiento microbiano]]></source>
<year>2001</year>
<page-range>4</page-range><publisher-name><![CDATA[Universidad Nacional Del Nordeste, Comunicaciones Científicas y Tecnológicas]]></publisher-name>
</nlm-citation>
</ref>
<ref id="B3">
<label>3</label><nlm-citation citation-type="">
<collab>COMISIÓN VENEZOLANA DE NORMAS INDUSTRIALES</collab>
<source><![CDATA[Leche fluida: Determinación de acidez titulable. 3ª Rev. No 658-1997]]></source>
<year>1997</year>
<page-range>5</page-range></nlm-citation>
</ref>
<ref id="B4">
<label>4</label><nlm-citation citation-type="">
<collab>COMISIÓN VENEZOLANA DE NORMAS INDUSTRIALES</collab>
<source><![CDATA[Alimentos: Método para recuento de colonias de bacterias aerobias en placas de Petri. No 902-87]]></source>
<year>1987</year>
<page-range>6</page-range></nlm-citation>
</ref>
<ref id="B5">
<label>5</label><nlm-citation citation-type="journal">
<person-group person-group-type="author">
<name>
<surname><![CDATA[GARCÍA]]></surname>
<given-names><![CDATA[R.]]></given-names>
</name>
<name>
<surname><![CDATA[HERVÁS]]></surname>
<given-names><![CDATA[C.]]></given-names>
</name>
<name>
<surname><![CDATA[RODRÍGUEZ]]></surname>
<given-names><![CDATA[R.]]></given-names>
</name>
<name>
<surname><![CDATA[ZURERA]]></surname>
<given-names><![CDATA[G]]></given-names>
</name>
</person-group>
<article-title xml:lang="en"><![CDATA[Modelling the growth of Leuconostoc mesenteroides by artificial neural networks]]></article-title>
<source><![CDATA[Int J Food Microbiol.]]></source>
<year>2005</year>
<volume>105</volume>
<numero>3</numero>
<issue>3</issue>
<page-range>317-332</page-range></nlm-citation>
</ref>
<ref id="B6">
<label>6</label><nlm-citation citation-type="journal">
<person-group person-group-type="author">
<name>
<surname><![CDATA[GEERAERD]]></surname>
<given-names><![CDATA[A.]]></given-names>
</name>
<name>
<surname><![CDATA[HERREMANS]]></surname>
<given-names><![CDATA[C.]]></given-names>
</name>
<name>
<surname><![CDATA[HERREMANS]]></surname>
<given-names><![CDATA[M.]]></given-names>
</name>
<name>
<surname><![CDATA[CENES]]></surname>
<given-names><![CDATA[C.]]></given-names>
</name>
<name>
<surname><![CDATA[VAN IMPE]]></surname>
<given-names><![CDATA[J]]></given-names>
</name>
</person-group>
<article-title xml:lang="en"><![CDATA[Application of artificial previous neural networks as a non linear technique to describe bacterial growth in chilled food products]]></article-title>
<source><![CDATA[Int J Food Microbiol.]]></source>
<year>1998</year>
<volume>44</volume>
<page-range>49-68</page-range></nlm-citation>
</ref>
<ref id="B7">
<label>7</label><nlm-citation citation-type="journal">
<person-group person-group-type="author">
<name>
<surname><![CDATA[HAJMEER]]></surname>
<given-names><![CDATA[M.]]></given-names>
</name>
<name>
<surname><![CDATA[BASHEER]]></surname>
<given-names><![CDATA[I]]></given-names>
</name>
</person-group>
<article-title xml:lang="en"><![CDATA[Comparison of logistic regression and neural network-based classifiers for bacterial growth]]></article-title>
<source><![CDATA[Food Microbiol.]]></source>
<year>2003</year>
<volume>20</volume>
<numero>1</numero>
<issue>1</issue>
<page-range>43-55</page-range></nlm-citation>
</ref>
<ref id="B8">
<label>8</label><nlm-citation citation-type="journal">
<person-group person-group-type="author">
<name>
<surname><![CDATA[LATRILLE]]></surname>
<given-names><![CDATA[E.]]></given-names>
</name>
<name>
<surname><![CDATA[CORRIEU]]></surname>
<given-names><![CDATA[G.]]></given-names>
</name>
<name>
<surname><![CDATA[THIBAULT]]></surname>
<given-names><![CDATA[J]]></given-names>
</name>
</person-group>
<article-title xml:lang="en"><![CDATA[Neural network models for final process time determination in fermented milk production]]></article-title>
<source><![CDATA[Comp Chem.]]></source>
<year>1994</year>
<volume>18</volume>
<numero>11-12</numero>
<issue>11-12</issue>
<page-range>1171-1181</page-range></nlm-citation>
</ref>
<ref id="B9">
<label>9</label><nlm-citation citation-type="journal">
<person-group person-group-type="author">
<name>
<surname><![CDATA[LÓPEZ DE T.]]></surname>
<given-names><![CDATA[G.]]></given-names>
</name>
<name>
<surname><![CDATA[CANDOTTI]]></surname>
<given-names><![CDATA[J.]]></given-names>
</name>
<name>
<surname><![CDATA[REVERTER]]></surname>
<given-names><![CDATA[A.]]></given-names>
</name>
<name>
<surname><![CDATA[BELLIDO]]></surname>
<given-names><![CDATA[M.]]></given-names>
</name>
<name>
<surname><![CDATA[VASCO]]></surname>
<given-names><![CDATA[P.]]></given-names>
</name>
<name>
<surname><![CDATA[GARCÍA]]></surname>
<given-names><![CDATA[L.]]></given-names>
</name>
<name>
<surname><![CDATA[BRINKS]]></surname>
<given-names><![CDATA[J]]></given-names>
</name>
</person-group>
<article-title xml:lang="en"><![CDATA[Effects of growth curve parameters on cow efficiency]]></article-title>
<source><![CDATA[J Anim Sci.]]></source>
<year>1992</year>
<volume>70</volume>
<page-range>2668-2672</page-range></nlm-citation>
</ref>
<ref id="B10">
<label>10</label><nlm-citation citation-type="book">
<person-group person-group-type="author">
<name>
<surname><![CDATA[McKELLAR]]></surname>
<given-names><![CDATA[R]]></given-names>
</name>
<name>
<surname><![CDATA[LU]]></surname>
<given-names><![CDATA[X]]></given-names>
</name>
</person-group>
<article-title xml:lang="en"><![CDATA[Primary Models]]></article-title>
<person-group person-group-type="editor">
<name>
<surname><![CDATA[McKellar]]></surname>
<given-names><![CDATA[R]]></given-names>
</name>
<name>
<surname><![CDATA[Lu]]></surname>
<given-names><![CDATA[X]]></given-names>
</name>
</person-group>
<source><![CDATA[Modeling microbial responses in foods]]></source>
<year>2004</year>
<page-range>21-62</page-range><publisher-loc><![CDATA[Boca Raton ]]></publisher-loc>
<publisher-name><![CDATA[CRC Press]]></publisher-name>
</nlm-citation>
</ref>
<ref id="B11">
<label>11</label><nlm-citation citation-type="book">
<person-group person-group-type="author">
<name>
<surname><![CDATA[MCMEEKIN]]></surname>
<given-names><![CDATA[T]]></given-names>
</name>
<name>
<surname><![CDATA[OLLEY]]></surname>
<given-names><![CDATA[J]]></given-names>
</name>
<name>
<surname><![CDATA[ROSS]]></surname>
<given-names><![CDATA[T]]></given-names>
</name>
<name>
<surname><![CDATA[RATKOWSKY]]></surname>
<given-names><![CDATA[D]]></given-names>
</name>
</person-group>
<article-title xml:lang="en"><![CDATA[Basic concepts and methods]]></article-title>
<source><![CDATA[Predictive Microbiology: theory and application]]></source>
<year>1993</year>
<page-range>11-84</page-range><publisher-loc><![CDATA[Taunton ]]></publisher-loc>
<publisher-name><![CDATA[Research Studies Press LTD]]></publisher-name>
</nlm-citation>
</ref>
<ref id="B12">
<label>12</label><nlm-citation citation-type="journal">
<person-group person-group-type="author">
<name>
<surname><![CDATA[MCMEEKIN]]></surname>
<given-names><![CDATA[T.]]></given-names>
</name>
<name>
<surname><![CDATA[ROSS]]></surname>
<given-names><![CDATA[T]]></given-names>
</name>
</person-group>
<article-title xml:lang="en"><![CDATA[Modeling applications]]></article-title>
<source><![CDATA[J Food Protect.]]></source>
<year>1996</year>
<numero>^s59</numero>
<issue>^s59</issue>
<supplement>59</supplement>
<page-range>37-42</page-range></nlm-citation>
</ref>
<ref id="B13">
<label>13</label><nlm-citation citation-type="journal">
<person-group person-group-type="author">
<name>
<surname><![CDATA[PANAGOU]]></surname>
<given-names><![CDATA[E.]]></given-names>
</name>
<name>
<surname><![CDATA[KODOGIANNIS]]></surname>
<given-names><![CDATA[V.]]></given-names>
</name>
<name>
<surname><![CDATA[NYCHAS]]></surname>
<given-names><![CDATA[G]]></given-names>
</name>
</person-group>
<article-title xml:lang="en"><![CDATA[Modelling fungal growth using radial basis function neural networks: The case of the ascomycetous fungus Monascus ruber van Tieghem]]></article-title>
<source><![CDATA[Int J Food Microbiol.]]></source>
<year>2007</year>
<volume>117</volume>
<numero>3</numero>
<issue>3</issue>
<page-range>276-286</page-range></nlm-citation>
</ref>
<ref id="B14">
<label>14</label><nlm-citation citation-type="journal">
<person-group person-group-type="author">
<name>
<surname><![CDATA[QUIRINO]]></surname>
<given-names><![CDATA[C.]]></given-names>
</name>
<name>
<surname><![CDATA[BERGMANN]]></surname>
<given-names><![CDATA[J.]]></given-names>
</name>
<name>
<surname><![CDATA[VALE]]></surname>
<given-names><![CDATA[V.]]></given-names>
</name>
<name>
<surname><![CDATA[ANDRADE]]></surname>
<given-names><![CDATA[V.]]></given-names>
</name>
<name>
<surname><![CDATA[PEREIRA]]></surname>
<given-names><![CDATA[J]]></given-names>
</name>
</person-group>
<article-title xml:lang="en"><![CDATA[Evaluation of four mathematical functions to describe scrotal circumference maduration in Nellore bulls]]></article-title>
<source><![CDATA[Theriogenol.]]></source>
<year>1999</year>
<volume>52</volume>
<numero>1</numero>
<issue>1</issue>
<page-range>25-34</page-range></nlm-citation>
</ref>
<ref id="B15">
<label>15</label><nlm-citation citation-type="journal">
<person-group person-group-type="author">
<name>
<surname><![CDATA[SCHEPERS]]></surname>
<given-names><![CDATA[A.]]></given-names>
</name>
<name>
<surname><![CDATA[THIBAULTB]]></surname>
<given-names><![CDATA[J.]]></given-names>
</name>
<name>
<surname><![CDATA[LACROIXA]]></surname>
<given-names><![CDATA[C]]></given-names>
</name>
</person-group>
<article-title xml:lang="en"><![CDATA[Comparison of simple neural networks and nonlinear regression models for descriptive modeling of Lactobacillus helveticus growth in pH-controlled batch cultures]]></article-title>
<source><![CDATA[Enz Microbiol Tech.]]></source>
<year>2000</year>
<volume>26</volume>
<page-range>431-445</page-range></nlm-citation>
</ref>
<ref id="B16">
<label>16</label><nlm-citation citation-type="journal">
<person-group person-group-type="author">
<name>
<surname><![CDATA[SCHILLINGER]]></surname>
<given-names><![CDATA[U.]]></given-names>
</name>
<name>
<surname><![CDATA[GEISEN]]></surname>
<given-names><![CDATA[R.]]></given-names>
</name>
<name>
<surname><![CDATA[HOLZAPFEL]]></surname>
<given-names><![CDATA[W.H]]></given-names>
</name>
</person-group>
<article-title xml:lang="en"><![CDATA[Potential of antagonistic microorganisms and bacteriocins for the biological preservation of food]]></article-title>
<source><![CDATA[Trends Food Sci Tech.]]></source>
<year>1997</year>
<volume>7</volume>
<page-range>158-164</page-range></nlm-citation>
</ref>
<ref id="B17">
<label>17</label><nlm-citation citation-type="journal">
<person-group person-group-type="author">
<name>
<surname><![CDATA[SPELHAUG]]></surname>
<given-names><![CDATA[S.]]></given-names>
</name>
<name>
<surname><![CDATA[HARLANDER]]></surname>
<given-names><![CDATA[S]]></given-names>
</name>
</person-group>
<article-title xml:lang="en"><![CDATA[Inhibition of foodborne bacterial pathogens by bacteriocins from Lactococcus lactis y Pedococcus pentosaceous]]></article-title>
<source><![CDATA[J Food Protect.]]></source>
<year>1989</year>
<volume>52</volume>
<numero>12</numero>
<issue>12</issue>
<page-range>856-862</page-range></nlm-citation>
</ref>
<ref id="B18">
<label>18</label><nlm-citation citation-type="book">
<collab>STATISTICAL ANALYSIS SYSTEMS INSTITUTE</collab>
<source><![CDATA[User’s guide statistic]]></source>
<year>2000</year>
<page-range>646</page-range><publisher-loc><![CDATA[North Carolina ]]></publisher-loc>
<publisher-name><![CDATA[SAS Institute, Cary]]></publisher-name>
</nlm-citation>
</ref>
<ref id="B19">
<label>19</label><nlm-citation citation-type="journal">
<person-group person-group-type="author">
<name>
<surname><![CDATA[VALBUENA]]></surname>
<given-names><![CDATA[E.]]></given-names>
</name>
<name>
<surname><![CDATA[BARREIRO]]></surname>
<given-names><![CDATA[J.]]></given-names>
</name>
<name>
<surname><![CDATA[SÁNCHEZ]]></surname>
<given-names><![CDATA[E.]]></given-names>
</name>
<name>
<surname><![CDATA[CASTRO]]></surname>
<given-names><![CDATA[G.]]></given-names>
</name>
<name>
<surname><![CDATA[BRÍÑEZ]]></surname>
<given-names><![CDATA[W.]]></given-names>
</name>
<name>
<surname><![CDATA[TOVAR]]></surname>
<given-names><![CDATA[A]]></given-names>
</name>
</person-group>
<article-title xml:lang="es"><![CDATA[Modelos cinéticos aplicados al crecimiento de Lactococcus lactis subsp]]></article-title>
<source><![CDATA[lactis en leche. Rev Científ FCV-LUZ.]]></source>
<year>2005</year>
<volume>XV</volume>
<numero>5</numero>
<issue>5</issue>
<page-range>464-475</page-range></nlm-citation>
</ref>
<ref id="B20">
<label>20</label><nlm-citation citation-type="journal">
<person-group person-group-type="author">
<name>
<surname><![CDATA[VALERO]]></surname>
<given-names><![CDATA[A.]]></given-names>
</name>
<name>
<surname><![CDATA[HERVÁS]]></surname>
<given-names><![CDATA[C.]]></given-names>
</name>
<name>
<surname><![CDATA[GARCÍA-GIMENO]]></surname>
<given-names><![CDATA[R.]]></given-names>
</name>
<name>
<surname><![CDATA[ZURERA]]></surname>
<given-names><![CDATA[G]]></given-names>
</name>
</person-group>
<article-title xml:lang="en"><![CDATA[Product unit neural network models for predicting the growth limits of Listeria monocytogenes]]></article-title>
<source><![CDATA[Food Microbiol.]]></source>
<year>2007</year>
<volume>24</volume>
<numero>5</numero>
<issue>5</issue>
<page-range>452-464</page-range></nlm-citation>
</ref>
<ref id="B21">
<label>21</label><nlm-citation citation-type="journal">
<person-group person-group-type="author">
<name>
<surname><![CDATA[WHITING]]></surname>
<given-names><![CDATA[R.]]></given-names>
</name>
<name>
<surname><![CDATA[BUCHANAN]]></surname>
<given-names><![CDATA[R]]></given-names>
</name>
</person-group>
<article-title xml:lang="en"><![CDATA[Microbial modeling: Scientific status summary]]></article-title>
<source><![CDATA[Food Technol.]]></source>
<year>1994</year>
<volume>48</volume>
<numero>6</numero>
<issue>6</issue>
<page-range>113-120</page-range></nlm-citation>
</ref>
<ref id="B22">
<label>22</label><nlm-citation citation-type="journal">
<person-group person-group-type="author">
<name>
<surname><![CDATA[ZWIETERING]]></surname>
<given-names><![CDATA[M.]]></given-names>
</name>
<name>
<surname><![CDATA[JONGENBURGER]]></surname>
<given-names><![CDATA[I.]]></given-names>
</name>
<name>
<surname><![CDATA[ROMBOUTS]]></surname>
<given-names><![CDATA[F.]]></given-names>
</name>
<name>
<surname><![CDATA[VAN’T RIET]]></surname>
<given-names><![CDATA[K]]></given-names>
</name>
</person-group>
<article-title xml:lang="en"><![CDATA[Modeling of the bacterial growth curve]]></article-title>
<source><![CDATA[Appl Environ Microbiol.]]></source>
<year>1990</year>
<volume>56</volume>
<numero>6</numero>
<issue>6</issue>
<page-range>1875-1881</page-range></nlm-citation>
</ref>
</ref-list>
</back>
</article>