


Servicios Personalizados
Revista
Articulo
 Articulo en XML
 Referencias del artículo
 Enviar articulo por email
Indicadores
-
 Citado por SciELO
 -
 Accesos
Links relacionados
-
 Similares en
SciELO
Similares en
SciELO
Compartir

 Permalink
Revista Latinoamericana de Metalurgia y Materiales
versión impresa ISSN 0255-6952
Rev. LatinAm. Metal. Mater. v.29 n.1 Caracas ene. 2009
Deformation behavior of molybdenum single crystals as obtained from quasirelaxation in situ experiments in a high voltage tem.
Pedro Tamayo Meza1*, Pablo Schabes-Retchkiman2*, Viacheslav Yermishkin3
1 Instituto Politécnico Nacional, Sección de Estudios de Posgrado e Investigación, Escuela Superior de Ingeniería Mecánica y Eléctrica-UA. Av. Granjas, N°682, Colonia Santa Catarina. Del. Azcapotzalco, CP.02550, México, DF.
2 Departamento de. Materia Condensada, Instituto de Física, Universidad Nacional Autónoma de México, Apartado Postal 20-364, México, DF. 01000.
3 Institute of Metallurgy Baikov, Russian Academy of Sciences. Lenninsky Prozpekt 49, Russian Federation, Moscow. *E-mail: ptamayom@ipn.mx, schabes@fisica.unam.mx
Disponible en: www.polimeros.labb.usb.ve/RLMM/home.html
Abstract
A novel methodology for material characterization at the quasi-relaxation regime is presented. The dislocation dynamics on Mo single crystals was studied using experimental relaxation data for two stages of its development. The thermoactivated parameters of dislocation motion in single crystals are fundamental to identify the elementary mechanisms that control dislocation slipping under quasi-relaxation conditions. However, the thermo activated analysis to study the dislocation evolution, is not enough to absolutely identify the process itself. Hence, other methods are required. Thick specimens were tested by in situ HVTEM (High Voltage Transmission Electron Microscopy). As a starting point of non-elastic behavior in the metal, the yield point limit was considered, and modeling in quasirelaxation conditions was developed. Finally, the obtained data and analysis allowed us to reveal that the quasi-relaxation method is a powerful resource to obtain important information about the evolution of dislocations in metals.
Keywords: Single crystal, In situ HVTEM, Quasi-relaxation method, Dislocations, Stress relaxation, Dislocation density.
Resumen
Se presenta una novedosa metodología para caracterizar materiales en régimen de cuasi-relajación. Usando los datos experimentales de cuasi-relajación se estudia la dinámica de las dislocaciones en monocristales de Mo para dos etapas de este desarrollo. Los parámetros termo-activados del movimiento de dislocaciones en monocristales son fundamentales para identificar los mecanismos elementales que controlan su deslizamiento bajo condiciones de cuasi-relajación. Sin embargo, el análisis termo activado para el estudio de la evolución de las dislocaciones no es suficiente para identificar el proceso en si. Muestras gruesas fueron ensayadas in situ en el Microscopio Electrónico de Transmisión de Alto Voltaje (HVTEM). Se consideró el límite de fluencia como punto de partida para el estudio del inicio del comportamiento no elástico en el metal. Finalmente, la información obtenida permitió demostrar que el método de cuasi-relajación es un recurso muy poderoso para obtener información importante acerca de la evolución de las dislocaciones en los metales.
Palabras Claves: Monocristales, In situ HVTEM, Método de cuasi relajación, Dislocaciones, Relajación de esfuerzo, Densidad de dislocaciones.
Recibido: 30-Ene-2008; Revisado: 09-Feb-2009; Aceptado: 21-Feb-2009 Publicado On-Line: 29-Jun-2009
1. INTRODUCTION
Since the 1930s there was knowledge of the very important role played by the dislocations produced during plastic deformation on the mechanical properties of metals. However, the studies for establishing the physical characteristics observed in the deformation curve had serious deficiencies. The mechanical characteristics, such as yield limit, deformation resistance, and the fracture limit, were correlated to the dislocational structure, which up to that time was studied by electron microscopy under static conditions [1]. In situ HVTEM (High Voltage Transmission Electron Microscopy) widened the possibilities in the study of the evolutionary processes inside the metal. In the present work the mechanical characteristics in micro-specimens and the structural rearrangement mechanisms are analyzed in dislocational systems under stress, characteristic of transition metals with BCC structure [2].
2. EXPERIMENTAL PART
The Mo single crystals were obtained by electronbeam plasma deposition in vacuum of at least 10-6 Torr. The impurity content of the single crystals was determined through mass spectrometry with a detection limit of between 10-6 ÷ 10-8 % in mass, and corresponded to: C – 0.028; O – 0.02; N – 0.006; H – 0.002; Mg – 0.001; Si – 0.003; Ni – 0.001; Al – 0.001; Fe – 0.003; W – 0.1, % in weight. According to Han et al. [3] the impurity content measured implies a monophasic system; a small percentage of inclusions of Mo2C, oxides of Mg, Ca, Si, Al and nitrides is also present [4].
Molybdenum single crystal micro-specimens with [100] (011) and [100] (001) orientations, were tension tested inside the HVTEM with ultimate tension strength equivalent to the dislocation segment tension between 0.1–4.8 kg/mm2, i.e., close to σμ, the micro-yield limit, as determined from the quasi-relaxation tests [5]. Hence, the micro-yield limit is the stress level that induces dislocation movement.
The structural symmetry was analyzed by X-ray analysis and HVTEM. The Laue diagram analysis of the reflecting surfaces type {112} and {310} allowed the sub-grain evaluation in the radial and azymuthal (Bragg and anti-Bragg), directions respectively.
Planar single-crystalline specimens were tested with an area of (0.7 to 1) x 3 mm2, and 20 mm length. The specimens were tested under quasi-relaxation regime in an INSTRON, series 4500 machine, with a registry precision of 0.5%, and a deformation velocity up to quasi-relaxation regime of 4 x 10⁻⁴ sec-1. The results of the INSTRON were plotted in log (σ) vs. t coordinates.
3. RESULTS AND DISCUSSION
The relationship between the mechanical characteristics and the final structure parameters in a metal is well known, in particular the functional correlation between deformation vs. dislocation density ρ, which can be expressed by:
t = a G b ρ0.5 (1)
where ρ is the dislocation density, a is the dislocation multiplicative coefficient, dependent on a number of physical conditions, G is the metals shear modulus, and b is the Burgers vector.
In particular equation (1) was obtained by several investigators, to determine the yield point strain in crystalline materials based on different models derived from the analysis of the sliding dislocations interactions with barriers of varying nature, that come on the way of free movement of the dislocations during the transition from elastic to plastic deformation. The physical meaning of the other parameters in the equation, depends strongly on the particular mechanisms considered as a model to explain the interaction of the dislocations with the barriers during the plastic deformation process; in some cases ρ refers to dislocation density at the walls of the crystalline structure; in a second it refers to the density of a dislocation forest and in another case as generalized slipping dislocation density.
In Table 1, the most important parameters for this interactions and their physical meaning are shown; their understanding allows a better grasp of this problem.
In equation (1), or its analogue:
t = to + a Gb ρ0.5 (2)
Table 1. Physical meaning of the parameters in equation (1), and model of dislocation interaction with barriers.
| a in equation (1) | Meaning of ρ | Interaction mechanism of dislocation | Author of proposed model |
| |
Dislocation density in the limits of crystalline lattice | The sliding dislocations surpass the resistance generated by the dislocations that generate periodic networks of dislocations | Taylor [1] |
| |
Density of sliding dislocations | The sliding dislocations surpass the effect of containment of the barriers generated on them as a result of the intersection with the dislocation nucleus. | Hirsh, Mott [2] |
| for n = 25, a = 0.795 | Concentration and dislocation density, n is the number of dislocations in planar concentration | The sliding dislocations overcome the long range stresses arising from the planar concentration of dislocations | Zeeger [3,4] |
| |
Density of the dislocation forest | Deflection of the sliding dislocations in the dislocation forest. | Kulman - Wilsdorf [5] |
| |
Density of the dislocation forest | Resistance to the sliding dislocations from the intersection of the dislocation forest forming steps | Bazinsky [1] |
| |
Total dislocation density | Overcoming the mutual attractive forces of the dislocations for a relative displacement | Gale B [6] |
we can introduce the experimental results obtained from the study of t vs. ρ0.5 for a series of materials. Table 2 shows some of the theoretical and experimental results related to stress and dislocation density analysis, and the main difference observed is only on the value of the a coefficient [6-8].
Table 2. a from theoretical and experimental results [7,8]
| Metals | T (K) | Values of a in equation (2) | |
| Single crystals | Policrystals | ||
| Cu | 4.2, 293 | 0, 38; 0.38, 0.21 | 0.5 |
| Ag | 293 | - | 0.58 |
| Fe | 138-198 300 373-473 | 0.5-0.6 0.30 - | 0.7-0.8 0.70, 0.50, 0.38 0.80 |
| Mo | 77 195-200 300-373 | 1.42 0.84, 0.35 0.49, 0.25 | - 0.36 - |
| Nb | 138-198 293 300-523 | 0.375 - 0.125 | - 0.42, 0.47, 0.425, 0.440, |
| V | 230 293 300 673 | - - - - | 0.36 0.43 0.27 0.21
|
| Ta | 373 | 0.3 | - |
Nevertheless the analysis of t = f ( ρ0.5), from mechanical tests followed by HVTEM reveal a significant contradiction in the physical treatment. In particular extrapolation of this function to a square root type of initial dislocation density, in many occasions leads to negative values of to [8,9], that has no physical meaning whatsoever. For instance, when Nb single crystals are deformed, an increase in the resistance to deformation has been observed; at the same time, for to, determined from the function t = f ( ρ0.5), these values are reduced [9].
In a similar way, this lack of correlation was detected for cyclic tests results [10], where the yield stress indirectly determined from the stress-strain deformation diagram yielded smaller values in comparison with static tests, where extrapolation of the t = f ( ρ0.5) leads to opposing conclusions. According to Nabarro et al. [11] equation (1) can be obtained from magnitude analysis.
The objective of this work was oriented to demonstrate that the t = f ( ρ0.5), functionality can be obtained not only from formal considerations of the magnitude theory, neither from particular models of the interrelation of the sliding dislocations with barriers of different nature, but based on general physical laws on energy conservation, presenting results of a series of analysis obtained from quasi-relaxation tests performed in situ on Mo single crystals inside the HVTEM.
Equation (1) can be obtained from simple energy considerations and it describes the transformation of an initial dislocation structure to one of a specimen under load, that is reversible related to the original structure when the load is applied rapidly, but it can evolve slowly in an irreversible manner under quasi-relaxation conditions.
Studies of thin sections of micro specimens in tension of single crystals of Mo, W and other single crystals with an analogous crystalline geometry to the ones presented in this work (but here tested in the quasi-relaxation regimen in situ in the HVTEM Jeol 1000, starting from thicker specimens,) demonstrated that the initial physical explanation of the elastic energy accumulation process during load application requires a correction for thick (real) specimens.
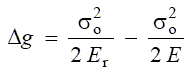
The micro-specimen deformation measured by the emergence of dislocations at the specimens surface demonstrated that only part of the plastic deformation is related to the reversible movement of the dislocations for an applied stress below the yield limit. The other one is, however related to the fact that when a load is applied and the specimen deformed, the interatomic distance expands or increases. It is not difficult to demonstrate that the presence of a dislocational elastic component in the deformation, reflects itself on the magnitude of the elastic relaxation modulus of the specimen more intensely the higher the relationship between the dislocational and atomic component of the deformation, and it can be expressed as:
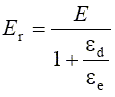 (3)
(3)
where E is the Youngs modulus of the metal, Er is the Relaxed Youngs Modulus of the metal, and ed is the dislocation deformation; ee atomic (lattice) deformation; this is shown schematically in Figure 1.
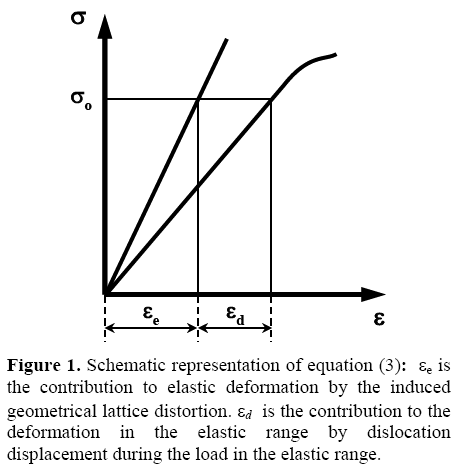
From Figure 1, it can be inferred that:
ee - s = E ee = Er (er + ed) (4)
and,
E = Er (er + ed) / ee, (5)
after division by ee.
When the crystal is deformed elastically, the dislocations are elastically deformed too, meaning they stretch out, increasing their Burgers vector. As a consequence the elastic modulus changes, and this fact has to be taken into account when we determine the relaxation modulus. Notwithstanding, this is not large as compared to the contribution from, or attributable to, the whole load loop of the testing machine.
Considering that the scheme proposed here is incompatible with the traditional method, and ultimately it is based on experimental methods that allow the direct determination of some physical parameters, that characterize the dislocational structure, we modernized the methods according to the fundamental proposals of our scheme.
The equation that describes the dynamical dislocation kinetics under quasi-relaxation conditions is very complex and can be expressed by [12-14]:
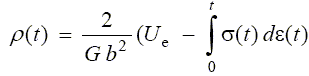 (6)
(6)
where Ue is the initial elastic energy in the loaded specimen up to a maximum stress so.
The analysis of the quasi-relaxation experiments on Mo were the initial point for the study of the evolution of the elementary thermally activated processes of the dislocational structures.
We only evaluated the influence of the proposed correction for the case of an initial dislocation density in the specimen up to the moment when the machine is stopped, (which corresponds to the point when the stress micro-stage inside the microscope is stopped, for instance at 0.6 the yield stress) which considers the two components of the elastic deformation.
The method developed here by us to analyze the quasirelaxation process is characterized by its richness in data; the whole series of experiments were done using a single specimen that was tested at different initial stress levels. That allowed us to obtain enormous quantities of information about the dynamics of dislocations in the tested specimens, about the length of their displacement, information about the trajectory of this displacements, information about the elementary thermo activated processes, of the evolution of the dislocational system, about some specific mechanical properties related to the inelastic behavior of the metal (micro yield limit and proportionality). Some of the possibilities that these methods allow are applied here for Molybdenum.
If we assume that all the energy concentrated inside the specimen in the elastic range, is accumulated in terms of the energy of the dislocations` elastic fields then:
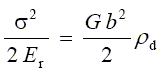 (7)
(7)
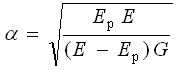
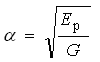
where ρd is the dynamic dislocation density. An expression can be worked out that allows the determination of the initial dislocation density in the specimen before application of the load on the simple. When the specimen is loaded inside the elastic range, then it is assumed that the specimen already had dislocations. If we put a = (Er / G) 0.5, then equation (7) can be expressed as equation (1), considering t = σ/2 .
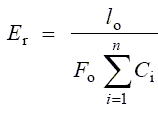
In Table 3, the values for a series of metals of the a coefficient are shown determined for specimens with 5 mm diameter and 50 mm length, for a loop of S = 2.6 × 10⁻⁴ cm/kg, according to:
 (8)
(8)
Table 3. α determined experimentally for several metals.
| Metal | α in equation (1) | Metal | α in equation (1) |
| W | 0.116 | Cu | 0.202 |
| Mo | 0.130 | Al | 0.254 |
| Nb | 0.188 | Ti | 0.221 |
| Fe | 0.146 | Ni | 0.156 |
where lo is the initial length of the specimens work zone, Fo is initial area of the work zone, and Ci is the elastic behavior of the force elements of the test machine (grips, grip lengthening, the column, etc).
In effect, the accumulated free energy of the dislocations is e qual to the difference between the elastic energies of the whole loading system and the elastic energy of the specimen, released during discharge, hence:
 (9)
(9)
∆g is the Gibbs free energy of the specimen under tension.
It is important to stress that the coincidence between the data in Tables 1 and 3, is much better than the data in Tables 1 and 2. A more in depth analysis of the problem can be found in Ref. 13 (see Ivanova and Ermishkin, p. 80).
3.1 Energy Considerations of the Problem
For this case the increase in the free energy of the specimen as a result the accumulation of a high density of dynamic dislocations can be expressed by:
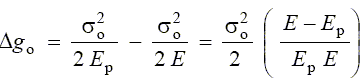 (10)
(10)
 (11)
(11)
Equation (11) implies
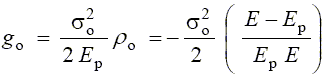
so = a G b ro 0.5 (12)
 (13)
(13)
Equation (12), without consideration of the elastic deformation of the dislocations, can be written as:
 (14)
(14)
Table 4 presents data that shows how the elastic deformation of dislocations influences the density of the dynamic dislocations for well established initial boundary conditions and values of the stress so in a Mo single crystal [110]<100> at T = 293 K.
Table 4. Influence of the elastic deformation of the dislocations on the dynamical dislocation density and the a coefficient.
| so (MPa) | Ep (MPa) | a |
| r/10 (cm-2) | ||
| |
|
| ro1 | ro2 | ||
| 225 | 2492 | 0.143 | 0.143 |
| 2.25 | 2.25 |
| 180 | 2556 | 0.145 | 0.145 |
| 1.40 | 1.40 |
| 135 | 2794 | 0.151 | 0.152 |
| 7.26 | 7.16 |
| 90 | 3270 | 0.164 | 0.165 |
| 2.73 | 2.70 |
| 45 | 4444 | 0.191 | 0.192 |
| 5.64 | 4.99 |
From Table 4 we realize that to consider the influence of the elastic deformation of the dislocations on the magnitude of the a coefficient and the density of the dynamic dislocations for pre-established conditions of the initial stress, does not influence strongly the value and can be discarded for all practical purposes. For that reason, the initial arguments presented in [12,15], are undoubtedly attained from the qualitative and quantitative points of view, as much as regards the evolutional image of the dislocational structure during quasirelaxation as well as their evaluation characteristics respectively.
Figure 2 shows quasirelaxation curves obtained for different initial stress so at T = 293 K. In these curves two stages are clearly defined: The first stage lasts up to 50 seconds and the second stage manifests itself during 50 to 700 seconds of the start of the test.
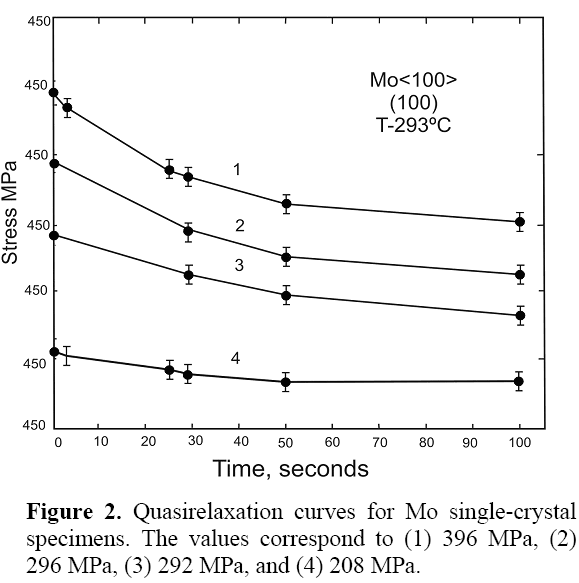
In previous work [13,15] we have demonstrated that the whole quasi-relaxation curve can be analytically described by the superposition of two functions a hyperbolic and an exponential function of the kind:
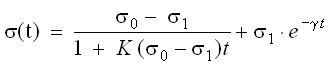 (15)
(15)
where so, s1, K, and g are approximation parameters.
Beyond 30-120 seconds of the test (within the margin of error) the experimental curve corresponds to an exponential behavior. The statistical verification of the hypothesis on the possibility of representing analytically the relaxation experimental curves, given in equation (12) and the exponent using the Peerson criteria, allow us to sustain this method.
The single crystal substructure with growth axis <100> contains first order sub-grains with illed defined columns de 1 a 2 mm in length and 0.1-0.5 mm in transversal direction, and also second order equiaxial sub-grains with sizes between 0.05-0.5 mm. The miss orientation between the subgrains of first order is bellow tenths of a degree, and between subgrains of the second order less than 0.15 of a degree (Figure 3).
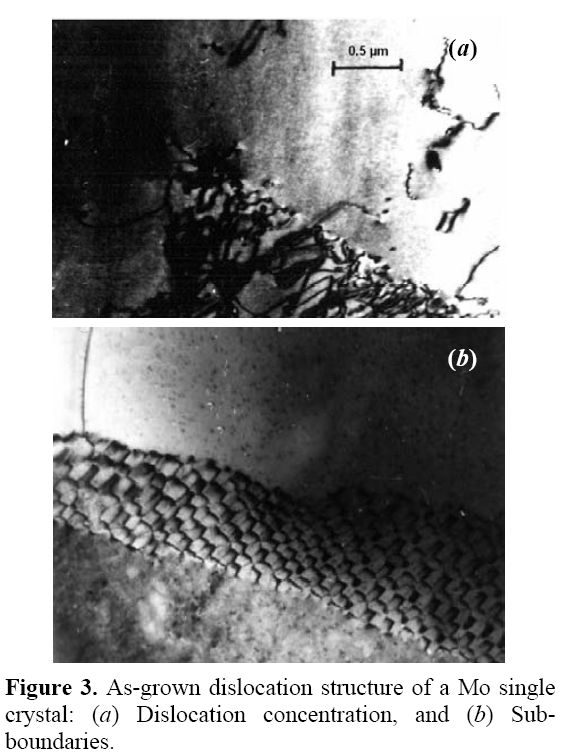
The observed structure shows different dislocation segments, stretched out in the <111> direction, dislocation concentration and small angle dislocation edges. The average dislocation density r, oscillates between 106-107 cm-2.
Mo, W, Fe, FeSi, Va and Zn single crystal micro-specimens and alloys of W+Re and Ta in-situ tested in the HVETM column, have demonstrated that the edge dislocations start moving at very low stress values, several times lower than the proportionality limit determined by the tests done in macroscopic specimens in universal testing machines. This circumstance coincides with the macroscopic experimental data about the study of dislocation mobility at room temperature using the method of selective corrosion under load, according to the three point bending method. Dislocation movement was observed at a value of s = 0.40 kg/mm2 for a Mo [17], and s = 0.56 kg/mm2 for W [18].
In the present experiments, in [100] ![]() and [100] (001), single crystal Mo shows that the ultimate tensile stress, determined approximately from the dislocation segment tension [6], has a value between 0.1–4.8 kg/mm2, i.e., very close to the micro-yield limit values sm, determined from quasi-relaxation experiments and hysteresis mechanisms.
and [100] (001), single crystal Mo shows that the ultimate tensile stress, determined approximately from the dislocation segment tension [6], has a value between 0.1–4.8 kg/mm2, i.e., very close to the micro-yield limit values sm, determined from quasi-relaxation experiments and hysteresis mechanisms.
The equation that describes the deformation process of the specimens under quasi-relaxation conditions, was developed by us considering the following conditions: the length of the load loop of the testing machine is kept constant after turning off the system at a relaxation instant t = 0, and in another moment t; in the most general case, the specimen begins to relax after a previous plastic deformation ep was performed. Hence, starting from the boundary condition that during the test the longitude of the mechanical force loop of the machine is kept constant, it is possible to obtain an expression for the deformation in the structure with the quasi-relaxation behavior that can be represented by:
 (16)
(16)
where so is the initial stress level, eo is the initial deformation of specimen, s(t) is the stress applied on specimen at time t , and åCi is the elastic coefficient of the mechanical loop considering the specimen elastics, and Co is the rigidity of the specimen.
Equation (16) is obtained from the comparison of the length of the loop of load of the test machine immediately after applying the stress on the specimen up to a value σo, at t = 0, and then at a time t; it is assumed that at t is plastically deformed with a deformation εo.
At t = 0, the length of the loop of load of the test machine (L) is equal to the sum of all the
elongations of the machine elements that transmitted the load on the specimen; i.e. to the length of both grips, including the specimen, which are deformed both elastically as well as plastically εo. If we designate the elastics of the whole machine as Si, then:
 (17)
(17)
and after a time t, of stopping the machine, the same length can be expressed as:
 (18)
(18)
being ∆lr the increase in the specimen length during the process of stress relaxation. Because the machines loop length cannot vary, and
L (o) = L (t) (19)
Equating the right hand side of equations (17) and (18), and upon reduction we obtain:
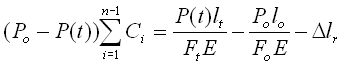 (20)
(20)
Considering that the specimens volume is kept constant during the plastic deformation, then lo Fo = lt Ft , and hence:
Ft = lo Fo/ lt (21)
During load, the specimens elastic behavior, after an initial plastic deformation, can be obtained by mixing equations (8) and (21), which leads to equation (22):
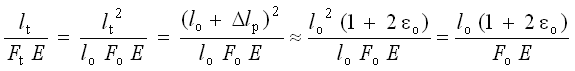 (22)
(22)
After putting equation (22) in (20), and calling e = Dlr/lo, followed by simple transformations the result acquires the following functionality:
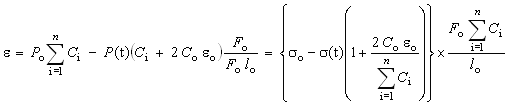 (23)
(23)
i.e. equation (23), is the expected result.
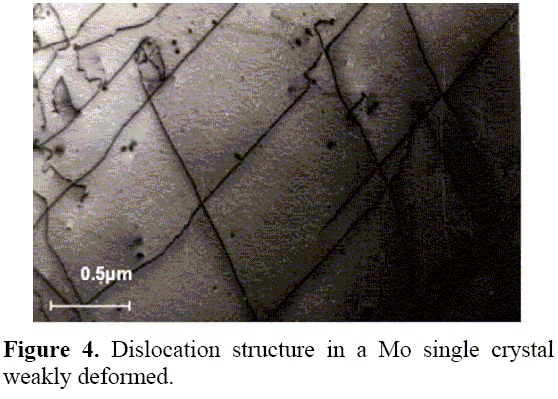
In Ref. [12] it was demonstrated how it is possible to analyze the dislocations dynamics and realize a thermally activated analysis of the deformation under quasi-relaxation conditions using equations (1) and (2). In situ three point flexural bending tests, showed that the dislocations sliding start at very low stress values, several times lower than the proportionality limit as determined from the macroscopic tests, as mentioned above for Mo [15]. The stress that produces the break-up of the dislocation segments depends on the chemical purity of the metal and the dislocations segments length. Considering that at the moment of edge dislocations breakup, the initial dislocation density r can increase by a factor not higher than p/2, and from the equation (1), then for Mo with starting r of 105– 106 cm-2, the micro-yield limit fluctuates between 0.05 to 0.15 kg/mm2, which is very similar to the stress necessary to put into motion the screw dislocations. As a consequence, even in the plastic deformation regime, for macroscopic specimens, spr = 14 – 18 kg/mm2, an intense dislocation generation is produced by the accumulation of the tails of the non-screw mobile dislocation segments edge. When the deformation starts, the screw dislocation multiplication is the most efficient mechanism to increase r in micro specimens, as can be seen in Figure 4. To this mechanism corresponds up to 80% of the increase in mobile dislocation density.
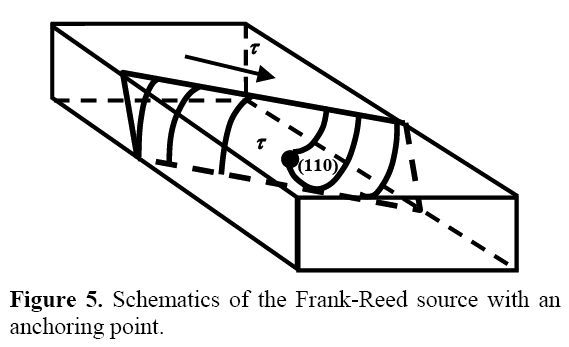
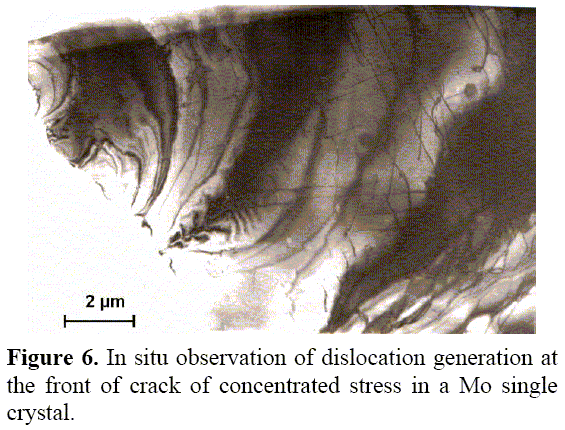
The remaining 20% corresponds to regenerative mechanisms of new dislocations; this mechanism is the Frank-Reed, with an anchoring spot, as shown in the schematic Figure 5, also to dislocation sources that act on stress concentrators at the specimen edges or in micro-cracks, as shown in the HVTEM micrograph (Figure 6).
At the start of the deformation process, when the screw dislocations increase dynamically, which were initially generated by the sliding of the edge segments of type J and V, the increase in the moving dislocation density is also influenced, and when a micro-crack is present, the regenerative type sources prevail.
The results of these observations coincide with those of Japanese researchers which have confirmed many of the characteristics about the dynamic behavior of the individual dislocations and their inter-relationships, which were theoretically predicted [16,17]. When the load is increased, the number of edge dislocation segments increases which were involved during the deformation process and hence in a very intense way develops the increase in the screw dislocations density.
In the early stages deformation of the specimens, the sliding of dislocations in <111> {110}, was observed in which the planes of type {110} were show-cased.
The dominant role of the non-screw (edge) dislocations, on the plastic deformation of micro specimens in the early stages of deformation, allows an association to the instant at which the micro yield limit appears. At that instant the non-screw dislocations break up and the massive sliding starts of the screw dislocations, originating the emergence of the yield tooth as a step of the micro yield [18,19].
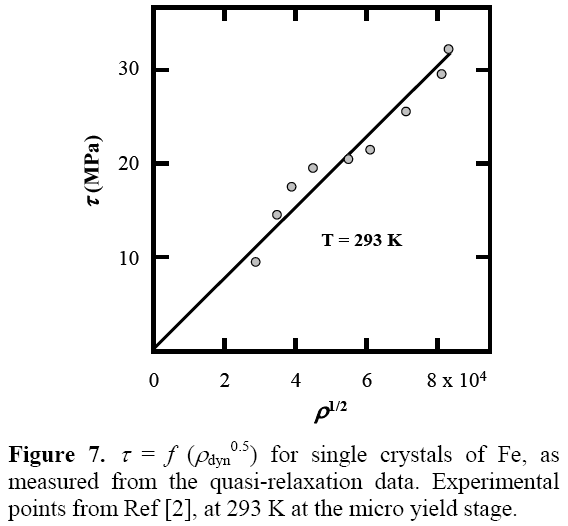
The sudden increase in r of the dynamic dislocations at the stage, which from the view point of the macroscopic deformation laws define elasticity, allows an analysis as a stage of accelerated process of hardening. Problems related to the hardening coefficient at this stage and the relationship between stress and strain were analyzed before in [20] and by Yermishkin and Plastinin [23] for Fe. It is interesting to point out that Imura et al. [2] came to the same conclusions on single crystals of Fe. In the above references t /ts = f(r), describes the sliding dynamic dislocation density, which increases in well defined temperature ranges that for single crystalline Fe varies between T = 153 K and 293 K at the micro yield stage up to reaching the yield limit. It can be noticed that the dislocation multiplication in single crystals of Fe occurs at least, at a stress of t /ts ³ 0.25.
As a support of the developments presented here, in Figure 7, t = f (rdyn0.5) is plotted for Fe specimens, using data obtained from tests done by the quasi-relaxation method, in which the experimental data from [2] has been used. The agreement between the data obtained from quasi-relaxation and that obtained by in situ HVTEM is remarkable so much qualitatively as quantitatively. Hence, we can point out without hesitation that the results shown in this paper support strongly the idea that the active dislocation multiplication is characteristic, not only of the macroscopic plastic deformation, but also of the micro plasticity stage [21]. If in the micro plasticity stage the deformation velocity is expressed e = b r v, and is given by an enhanced sliding velocity of the non-screw dislocations of relative low density r, then when the macroscopic limit of yield is reached, this will yield a slow sliding of the screw dislocations with a high density r.
As a consequence of the above, the yield limit corresponds physically to the stress at which the highest importance for the plastic deformation appears through the sliding of screw dislocations.
The emergence of the yield tooth in the stress-strain diagram is related to the fact that in absence of mobile dislocations, the disanchoring of sources that generate them requires considerable higher stresses than for the dynamic multiplication during the process of an ulterior deformation.
4. Conclusions
As results of HVTEM in situ experiments it has been established that:
-
During load above the micro yield-point, elastic deformation happens through the dynamic dislocations which appear as a result of reproduction of the original dislocations contained in the simple, when sliding is activated of the edge dislocation segments, dragging along the tails of the screw dislocations.
-
The dynamic dislocations present in crystalline materials under load conditions, reversibly are related to the dislocation structure that stays in the specimen after unloading;
-
Equation (1) relates the applied stress with the dynamic dislocations density under loading conditions, so much in the elastic field, as well as during the plastic deformation of the specimen.
-
The concepts established in this work avoid the contradictions between the theoretical analysis of the function t = f (r0.5) and the analogous data obtained from the experiments;
-
The results from the studies on the dynamics of the dislocations based on the relations obtained from experiments under quasirelaxation conditions, were corroborated experimentally in situ in the HVTEM using Mo single crystals with identical chemical composition and crystallography.
-
The in situ tests inside the HVTEM allow establishing an excellent correlation of the evolution of the structure of dislocations at two levels of resolution: In the atomic range of the order of 0.2-0.5 mm, and at the macro range, i.e., several microns.
5. Acknowledgments
We are indebted to the High Voltage Electron Microscopy facility of the Russian Academy of Science where the in-situ experiments were performed. We also thank Mr. Josue Romero (UNAM) and Maria Conchita Diaz Aguilar, IPN ESIME-Azcapotzalco for technical support.
6. References
1. Luft A, Kaun L, Phys. Stat. Solidi B 1970; 37 (2): 781-793. [ Links ]
2. Imura T, Dynamic Study of the Dislocation Progress of the Plastic Deformation and Fracture by High Voltage Electron Microscopy, London-New York (U.K.-USA): Academic Press, 1974, p. 179-188. [ Links ]
3. Gan G, Gilbert A, Gaffi P, Vliyaniye Rastvorimosti Elementov na Perejod Tugoplavkij Metallov iz Plasticheskogo v Jrupkoye Sostoyaniye. M: IMET 1964, p. 57. [ Links ]
4. Fugita H, Applications of an Ultra-High Voltage Electron Microscope to Metal Physics. In: Procedings of 4th Congress International on Electron Microscopy. Toulouse (France): 1975, p. 237-242. [ Links ]
5. Hirth JP, Lothe J. Theory of Dislocations, Institute of Physics, Oslo University. New York (USA): McGraw-Hill Book Company, 1972, p 599. [ Links ]
6. Ikeda S. J. Phys. Soc. Jpn. 1969; 27 (6): 1564-1578. [ Links ]
7. Trefilov VI, Milman YF, Firtsov SA, Fizicheskie Osnovy Prochnosti Tugoplavkij Metallov. Kiev (Ukraine): Naukova Dumka, 1975, p. 314. [ Links ]
8. Dingley DJ, McLean D. Acta Metall. 1967; 15 (5): 885-901. [ Links ]
9. Edington JW. Philos. Mag. 1969; 20 (165): 531-538. [ Links ]
10. Ivanova VS, Goritski VM, Orlov LG. Fizika Metallov i Metallovedenie 1973; T35: 1291-1298. [ Links ]
11. Nabarro FRN, Bazinskii ZS, Holt DB, Plastichnost Chistij Monokristallov, M.: Metallurgia 1967; p. 213. [ Links ]
12. Geminov VN, Yermishkin VA, Quasirelaxation as a powerful method of a steady-state creep characteristics prediction. In: Procceding of II International. Conference on Mechanical Behavior of Materials. Boston (USA): American Society for Metals, 1976, p. 138-154. [ Links ]
13. Ivanova VS, Ermishkin VA, Prochnost I Plastichnost Tugoplavkij Metallov I Monokristallov. Moscow (Russia): Ed. Metallurgiya, 1976, p. 80-101, and Ivanova VS, Yermishkin VA, Smirnov EG, Fiz. J. O. Metal. 1978; 5: 133-136. [ Links ]
14. Ivanova VS, Ermishkin VA, Plastinin VM. Metallofizika 1981; T3 (3): 100-108. [ Links ]
15. Savitsky EM, Ivanova VS, Yermishkin VA. Struktura I Svoystva Monokristallov Tugoplavkij Metallov. M: Nauka, 1973, p. 139-143. [ Links ]
16. Fuyita H. In: Procceding of 4th ICEM. Toulouse (France), 1975, p 237-242. [ Links ]
17. Prekel HL, Conrad H. Acta. Metall. 1967; 15 (5): 955-958. [ Links ]
18. Nabarro FRN, Basinski ZS. Holt DB, Adv. Phys. 1964; 13 (50): 193-323. [ Links ]
19. Lee KS, Eckert J, Chang YW. J. Non-Cryst. Solids 2007; 353 (26): 2515-2520. [ Links ]
20. Cottrell AH, Nabarro FRN. In: Dislocations and Plastic Flow in Crystals, Cottrell AH (ed.). Oxford (UK): Clarendon, 1953, p 98. [ Links ]
21. Suzuki T, Takeuchi S, Yoshinaga H, Dislocation Dynamics and Plasticity. Berlin (Germany): Springer-Verlag, 1991. [ Links ]
22. Tamayo Meza P, Yermishkin V, Bulnes Aguirre F. In: Proceedings of First International Workshop in Applied Mathematics. México DF (México): Instituto Politécnico Nacional, 2003, p. 239-254. [ Links ]
23. Yermishkin VA, Plastinin VM, Monokristally tugoplavkij i redkij metallov, splavov i soyedininii. M: Nauka, 1077. Pgs.157-159. [ Links ]
