


 Articulo en XML
 Referencias del artículo
 Enviar articulo por email
 Citado por SciELO
  Similares en
SciELO
Similares en
SciELO  uBio
uBio 
 Permalink
Interciencia
versión impresa ISSN 0378-1844
INCI v.32 n.10 Caracas oct. 2007
The parana river under extreme flooding: a hydrological and hydro-geochemical insight.
Pedro J. Depetris
Pedro José Depetris. Doctor in Geological Sciences, Universidad Nacional de Córdoba (UNC), Argentina. Professor, UNC, Argentina and Senior Scientist CONICET, Argentina. He was recently awarded the 2006 INTERCIENCIA Environment Prize. Address: Centro de Investigaciones Geoquímicas y de Procesos de la Superficie (CIGeS), FCEFyN, Universidad Nacional de Córdoba, Avenida Vélez Sarsfield 1611, X5016GCA Córdoba, Argentina. e-mail: pdepetris@com.uncor.edu
Summary
All fluvial systems may be subjected to extreme floods that impact deeply on their hydrological and bio-geochemical dynamics. Large rivers (i.e., continental-size drainage basins) are exposed to such drastic alterations, which in some cases have appeared as more frequent or severe in the recent past, probably as a consequence of the ongoing world-wide climatic change. The Parana River, one of the worlds largest fluvial systems, exhibits an active tele-connection between extreme flooding and the occurrence of ENSO events in the Pacific. Furthermore, a significant runoff increase is discernible since the 1970s. Extreme value theory shows that recent high-discharge events have exceeded predictions based on 100-year long historical records and it is likely that a flood with, for instance, a 200-year return period will surpass anything calculated on the same basis. The analysis of the geochemical impact of 1982-83 El Niño-triggered extreme flooding, which apparently was the 100-year flood, illustrates that dissolved phases exported during the flood show different behaviors: some phases are non-linearly diluted whereas others increase concentration as flow increases. Major ion (alkaline and alkaline-earth elements) relationships were significantly altered during the event due to changes in major sources (e.g., Cl- and Na+ switched from continental sources, most likely marine sediments and other saline environments, during low-medium flow to rainfall-supplied marine aerosols during high discharge). A group of total heavy metals determined during the 1982-83 flood appeared to follow an ideal dilution pattern, where a doubling of discharge determines a one-half decrease in concentration.
El río paranábajo crecida extrema: un enfoque hidrológico e hidro-geoquímico.
Resumen
Todos los sistemas fluviales pueden estar sometidos a inundaciones extremas con fuerte impacto en su dinámica hidrológica y bio-geoquímica. Los grandes ríos (cuencas de tamaño continental) están expuestos a tales alteraciones drásticas, que en ocasiones han surgido más frecuentemente o severas que en el pasado reciente, quizás como consecuencia de los cambios climáticos mundiales. El Río Paraná, uno de los mayores sistemas fluviales, exhibe una teleconexión activa entre inundaciones extremas y la ocurrencia de eventos ENSO en el Pacífico. Además, desde los años 70 se aprecia un caudal creciente. La teoría de los valores extremos muestra que eventos recientes de altos caudales han excedido las predicciones basadas en registros históricos de 100 años y es probable que una inundación con una periodicidad de 200 años rebase lo calculado. El análisis del impacto geoquímico de la inundación causada por El Niño en 1982-83, que aparentemente fue la inundación de los 100 años, ilustra que las fases disueltas exportadas durante la crecida muestran comportamientos diferentes: algunas fases son diluidas no-linealmente mientras otras aumentan en concentración con el aumento de flujo. Las relaciones iónicas (elementos alcalinos y alcalino-térreos) fueron significativamente alteradas durante el evento debido a cambios en las fuentes principales (p.e., Cl- y Na+ pasaron de fuentes continentales, muy posiblemente sedimentos marinos y otros sedimentos salinos, durante el flujo bajo/medio a aerosoles marinos durante altos caudales). Un grupo de metales pesados totales medidos durante la crecida 1982-83 pareció seguir un patrón de dilución ideal, donde el doble del caudal determina una reducción de la concentración a la mitad.
O rio paraná em períodos de enchentes extremas: um enfoque hidrológico e hidrogeoquímico.
Resumo
Todos os sistemas fluviais podem estar submetidos a enchentes extremas com forte impacto na sua dinâmica hidrológica e biogeoquímica. Os grandes rios (bacias e de tamanho continental) estão expostos a tais alterações drásticas, que em ocasiões têm surgido com maior freqüência ou têm sido mais severas no passado recente, quem sabe como conseqüência das mudanças climáticas mundiais. O Rio Paraná, um dos maiores sistemas fluviais, exibe uma teleconexão ativa entre enchentes extremas e a ocorrência de eventos ENSO no Pacífico. Alem disso, desde os anos 70 se aprecia um caudal crescente. A teoria de valor extremo mostra que eventos recentes de alta descarga têm excedido as predições baseadas em registros históricos de 100 anos e é provável que uma inundação com uma periodicidade de 200 anos ultrapasse o calculado. A análise do impacto geoquímico da enchente causada por "El Niño" em 1982-83, que aparentemente foi a enchente dos 100 anos, ilustra que as fases dissolvidas exportadas durante a enchente mostram comportamentos diferentes: algumas fases são diluídas não linearmente enquanto outras aumentam em concentração com o aumento do fluxo. As relações iônicas (elementos alcalinos e alcalino-térreos) foram significativamente alteradas durante o evento devido a mudanças nas fontes principais (p.e., Cl- e Na+ passaram de fontes continentais, muito possivelmente sedimentos marinhos e outros sedimentos salinos, durante o fluxo baixo/médio a aerossóis marinhos na chuva durante as altas descargas). Um grupo de metais pesados totais medidos durante a enchente 1982-83 pareceu seguir um padrão de diluição ideal, onde dupla descarga determina redução da concentração à metade.
Key Words/ ENSO / Flood Plain / Heavy Metals / Hundred-year Flood / Solute Sources / STable Isotopes /
Recibido: 27/03/2007 Aceptado: 31/08/2007.
A flood occurs when an area of low-lying land is covered with water. If soil and vegetation cannot absorb the excess water, it runs off the land in quantities that cannot flow within the physical limits of channels and rivers overflow their banks. Sporadic river flooding occurs naturally, shaping the area known as flood plain. Since biblical times it has been known that yearly flooding deposits organic-rich silt on the flood plain, improving its fertility. However, there is also an undesirable side to flooding, when exceptionally heavy precipitation causes disastrous inundation, often with significant losses in human lives and goods. Because of these implications it is of utmost significance to anticipate extreme flood events, both in small and in large river basins. Scientists are, however, unable to predict future hydrological events in a deterministic manner and are limited, instead, to attempt extreme-event predictions in a broad statistical sense (i.e., what is the return period of an exceptionally high flood?). It follows that it is also important to understand the factors (climatic, geomorphologic, and environmental) that shape up such events and, also, to learn more about the modifications that extreme flooding trigger in the interconnected geo-systems that make up riverine environments (e.g., does exceptionally high water only determine a straightforward dilution of soluble or particulate phases in the river flow or does it impact on the involved natural systems in other, somewhat hidden ways?)
By looking into the hydrological and hydro-geochemical characteristics of exceptional flooding in the Parana River -one of the largest drainage basins in South America- I have tried to contribute to a better understanding of the riverine response to extraordinary natural events. In several ways, it is also a condensation of over thirty years of fascinating experience, always seeking to unveil the scientific secrets hidden in those changing muddy waters.
Background
Geographical aspects
The Parana River drainage basin (Figure 1) covers an area of 2783x103km2 (Tossini, 1959) and accounts for 88% of the Río de la Plata total drainage basin surface area. Moreover, with a current total water discharge of ~16400m3s-1 (mean for 2000-2003), it accounts for about 76% of the Río de la Plata total outflow (~21500m3s-1) to the SW Atlantic Ocean. The remaining 24% is delivered by the Uruguay River.
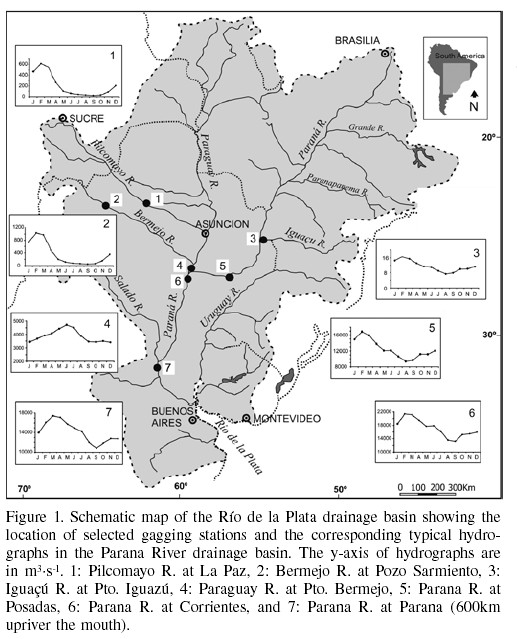
At 21°S the Parana headwaters occupy almost the total South American continental width. The northernmost tributary catchments are located in Brazil, at ~15°S and ~45°W, whereas its western water sources are close to the Andes, at ~65°W, at the upper catchments of the Pilcomayo and Bermejo rivers. The Paraguay River headwaters are in the Gran Pantanal (Brazilian Mato Grosso, ~15°S, and ~55-~60°W). A couple of middle-size tributaries, the Salado and the Carcarañá rivers, join in the main stem at the rivers middle and lower reaches, respectively. Most of the Parana River drainage basin is included within the Guaraní aquifer (a.k.a. Mercosul aquifer), one of the worlds largest groundwater reserves (Araújo et al., 1999).
The mean annual rainfall is unevenly distributed over the entire drainage basin. Maximum recorded precipitation (~2400mm·y-1) occurs along the eastern edge of the basin, near the city of Sao Paulo, Brazil, and over the upper Iguaçu River drainage basin. Rainfall decreases markedly (800-400mm·y-1) towards the western margin of the basin, along the 60-65°W strip that borders the Andes.
The main stem hydrograph of the Parana (Figure 1) resembles that of the Iguaçu, with high flow during February (summer) and low waters during the southern spring (Sep-Oct). The western tributaries (Bermejo and Pilcomayo rivers) reach maximum annual discharges during Feb-Mar, whereas the Paraguay River reaches maximum flow during Jun-Jul (winter).
The upper headwaters, fully developed within Brazil, supply about 73% of the freshwater volume that the Parana delivers to the Río de la Plata, after passing through its inland delta. Roughly, the remaining is supplied by the Paraguay River (~3800m3·s-1). This flow distribution, however, is not uniform throughout the year, because the Paraguay supplies up to 34% of the middle Parana River discharge during winter months, and about 19% during the high water period of the Parana, in Jan-Feb (Figure 1). Furthermore, inspection of the 100-year long time-series shows that the relative contribution of the Paraguay to the Parana River total runoff has been as low as 1% (as in the mid 1940s) and as high as 50% (as in the early 1960s).
The mean Parana River sediment load in the middle stretch is of ~80×106 metric tons, although the annual transport rate may fluctuate between ~40×106 and >100×106ton, depending on the prevailing hydrological conditions. With suspended sediment concentration often exceeding 5g·l-1, the Bermejo River supplies most of the sediment load transported by the Parana River. Contrasting, the Parana annually exports to the Río de la Plata a mean of ~38×106ton of dissolved salts (Depetris and Paolini, 1991 and references therein). Furthermore, the geochemical characteristics of the suspended and dissolved load of the Parana River have been considered elsewhere in detail (Depetris and Pasquini, 2007).
The Parana River has a 900km long alluvial plain, which is about 10km wide at Corrientes (where the upper Parana joins the Paraguay River and its middle reach begins; Figure 1), and 60km wide at the mouth, in the delta region. The flood plains total surface area is ~33000km2 and it is a wetland fully colonized by riparian vegetation and totally dissected by relatively shallow streams, ponds, marshes, and ox-bow lakes of variable size and seemingly anarchic distribution. The mechanism of flooding is such that the impact of moderately high floods is restricted to ponds and lagoons located in the vicinity of the main channel; only extraordinary flooding events inundate completely the flood valley and reach water bodies that are seldom affected by more frequent and lower flood events.
The climatic signature
The summer circulation over South America is dominated by a monsoonal system, whose major seasonal feature is the South Atlantic Convergence Zone (SACZ), which is placed along the north-eastern boundary of the Río de la Plata drainage basin (Robertson and Mechoso, 2000; Carvalho et al., 2004). A low-level northerly/northeasterly jet that flows east of the Andes is another important feature that controls climate in the region and transports moisture along the corridor that runs between the Andes and the Brazilian altiplano (Wang and Fu, 2004). Almeira and Scian (2006) have recently explored the role played by some atmospheric and oceanic indices as predictors of seasonal rainfall in the Río de la Plata drainage basin.
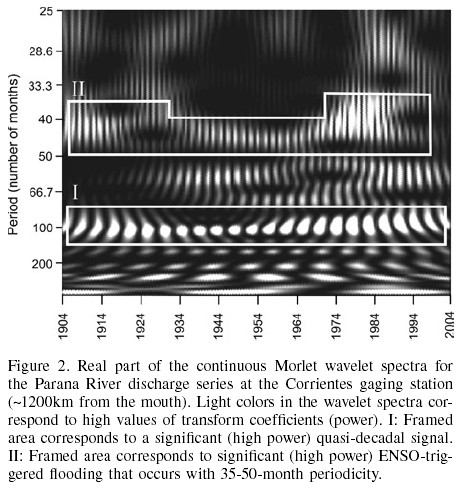
The climatic phenomenon known as El Niño-Southern Oscillation or ENSO is a significant factor superimposed on the usual atmospheric circulation that affects the flooding regime of several South American rivers (e.g., Parana, Magdalena, Uruguay). The warm phase of ENSO, which usually determines excess rainfall in many parts of South America, occurs in phase with the normal high-water period of the Parana River. Therefore, such coupling determines extreme flooding events in the Parana during the southern summer, which have been recorded several times since the beginning of the 20th century (Depetris et al., 1996). ENSO has an usual interannual recurrence interval of 33 to 50-month, but it is not the only harmonic event that determines repeated extreme flooding in the Parana, because there is a stronger and persistent decadal mechanism that is also evident when discharge time series are scrutinized by means of spectral analysis (Pasquini and Depetris, 2007, and references therein). Figure 2 shows the real part of the Morlet wavelet power spectrum (Nakken, 1999) for the Parana River 1904-2004 discharge time series at Corrientes, some 1200km upstream from the mouth. Inasmuch as light-colored spots in the figure correspond to high power (i.e., variance), it becomes clear that the Parana has shown a persistent quasi-decadal (~100-month period) oscillation throughout the 20th century that has been associated with sea surface temperature anomalies over the northern tropical Atlantic Ocean (Robertson and Mechoso, 1998). Further, the ENSO-like signal exhibited an uneven presence throughout the past century but showed a stronger signal after the early 1970s.
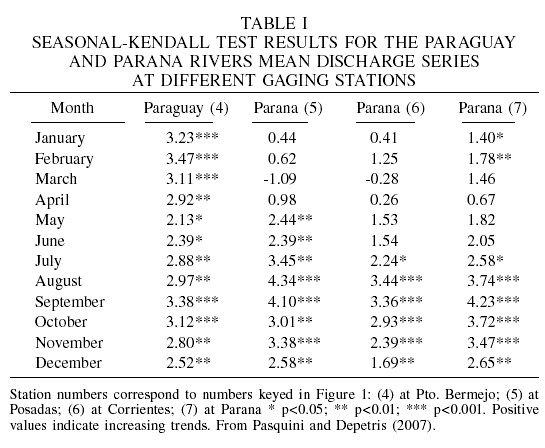
There is significant evidence that regional rainfall and river runoff have been increasing in the Río de la Plata drainage basin throughout the 20th century, and most authors place the change in slope around the early 1970s (Boulanger et al., 2005; Dore, 2005; García and Mechoso, 2005; Pasquini and Depetris, 2007). In Pasquini and Depetris (2007) the Mann-Kendall trend test employed on Parana discharge data exhibited significant evidence (p<0.001) that the mean annual discharge has been increasing. In addition, the seasonal Kendall test (Hirsch et al., 1982) applied to the Parana River monthly discharge data (Pasquini and Depetris, 2007) showed that the flow increase is precisely occurring during low-discharge months (southern winter). When high-discharge months (summer) displayed a flow increase, they were the least significant in statistical terms (Table I).
Hydrological Characteristics of Extreme Flooding
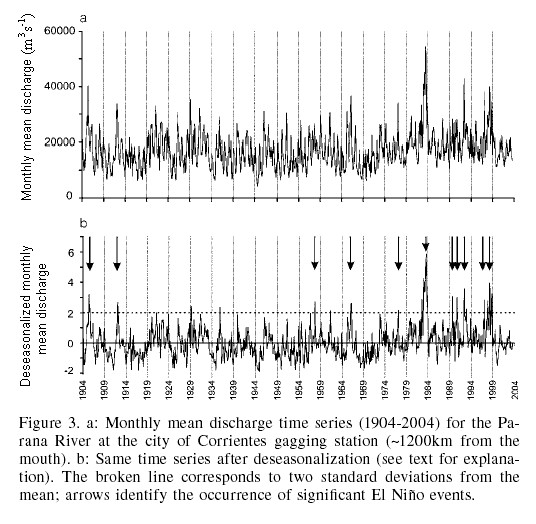
Figure 3 shows the 100-year long discharge time series recorded since 1904 at Corrientes, ~1200km upriver from the mouth (upper graph), and the corresponding deseasonalized time series (lower graph). Deseasonalization of the original data series was accomplished by means of Q*ij = (Qij – Qi)/Si, where Qij is the monthly mean discharge for the ith month of the jth year, Qi is the historical mean discharge for the ith month and, likewise, Si is the historical standard deviation for the ith month. The resulting deseasonalized series in Figure 3b is then presented in terms of standard deviations. Those flood events in Figure 3b that exceed two standard deviations are considered exceptional floods. It is interesting to notice that low water events (negative peaks in graph b) rarely reach below one standard deviation, and many of such peaks are coherent with La Niña occurrences in the Pacific. Likewise, most outstanding floods, particularly in the recent past, are coherent with El Niño events, like the exceptional flood of 1982-83.
Extreme value theory is often employed to deal with the maximum deviations from the median of probability distributions. The general theory sets out to assess the type of probability distributions generated by different processes, such as the likelihood of occurrence of 100-year floods. Figure 4 shows the plot for the Parana River flow at Corrientes. In this case, the 1904-2004 maximum daily discharge series (a series built with the maximum instantaneous discharge of every year) were used to examine flow probabilities. Following the procedures described by Haan et al. (1994), one can examine, for example, which is the probability that any instantaneous flow should exceed 37000m3·s-1 (which appears to be a significant high-flow event at Corrientes)?: prob (Qp<Q37,000)= prob Z >(Qx - Qµp)/SQ, where Qx= 37000m3·s-1, Qµp= 29444.5m3·s-1 is the mean maximum discharge for the series, SQ= 7606.4m3·s-1 is the series standard deviation, and Z is the corresponding coefficient from the cumulative standard normal distribution (Haan et al., 1994). Then, prob (Qp< Q37,000)= 0.1611. It is possible now to use this probability to calculate the return period for a flow of 37000m3·s-1: T= 1/prob (Qp> 37000m3·s-1) » 6 years. Interestingly, this return period is close to the interannual periodicities of the El Niño events in the Equatorial Pacific Ocean.

It is also remarkable that the fitted lognormal distribution line fails to adjust to the recorded data beyond de 50-year return period and, also, the extreme value Type I distribution falls short of the real 100-year return period (Figure 4), which apparently was reached during the 1982-83 El Niño flood. It is obvious that actual data for extreme events deviate sharply from the models calculated with historical data. Clearly, this is additional evidence sustaining the notion that the amplitude of extraordinarily high floods has increased significantly over the recorded history and that future 200-year events, for example, will surely surpass any previous mark in the historical record.
Hydro-geochemical Response to Extreme Flooding
As seen above, a 100-year flood means the highest level of flooding that, on the average, is likely to occur once every 100 years. It also refers to a flood which has a 1% annual probability of being equaled or exceeded. In the Parana River, exceptional flooding means instantaneous discharges of ³60000m3·s-1 (Figure 4). Although it is not the only impact of high flooding on riverine hydrochemistry, water dilution is the most straightforward effect. Also, as stated above, during such unusual conditions the water reaches sectors in the flood valley which are rarely reached by river water (i.e., theoretically, once every 100-years) Therefore, extreme flooding ends up remobilizing soluble or particulate materials that accumulated between exceptional floods in the riparian environment of the flood plain, thus modifying the most frequent chemical composition or concentration of its dissolved or particulate load.
The biogeochemical aspects of these processes that occur in the Parana River were considered in earlier contributions (Depetris and Kempe, 1990, 1993; Depetris and Gaiero, 1998; Depetris, 2005). The major findings relevant to the impact of extreme flooding can be summarized as follows: a) exceptional floods are effective mechanisms to increase the continental export of dissolved carbon, whether it is the product of biological respiration (pCO2 in the Parana main stem reached 15000ppmv during the 1982-83 flood) or simply "dissolved" organic matter (Paranas usual dissolved organic carbon (DOC) export rate was more than doubled during the 1982-83 flood); b) the particulate carbon fraction (POC) did not seem to follow the same pattern shown by DOC, and appeared to be mostly subjected to dilution during the high flood; c) also, extreme flooding determines a change in the water-surface slope for the riverine lower reaches that, in turn, results in lower water velocities and a lower debris carrying capacity; d) the C:N ratio in suspended matter reached high values (³25) during the early stages of the flood, thus suggesting that vascular plant debris from the riparian environment was being flushed-out from its temporary storage in the flood plain; and e) in the Parana, the usual C:N ratio of suspended matter corresponds to terrigenous sources (C:N »10, mostly soil material), although it may be mainly phytoplankton (C:N <8) during the high floods peak discharges.
Stable isotopes, such as 18O and 2H (or D, for deuterium), are used to identify and understand the sources of water, or processes that have affected water molecules since they were produced by evaporation of sea water. STable isotopes are measured as ratios (such 18O:16O) and the delta notation (d18O) is customarily used to represent the relative difference in parts per thousand (or per mil, ) between the ratio in a sample and the ratio in a predetermined standard, such as the Standard Mean Ocean Water or SMOW (Faure, 1986).
Figure 5a shows the contrast between the isotopic composition of samples collected along the Paranas main stem, the "meteoric-water line" (i.e., the empirical equation dD= 8d18O+10, defined by isotopic values measured in meteoric waters), and samples collected in tributaries, flood plain streams or adjacent ponds. Such samples plot along a line that roughly has one-half the slope of the meteoric water line. This is usually interpreted as an evidence of significant evaporation that does not occur in the main channel only but, most likely, takes place preferentially in the numerous water bodies that occupy the wide flood plain. The water exchange mechanisms between flood plain and main channel are surely responsible for the significant departure of the observed regression line from the meteoric water line.
Figure 5b shows the variability of d18O throughout the 1982-83 Parana flood event, along with the recorded water and air temperatures. There is a significant lag between d18O and the temperatures, as measured ~600km upstream from the Parana mouth. Particularly after 1981 temperatures lag behind d18O by about 90 days.
Oxygen and hydrogen isotopes are subjected to a Rayleigh fractionation (Faure, 1986) by means of which precipitation becomes progressively more depleted in H218O and HD16O and, therefore, d18O and dD in continental rainfall become more negative with increasing distance from the ocean, the original water vapor source. Therefore, the negative d18O values (-6 to -7) measured at the onset of the 1982-83 El Niño flood (Figure 5b, c) were probably determined by increased precipitation originated at a distant oceanic source, contributing excess water to the convective mechanism that usually accounts for the atmospheric precipitation in the upper drainage of the Parana.
The excess of precipitation determines that the most obvious and significant impact of flooding in large rivers is the dilution of their dissolved and particulate load. Such dilution, however, is not a straightforward mechanism because not all the transported components, dissolved or particulate, originate in the same source or behave in a similar manner when subjected to increased water volume. Figure 6, for example, shows the variability of electrical conductivity (a measure of total ionic strength) of Parana River water with the corresponding discharge, from 1981 to 1984. The relationship shows the non-linear diluting effect of increased discharge, which deviates markedly from the ideal model: the simple exponential regression equation shows that doubling the discharge (e.g., from 20000 to 40000m3·s-1) results in a decrease from 60.7 to 40.7µS·cm-1, which obviously is not one-half of the initial conductivity, as an ideal dilution would determine. Furthermore, only ~45% of the total variance of electrical conductivity is accounted for by discharge and the remainder 55% is attributable to other causes.
One factor that plays a major role in the alteration of the discharge-concentration relationship during exceptional flood events is the growth of certain solute sources beyond their usual level of importance. For example, Figure 7a shows the variability of the Cl-:Na+ molar ratio during the 1982-83 El Niño-triggered flood in the Parana River. Low, pre-El Niño discharges exhibit high, sharply fluctuating ratios that suggest the pre-eminence of widely differing solute sources (most likely Cl- increased at the expense of Na+, mostly adsorbed onto particulate mineral phases) which tend to be much more uniform during the flood event and mostly remain below a ratio of ~1.5. During such circumstances, rainfall-supplied marine aerosols appear to become the dominant source for both Cl- and Na+ in the Parana River water inasmuch as the mean marine Cl-:Na+ is ~1.16 (Stumm and Morgan, 1996).
In contrast, the concentration of the alkaline earths Ca2+ and Mg2+ show a markedly different dynamics (Figure 7b) during extreme flooding, having a higher degree of covariance with measured discharges than the Cl-:Na+ ratio does. Clearly, the water-soluble fraction of both Ca2+ and Mg2+ was flushed-out of the system from different sources, also under differing hydrological conditions. For comparison, the (Ca2++Mg2+):(Na++K+) molar ratio of mean seawater is 0.13 (Stumm and Morgan, 1996).
Heavy metals may derive from the weathering of rock-forming minerals or they may be delivered to the hydrosphere or atmosphere by a myriad of human activities. In an earlier paper (Depetris et al., 2003) dealing with the geochemical characteristics of Paranas suspended sediment load (SSL), it was shown that a) there is a significant decrease of elemental variance as the SSL sampling site moves from mountainous (Bermejo and Pilcomayo rivers) headwaters to the mouth; b) there is a progressive loss of soluble elements and an enrichment of hydrolysates, following the same downriver trend outlined before, which may be partly due to the grain-size sorting of its suspended load; and c) not surprisingly, the concentration of heavy metals in the SSL approaches that of the NASC (North American Shale Composite) standard.
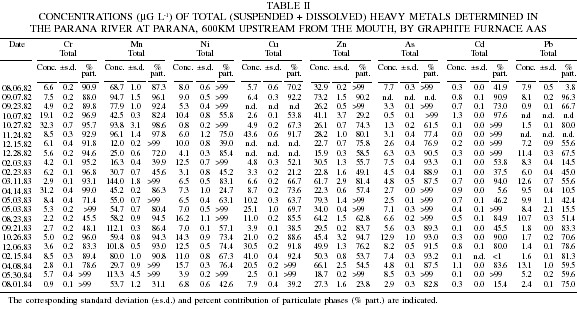
In general, the concentration of total metals (dissolved + suspended sediment phases) in the Parana River increases downriver at differing rates; for example, Mn and Cr increase their respective concentrations more markedly than Zn and As (Figure 8a). This process may be the joint result of natural and anthropogenic factors; for example, the total concentration of As (which strictly speaking is a metalloid) in the Parana may be significantly influenced by As-rich aquifers, abundant in Argentinas Pampa plains. Table II lists the total concentrations (determined by automated graphite furnace atomic absorption spectrophotometry after thorough digestion with conc. redistilled HNO3) of selected heavy metals, measured in the Parana ~600km upstream from the mouth during the 1982-83 El Niño extreme flood. The fine-grained suspended load, where heavy metals are either adsorbed onto colloids or residing in the crystalline structure of minerals, is clearly the phase where they are dominantly transported. With the exception of Pb, whose dissolved fraction has a mean value ~40%, the remaining elements are mostly transported in the particulate phases (75-85%). Now, is there a discernible impact of the flood on the concentration of metals? The impact seems to be restricted to direct dilution. During the flooding event, the concentration of total heavy metals (the added concentrations of Pb, Cr, As, Cd, Zn, Ni, Mn, and Cu) showed a simple dilution trend with increasing discharges; roughly, the concentrations of total metals decreased to one-half when river discharges were doubled (Figure 8b).
Concluding Comments
The occurrence of extreme flooding or 100-year floods in continental-size drainage basins are clearly linked to exceptional climatic events. In the Parana River, such episodes are often associated with the occurrence of the ENSO in the equatorial Pacific Ocean, which occur in phase with the customary seasonal high-water period. There is evidence, however, that there is a significantly increasing trend in the Paranas annual runoff, and that such trend is mainly determined by a discharge increase occurring during low–water months. In other words, although the once-in-a-century flood occurred in coherence with the exceptionally strong 1982-83 ENSO, most of the runoff change appears to be accounted for by the flow increase observed during the southern winter, which in the Parana River is the low-flow season. Is this a signal of global climatic change? The answer is most likely yes and, hence, more frequent high floods should be expected in the foreseeable future.
Does the geochemical system of a large river behave during an exceptional flood just as it does during the usual seasonal flooding? Excess water invariably determines an overall dilution effect, which may be non linear and is more discernible in some chemical components than in others. Flooding also means the inclusion of additional sources of dissolved and particulate phases, which may not be operational during the normal functioning of the system, when it bears a strong seasonal signature. In the Parana, this is clearly the case of the flood plain that, with its numerous water bodies and rich riparian cover, is a major source of organic matter, nutrients, and other byproducts of organic matter mineralization. Other interesting examples are the pre-eminence of rain-supplied marine aerosols during the uppermost stages of the flood (e.g., Cl- and Na+) or the increased supply of other cations, such as Ca2+ and Mg2+, which appear to be remobilized during the flood event.
Although some rivers may be more affected than others by the ongoing climatic change, it is clear that most (particularly continental-size systems) will progressively function in warmer, more humid or drier realms. It is then clear that historical data sets must be scrutinized in order to anticipate the likely consequences of global warming on riverine dynamics.
ACKNOWLEDGEMENTS
The author acknowledges the support of Argentinas Consejo Nacional de Investigaciones Científicas y Técnicas (CONICET) and the Universidad Nacional de Córdoba, Argentina. Financial support for the work reported here was received from CONICET and Argentinas FONCYT. The data used was mostly collected during the early and mid 80s, within the framework of the SCOPE-UNEP Carbon Project, led by the late Prof. E.T. Degens. Thanks are expressed to A.I. Pasquini, for her valuable assistance in the preparation of this manuscript.
REFERENCES
1. Almeira GJ, Scian, B. (2006) Some atmospheric and oceanic indices as predictors of seasonal rainfall in the Del Plata Basin of Argentina. J. Hydrol. 329: 350-359. [ Links ]
2. Araújo LM, França AB, Potter PE (1999) Hydrogeology of the Mercosul aquifer system in the Parana and Chaco-Parana Basins, South America, and comparison with the Navajo-Nugget aquifer system, USA. Hydrogeol. J. 7: 317-336. [ Links ]
3. Boulanger JP, Leloup J, Penalba O, Rusticucci M, Lafon F, Vargas W (2005) Observed precipitation in the Parana-Plata hydrological basin: long-term trends, extreme conditions and ENSO teleconnections. Clim. Dyn. 24: 393-413. [ Links ]
4. Carvalho LMV, Jones C, Liebmann B (2004) The south Atlantic Convergence Zone: Intensity, form, persistence, and relationships with intraseasonal to interannual activity and extreme rainfall. J. Clim. 17: 88-108. [ Links ]
5. Depetris PJ (2005) Revisiting biogeochemical aspects of the Parana River. In Heathwaite L et al. (Eds.) Dynamics and Biogeochemistry of River Corridors and Wetlands. Publ. 294. IAHS. Wallingford, UK. pp. 159-166. [ Links ]
6. Depetris PJ, Gaiero DM (1998) Water-surface slope, total suspended sediment and particulate organic carbon variability in the Parana River during extreme flooding. Naturwiss. 85: 26-28. [ Links ]
7. Depetris PJ, Kempe S (1990) The impact of the El Niño 1982 event on the Parana River, its discharge and carbon transport. Palaeogeogr. Palaeoclim., Palaeoecol. (Glob. Planet. Chan. Sect.) 89: 239-244. [ Links ]
8. Depetris PJ, Kempe S (1993) Carbon dynamics and sources in the Parana River. Limnol. Oceanogr. 38: 382-395. [ Links ]
9. Depetris PJ, Kempe S, Latif M, Mook WG (1996) ENSO-controlled flooding in the Parana River (1904-1991). Naturwiss. 83: 127-129. [ Links ]
10. Depetris PJ, Paolini JE (1991) Biogeochemical aspects of South American rivers: The Parana and the Orinoco. In Degens ET et al. (Eds.) Biogeochemistry of Major World Rivers. SCOPE 42. Wiley. Chichester, UK. pp. 105-125. [ Links ]
11. Depetris PJ, Pasquini AI (2007) The geochemistry of the Parana River: An overview. In Iriondo MH et al. (Eds.) The Middle Parana River: Limnology of a Subtropical Wetland. Springer. Heidelberg, Germany. pp. 143-174. [ Links ]
12. Depetris PJ, Probst JL, Pasquini AI, Gaiero DM (2003) The geochemical characteristics of the Parana River suspended sediment load: an initial assessment. Hydrol. Proc. 17: 1267-1277. [ Links ]
13. Dore MHI (2005) Climate change and changes y global precipitation patterns: What do we know? Env. Int. 31: 1167-1181. [ Links ]
14. Faure G (1986) Principles of Isotope Geology. Wiley. New York, USA. 589 pp. [ Links ]
15. García NO, Mechoso CR (2005) Variability in the discharge of South American rivers and in climate. Hydrol. Sci. J. 50: 459-477. [ Links ]
16. Haan CT, Barfield BJ, Hayes JC (1994) Design Hydrology and Sedimentology for Small Catchments. Academic Press. San Diego, USA. 588 pp. [ Links ]
17. Hirsch RM, Slack JR, Smith RA (1982) Techniques of trend analysis for monthly water quality data. Water Res. 20: 107-121. [ Links ]
18. Nakken M (1999) Wavelet analysis of rainfall-runoff variability isolating climatic from anthropogenic patterns. Env. Model. Softw. 14: 283-295. [ Links ]
19. Pasquini AI, Depetris PJ (2007) Discharge trends and flow dynamics of South American rivers draining the southern Atlantic seaboard: An overview. J. Hydrol. 333: 85-399. [ Links ]
20. Robertson AW, Mechoso CR (1998) Interannual and decadal cycles in river flows of Southeastern South America. J. Climate 11: 2570-2581. [ Links ]
21. Robertson AW, Mechoso CR (2000) Interannual and interdecadal variability of the South Atlantic Convergence Zone. J. Climate 11: 2947-2957. [ Links ]
22. Stumm W, Morgan JJ (1996) Aquatic Chemistry. Chemical Equilibria and Rates in Natural Waters. 3rd ed. Wiley. New York, USA. 1022 pp. [ Links ]
23. Tossini L (1959) Sistema hidrográfico y cuenca del Río de la Plata. An. Soc. Cient. Arg. 167(3-4): 41-64. [ Links ]
24. Wang H, Fu R (2004) Influence of cross-Andes flow on the South American Low-level jet. J. Climate 17: 1247-1262. [ Links ]
