


 Articulo en XML
 Referencias del artículo
 Enviar articulo por email
 Citado por SciELO
  Similares en
SciELO
Similares en
SciELO  uBio
uBio 
 Permalink
Interciencia
versión impresa ISSN 0378-1844
INCI v.33 n.8 Caracas ago. 2008
A new hurricane index for the Caribbean
John Bye and Kevin Keay
John A. T. Bye. B.S. in Oceanography, Liverpool University, UK. Ph.D. in Meteorology, London University, UK. Principal Fellow, University of Melbourne, Australia. Address: School of Earth Sciences, University of Melbourne, Victoria 3010, Australia. e-mail: jbye@unimelb.edu.au
Kevin Keay. B.S. in Applied Physics, M.S. in Mathematical Modelling and Data Analysis, Royal Melbourne Institute of Technology, Australia. Senior Research, University of Melbourne, Australia. e-mail: keay@unimelb.edu.au
SUMMARY
A new index for hurricane development is introduced which indicates regions of the tropical ocean where tropical cyclones are likely to be generated and regions where existing cyclones would be spun-down. The index physical basis, which can be computed from the fields of sea surface temperature (SST) and evaporation, is briefly discussed. The principal result is that regions favorable to the development of tropical cyclone development are characterized by strong negative spatial gradients of evaporation with respect to SST, whereas cyclones are likely to be spun-down in regions of strong positive gradients. The application to the Caribbean region indicates a corridor of favorable conditions in the central Caribbean, possibly promoted by the presence of easterly waves, and a southern unfavorable zone that shelters the Venezuelan coast from hurricane impact. The results show in detail the reasons for the variability in hurricane seasons, using 1983 and 2005 as examples. On the large scale, the sign and strength of the SST dipole anomaly between the Pacific and the Atlantic oceans appears to be the controlling influence, a positive anomaly in the Atlantic Ocean leading to hurricane formation. The monthly standard deviation of the hurricane index simulates reasonably well the historical fluctuations in hurricane occurrence in 1979-2005, and using the results of a coupled climate model, it predicts that the hurricane season in 2051-2080 will be lengthened to include an early season maximum in June and another in September-October, in contrast to the current single maximum in September.
Un nuevo índice de huracanes para el Caribe
RESUMEN
Se presenta un nuevo índice de desarrollo de huracanes que indica las regiones del océano tropical donde es probable que se generen ciclones tropicales y regiones donde los ciclones existentes serían atenuados. Se discute brevemente las bases físicas del índice, que pueden ser calculadas de los campos de temperatura la superficie del mar (SST) y de evaporación. El principal resultado es que las regiones favorables al desarrollo de ciclones tropicales están caracterizadas por gradientes espaciales de evaporación fuertemente negativos con respecto a SST, mientras que los ciclones tienden a ser atenuados en regiones con gradientes fuertemente positivos. La aplicación a la región caribeña indica un corredor de condiciones favorables in el Caribe central, posiblemente promovidas por la presencia de ondas del este, y una zona sur desfavorable que protege la costa venezolana del impacto de huracanes. Los resultados muestran en detalle las razones de la variabilidad en temporadas de huracanes, empleando los años 1983 y 2005 como ejemplos. A gran escala, el signo y la magnitud del dipolo de la anomalía en SST entre los océanos Pacífico y Atlántico parece ser la influencia controladora, una anomalía positiva en el Océano Atlántico que lleva a la formación de huracanes. La desviación estándar mensual del índice simula razonablemente bien las fluctuaciones históricas en la ocurrencia de huracanes en 1979-2005 y, empleando los resultados de un modelo climático acoplado, predice que las temporadas de huracanes en 2051-2080 se extenderán para incluir un máximo temprano en junio y otro en setiembre-octubre, en contraste con el máximo único actual en setiembre.
Un novo índice de FuracÕes para o Caribe
RESUMO
Apresenta-se um novo índice de desenvolvimento de furacões que indica as regiões do oceano tropical onde ha probabilidade de que se gerem ciclones tropicais e regiões onde os ciclones existentes seriam atenuados. Discutem-se brevemente as bases físicas do índice, que podem ser calculadas dos campos de temperatura da superfície do mar (SST) e de evaporação. O principal resultado é que as regiões favoráveis ao desenvolvimento de ciclones tropicais estão caracterizadas por gradientes espaciais de evaporação fortemente negativos em relação à SST, enquanto que os ciclones tendem a ser atenuados em regiões com gradientes fortemente positivos. A aplicação a região caribenha indica um corredor de condições favoráveis no Caribe central, possivelmente promovidas pela presença de ondas do leste, e uma zona sul desfavorável que protege a costa venezuelana do impacto de furacões. Os resultados mostram em detalhe as razões da variabilidade em temporadas de furacões, empregando os anos 1983 e 2005 como exemplos. Em grande escala, o signo e a magnitude do dipolo da anomalia em SST entre os Oceanos Pacífico e Atlântico parece ser a influência controladora, uma anomalia positiva no Oceano Atlântico que leva a formação de furacões. O desvio padrão mensal do índice simula razoavelmente bem as flutuações históricas na ocorrência de furacões no período 1979 a 2005 e, empregando os resultados de um modelo climático acoplado, prediz que as temporadas de furacões entre 2051 e 2080 se estenderão para incluir um máximo no começo de junho e outro de setembro a outubro, em contraste com o atual máximo único em setembro.
KEYWORDS / Caribbean Sea / Climate Change / Hurricane Prediction /
Received: 04/24/2007. Modified: 06/16/2008. Accepted: 06/25/2008.
The occurrence of hurricanes in the Caribbean region is of great significance to all the countries of the region. An important contemporary question is whether there are likely to be any changes in patterns due to global warming. We present here results for the Caribbean region, which are based on a recent study (Bye et al., 2008) that uses a new index for the likelihood of the development of hurricanes. The climatology of the geographical structure of the index shows why Venezuela is unlikely to be ravaged by hurricanes, but the region to the north forms a natural path for hurricane development affecting Jamaica, Puerto Rico and the Dominican Republic and Haiti, as well as Honduras and Nicaragua, and also extending into the Gulf of Mexico, and northwards to Florida and the south-western Atlantic Ocean including Bermuda (Elsner and Kara, 1999). The year-to-year variability of the index simulates with some confidence the occurrence of active and quiet hurricane seasons over the period 1979-2005, and on a longer time scale, using a coupled atmosphere-ocean climate model predicts the likely changes in the hurricane season between the period 1979-2005 and the future period 2051-2080.We begin with a non-technical introduction to the methodology of the hurricane index and how it is related to earlier work on hurricane prediction. The reader is referred to a full theoretical discussion in Bye et al. (2008) which forms a Chapter in a new book on Hurricanes and Climate Change (Elsner and Jagger, 2008).
Hurricane prediction
The tropical oceans are characterized by an environment in which on average the sea surface temperature (SST) gradually increases towards the equator, whereas the surface wind speed gradually decreases (see Byers, 1974). On a finer scale, regions of much greater negative gradients of sea surface temperature and surface wind speed are continually evolving, with compensating regions of positive gradient. This is the basic surface structure of the coupled ocean/atmosphere in the tropical cyclone generation regions. The active agent is the tropical ocean mixed layer, which provides the energy required for tropical cyclone development. The complete energy cycle involves regions of spin-up in which the gradient of SST and surface wind speed is negative, and heat is transferred from the ocean to the atmosphere, giving rise to convection (and leading to the possibility of warm core formation and tropical cyclone development), and regions of spin-down, in which the gradient of SST and surface wind speed is positive, i.e. the SST reduces with wind speed, due to the stirring action of the wind field, which returns a proportion of its kinetic energy to the ocean and hence maintains the mixed layer.
The hurricane index (H) is proportional to the efficiency of these energy conversion processes. More precisely, H= dlnu/dT where u is the surface wind speed and T is the sea surface temperature. This expression is the ratio of the (spatial) gradients in kinetic energy of the surface wind and potential energy of the mixed layer, normalized with respect to the local kinetic energy and mixed layer depth. It has been evaluated from the NCEP reanalysis data (Kalnay et al., 1996) for evaporation (E) and the Hadley Centre sea surface temperature data (Rayner et al., 2003) to obtain monthly averages of H on a resolution of 1º over the period 1979-2005, using the approximate formula dlnu/dT= dlnE/dT-C, where C »0.065K-1, which is based on the aerodynamic bulk relationship for evaporation (Bye et al., 2008). Note that in a preliminary study of the zonally-averaged fields similar results were obtained using NCEP, NCEP2 and ERA40 reanalyzes (Bye and Keay, 2006). The resulting fields of H show where tropical cyclones are likely to be generated. Physical arguments suggest that this occurs in regions of large negative H (H< ~-1K-1) where according to the approximate equation, H depends essentially on the spatial gradients of the fields of T and lnE. On the other hand, any tropical disturbance entering a region of large positive H is likely to be spun down.
Comparison with established hurricane indices
The H index is the only hurricane index that considers the complete spin-up/spin-down cycle of the tropical oceans. Its simple formulation, which relies on gradients of field variables, also suggests that it can be used with confidence under global warming conditions. It is emphasized however that the H index predicts regions of potential tropical cyclone development. In this respect it has a similarity with the ocean based components of existing genesis parameters, of which the first, introduced by Gray (1975), relies on sea surface temperature; the second, derived by Royer et al. (1998), depends ultimately on evaporation; and the third, due to Camargo et al. (2007), is determined by both sea surface temperature and evaporation. All these schemes also include an atmosphere-based component in order to predict whether a tropical cyclone will actually occur. This is not included in the present analysis; however, a comparison between the monthly standard deviation of the H index, and the count of tropical cyclones, weighted by their Saffir-Simpson scale, suggests that on a monthly scale, at least, the regions of potential development are a good predictor of actual tropical cyclone occurrence (Bye et al., 2008).
Results for the Caribbean
Hurricane climatology
Figures 1a and b show the mean fields of SST and lnE (for lnE= 2.0, 1.5, 1.0: E= 7.4, 4.5, 2.7mm/day, respectively) averaged over the hurricane season (August, September and October) for the period 1979-2005 over the region (0-30ºN, 105-45ºW). The most notable feature of the SST field, relevant to the hurricane dynamics, is the warm pool in the central Caribbean Sea (Figure 1a). The field of lnE (Figure 1b) shows a tongue of low values extending from Central America into the Caribbean region, and a maximum in evaporation over the south-central North Atlantic Ocean, with a ridge of high evaporation north of Venezuela and another maximum over the Gulf of Mexico.

These two fields give rise to a corridor in the central Caribbean in which H<0, which attains values of H< ~-1K-1 suitable for hurricane intensification (Figure 1c). This corridor begins in the east in the vicinity of the Intertropical Convergence Zone (ITCZ) where tropical storms are initiated, and extends over towards the northern coastline of the Dominican Republic with a southerly branch directed towards Nicaragua. There is also a weaker H<0 region in the south-west North Atlantic Ocean adjacent to Florida. The physics of the initiation region has been extensively discussed in the literature (see Fitzpatrick, 2006). Although there is no clear consensus, the importance of easterly waves originating in North Africa and propagating into the Caribbean region in the easterly wind field is generally acknowledged. These waves are amplified by the presence of rising air from cloudy regions of relatively high SST and low evaporation, and sinking air over cloud-free regions of relatively low SST and high evaporation, which supply the convergences and divergences in their structure. The signature of this circuit is the corridor of H<0 shown in our analysis. It appears therefore that the structure of the region, which is conducive to hurricane formation, is set up by the integrated effect of the easterly waves.
On the other hand, south of this corridor a region in which H>0 occurs all along the coastline of Venezuela and Colombia extending northward into the Caribbean. This protective region is maintained by the ridge of high evaporation, which occurs approximately along 14ºN, such that to the south there exists a region of decreasing SST and evaporation, which gives rise to conditions in which any tropical disturbance would tend to be spun down. This regime appears to be brought about by the subsidence associated with the North Atlantic subtropical high enhanced by the inclined barrier of the coastal cordillera of Venezuela, which strengthens the trade wind circulation, and gives rise to a relatively dry low level circulation (or desert wind) extending out over the adjacent ocean (Snow, 1976).
The hurricane seasons of 2005 and 1983
There are of course active and quiet hurricane seasons. Examples of the H field averaged over the hurricane season for the extreme years 2005 and 1983 are shown in Figures 2a and b. The vigorous 2005 hurricane season is a recent memory during which a very well defined hurricane corridor occurred, extending to the north of Cuba into the Gulf of Mexico. It is also clear that the protective region of positive H (in which tropical cyclones would tend to be spun down) along the Venezuelan coastline is still a strong feature (Figure 2a). During August to October, three major (Category 5) hurricanes (Katrina, Rita and Wilma) developed. The best track analysis presented on the website, http://weather.unisys.com/hurricane/ shows that Katrina began in a convective system to the north of Cuba at 23ºN, 75ºW and Rita was formed from a convective system north of the Dominican Republic at 22ºN, 70ºW. Both these regions occur in intense blue regions in Figure 2a, where the H-index indicates that tropical cyclones are likely to be generated. Once initiated, these two hurricanes tracked westward into the Gulf of Mexico, and rapidly intensified in separate blue regions in the eastern Gulf of Mexico. Wilma originated in a convective system south-west of Jamaica at 18ºN, 79º, which occurred in an extended east-west blue region, and subsequently it rapidly deepened in an intense blue region east of the Yucatan Peninsula, before tracking into the Atlantic Ocean east of Florida. The overall impression is that during the 2005 season, the structure of the H field has intensified relative to the mean structure (Figure 1c), i.e. the standard deviation of H has increased, however the positive and negative regions occur in similar locations.
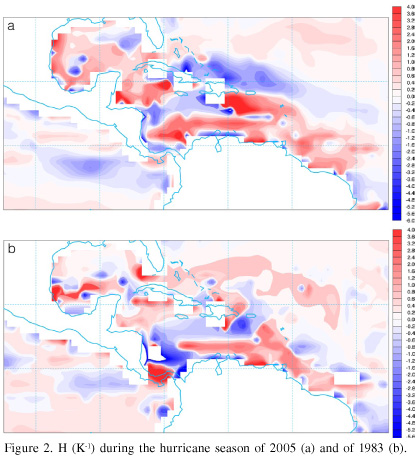
In the 1983 season, on the other hand, no major hurricanes were observed (Pielke, 1990; http://weather.unisys.com/hurricane/). This is evident from Figure 2b in which red regions (indicating regions of tropical cyclone decay) tend to replace the blue regions of 2005, especially to the north and south of Cuba. It is also notable that in the open ocean to the east of Puerto Rico, the regions of positive and negative H are reversed between the two years, such that the blue (favorable) region is terminated by the island chain in 1983, whereas in 2005 it extends along each side.
Large scale patterns
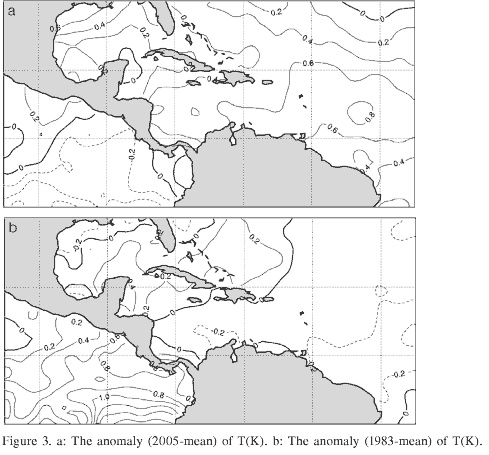
We now briefly examine the large scale physical processes which underly the patterns described above. Figures 3a and b show that the main difference between the 2005 and 1983 season is that the dipole field of SST anomaly (of amplitude ~0.5ºC) is reversed: in 2005 a warm anomaly exists in the south-central North Atlantic Ocean and a cool anomaly in the Pacific Ocean, with a tongue of anomalously cool water extending from the Yucatan Peninsula as far as Cuba and Haiti, whereas in 1983 a warm anomaly exists in the Pacific Ocean and extends into the Caribbean Sea as far as the Bahamas, with a cool anomaly in the central North Atlantic Ocean. The mean SST for the region in 1983 was 28.26ºC, and in 2005 was 28.39ºC. This small difference is very unlikely to explain the difference between the two hurricane seasons, neither is the temperature anomaly in 2005 (relative to 1979-2005) of 0.27ºC, which may possibly be attributed to global warming (see Santer et al., 2006).
The fields of anomaly of evaporation (Figures 4a and b) also differ between the two years. Especially notable in 2005 is a strong negative anomaly extending from eastern Cuba through to Puerto Rico (with a core reduction of about 1mm/day), whereas in 1983 the evaporation anomaly in this region is positive.

The scenario that emerges from these anomaly plots, is as follows. A vigorous hurricane season is characterized by a positive SST anomaly and a negative evaporation anomaly in the south-central North Atlantic Ocean, conducive to the amplification of easterly waves. Further west, adjacent to the Yucatan Peninsula, the anomaly pattern reverses with predominately negative SST anomalies and positive evaporation anomalies. These anomalies (which reflect a tendency for relatively cloudy conditions to the east and cloud-free conditions to the west) both give rise to a well-defined region of negative H, which is crucial for the hurricane intensification mechanism. It is interesting that this region straddles the island chain, although it is more developed on its northern flank.
Variability of hurricane occurrence during the historical record and under global warming
The results presented in Bye et al (2008) compare the variation in the monthly standard deviation of H in the tropical cyclone generation region of the Atlantic Ocean (10-25ºN, 90-30ºW) and the count of tropical cyclones, weighted by their Saffir-Simpson scale, derived from the track data on the website http://weather.unisys.com/hurricane/ over the 27 year period 1979-2006. It was found that the regression coefficient for the monthly average weighted count versus the monthly average standard deviation of H was 0.75, while the correlation coefficient between the observed and the simulated monthly time series was 0.53. Of particular note was that the minimum in tropical cyclone activity in the Caribbean between 1990 and 1995 and also the inter-monthly signal in later years (except for 2006) was well represented. We suggest that the discrepancies between the observations and the simulation may be due to the influence of differences in structure of the H fields of similar standard deviation. Good examples of this variability are shown in Figures 2a and b).
On the basis of this encouraging comparison between observations and theory for the historical period 1979-2005, the hurricane index (H) was also computed from simulations of the CSIRO Mk3 coupled climate model for the two epochs 1961-1990 and 2051-2080 (Bye et al., 2008). On calibrating the results for the earlier period (1961-1990) using the historical data for 1979-2005, and using this calibration for the future period 2051-2080 it was found that a significant pattern of climate change emerges in which the hurricane season is lengthened to include an early season maximum in June and a late season extended maximum in September-October. The monthly averaged tropical cyclone counts at these two maxima are similar to the contemporary single maximum count in September.
This study illustrates that the H index, when evaluated from the large-scale surface fields of climate models, can yield detailed predictions of hurricane occurrence. However, it is emphasized that these predictions rely on the excellence of the climate model.
Conclusion
The results of applying a simple index (H) for hurricane development in the Caribbean region have been presented. The anomalous conditions, which control this index, in particular the dipole field of SST, are easily monitored and form a means of predicting the likely changes in the hurricane season under global warming. The index (H) also clearly demonstrates why Venezuela and Colombia are shielded from hurricane impact.
Acknowledgements
The authors are grateful to Lelys Bravo, Universidad Simon Bolivar, Caracas, Venezuela, for suggesting this study.
References
1. Bye JAT, Keay K (2006) A global relation for tropical cyclone development. Proc. 8th Int. Conf. on Southern Hemisphere Meteorology and Oceanography. American Meteorological Society. April 24-28, 2006. Foz do Iguasú, Brazil. [ Links ]
2. Bye JAT, Cai W, Cowan T (2008) A new index for tropical cyclone development derived from sea surface temperature and evaporation fields In Elsner J, Jagger T (Eds.) Hurricanes and Climate Change. Springer. New York, USA. (in press). [ Links ]
3. Byers HR (1974) General Meteorology. 4th ed. McGraw-Hill. New York, USA. 461 pp. [ Links ]
4. Camargo SJ, Emanuel KA, Sobel AH (2007) Use of a genesis potential index to diagnose ENSO effects on tropical cyclone genesis. J. Climate 20: 4819-4834. [ Links ]
5. Elsner JB, Jagger TH (2008) Hurricanes and Climate Change. Springer. New York, USA. (in press). [ Links ]
6. Elsner JB, Kara AB (1999) Hurricanes of the North Atlantic: Climate and society. Oxford University Press. New York, USA. 488 pp [ Links ]
7. Fitzpatrick PJ (2006) Hurricanes. A Reference Handbook. 2nd ed. ABC-CLIO. Santa Barbara, CA, USA. 412 pp. [ Links ]
8. Gray WM (1975) Tropical Cyclone Genesis. Dept. Atmos. Sci. Paper Nº 234. Colorado State University. Ft. Collins, CO, USA. 121 pp. [ Links ]
9. Kalnay E, Kanamitsu M, Kistler R, Collins W, Deaven D, Gandin L, Iredell M, Saha S, White G, Woollen J, Zhu Y, Chelliah M, Ebisusaki W, Higgins W, Janowiak J, Mo KC, Ropelewski C, Wang J, Leetmaa A, Reynolds R, Jenne R, Joseph D (1996) The NCEP/NCAR 40-year reanalysis project. Bull. Am. Meteorol. Soc. 77: 437-471. [ Links ]
10. Pielke RA (1990) The Hurricane. Routledge. London, UK. 228 pp. [ Links ]
11. Rayner NA, Parker DE, Horton EB, Folland CK, Alexander LV, Rowell DP, Kent EC, Kaplan A (2003) Global analyses of sea surface temperature, sea ice, and night marine air temperature since the late nineteenth century. J. Geophys. Res. 108: 4407. [ Links ]
12. Royer J-F, Chauvin F, Timbal B, Araspin B, Grimal D (1998) A GCM study of the impact of greenhouse gas increase on the frequency of occurrence of tropical cyclones. Climatic Change 38: 307-343. [ Links ]
13. Santer BD, Wigley TML, Gleckler PJ, Bonfils C, Wehner MF, AchutaRao K, Barnett TP, Boyle JS, Brüggemann W, Fiorino M, Gillett N, Hansen JE, Jones PD, Klein SA, Meehl GA, Raper SCB, Reynolds RW, Taylor KE, Washington WM (2006) Forced and unforced ocean temperature changes in Atlantic and Pacific tropical cyclone genesis regions. Proc. Natl. Acad. Sci. USA 103: 13905-13910. [ Links ]
14. Snow JW (1976) The climate of Northern South America. In Schwerdtfeger W (Ed.) World Survey of Climatology 12 Climates of Central and South America. Elsevier Amsterdam, Netherlands. pp. 295-403. [ Links ]
