


 Inglés (pdf)
 Articulo en XML
 Referencias del artículo
 Enviar articulo por email
 Citado por SciELO
  Similares en
SciELO
Similares en
SciELO 
 Permalink
INTRODUCTION
Around 294 million persons are chronically infected with the hepatitis B virus (HBV) in the world 1. HBV chronic infection frequently leads to cirrhosis and hepatocellular carcinoma (HCC), with at least 800,000 deaths each year 1. This infection is highly endemic in Sub-Saharan Africa, Asia, and Indigenous populations in the Americas and Oceania 2,3.
HBV belongs to the Hepadnaviridae family. It is a partially double-stranded DNA virus of around 3200 bp. In addition to the virus, viral-like particles also circulate, composed exclusively of the HBV surface antigen (HBsAg) within a non-infectious envelope 4. Up to ten genotypes and several subgenotypes have been described for HBV, with the American genotypes being the most divergent. The tenth HBV genotype J seems to be a recombinant one, and only one sequence is available 5.
A recombinant HBV vaccine has been developed, based on the HBsAg 6. After more than 30 years of worldwide vaccination, viral infection and HCC incidence reduction have been widely demonstrated 6,7. These measures have led the World Health Organization (WHO) to propose a plan for hepatitis elimination by 2030 8. However, nearly 300 million people remain chronically infected, and no effective treatment is currently available.
The functional cure of chronic hepatitis B is defined as HBsAg loss after therapy, which is rarely achieved with the current therapy. Novel agents in development and preexisting ones will probably bring the tools to approach this goal 9. In the last WHO guidelines of March 2024, HBV treatment is recommended for all adults and adolescents (over 12 years old) with chronic hepatitis B if:
Evidence of significant fibrosis
HBV DNA viral loads above 2000 IU/mL and ALT levels exceeding the upper limit of the reference range
Or presence of coinfections, such as HIV, hepatitis C, hepatitis D, or other comorbidities 10.
The determination of the viral load is then of crucial importance for confirmation of viral replication and the monitoring of chronically infected hepatitis B patients. Several commercial assays are available to assess this biomarker, based on real-time PCR or transcription-mediated amplification (TMA), in most of the laboratories from high-income countries. However, this might not be the case in some low-income countries 11.
In-house methods are economical alternatives for those settings where HBV viral load determination might not be widely available commercially. Molecular diagnostic techniques need to take into account the variability of this virus. Portilho et al.12 developed a real-time PCR to determine HBV load. This study aimed to evaluate and optimize this real-time PCR method for determining HBV load.
MATERIALS AND METHODS
Sera from HBV-infected patients
This study was approved by the Bioethical Committee of IVIC (“Biología molecular de virus de hepatitis y el Virus de la Inmunodeficiencia adquirida (VIH) en Venezuela”, December 5, 2024). The sera of patients diagnosed with HBV infection, and who gave informed consent, were kept at -70°C until use. DNA was extracted from sera using the QIAamp Viral DNA Mini Kit (Hilden, Germany) and used in all the other analyses.
HBV PCR and sequencing
Nested PCR was carried out using previously reported primers 58P-1100N and S6- S3as 13. PCR-purified fragments were sent to Macrogen Sequencing Service (Macrogen, Korea) for sequencing. The phylogenetic analysis was performed with MEGA11 software 14.
Viral load determination
According to the manufacturer’s instructions, HBV viral load was determined with Bosphore® Ultra HBV Quantitation/ Detection (Anatolia Geneworks®, Istanbul, Turkey). This test has been used previously by several groups 15-17.
In-house real-time PCR determination
Real-time PCR for HBV was performed according to the protocol suggested by Portilho et al. 12. Additionally, an antisense modified primer was designed for an optimized assay: 5’-GGCCAAAATTCG- CAGTCCCCAACC-3’. Real-time PCR was run in a final volume of 15 µL, containing 6 µL of DNA, 1X PCR buffer, 1 mM MgCl2 , 0.4mM dNTP mixture, 0.23 µM of each primer and probe, 1.75 U Platinum® Taq DNA Polymerase (Thermofisher, USA). The final conditions for the optimized assay were: 95°C for 10 minutes, then 40 cycles at 97°C for 30 seconds, 54°C for 90 seconds, and a hold stage of 32°C for 60 seconds.
Statistical analysis
The correlation between the values of HBV viral load determined by the commercial assay and the in-house method was evaluated with the Pearson´s coefficient 18.
RESULTS
Serum samples from HBV-infected patients were analyzed by a commercial kit and the in-house real-time PCR to evaluate the performance of an in-house real-time PCR. A total of nine sera (and dilutions of them for a total of 14 samples tested) were tested, with variable HBV loads: five sera were classified as HBV genotype F3 (one not shown in the tree, since the sequence was shorter, but it could be classified as F3), and one each as genotype A2, C2, F2, and F4 (Fig. 1).
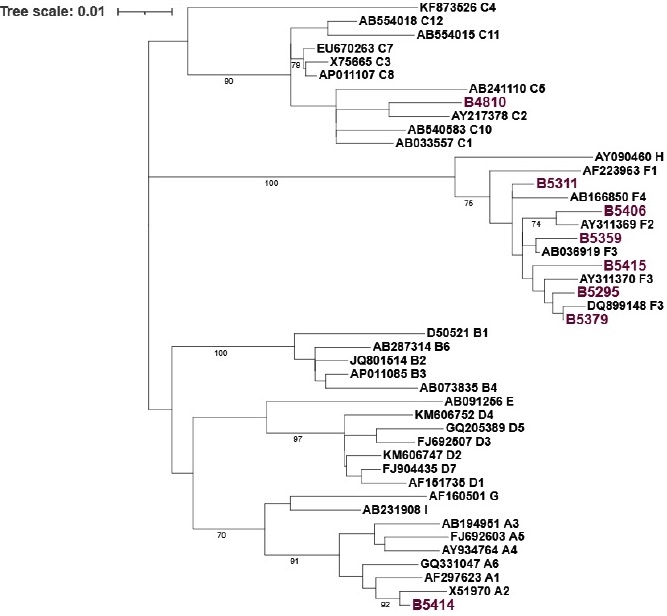
Fig. 1 Phylogenetic tree of the HBV isolates tested in this study. The S gene is analyzed (559 nt). The evolutionary history was inferred using the Maximum Likelihood method and the General Time Reversible model14. The tree with the highest log likelihood (-2602.78) is shown. The percentage of trees in which the associated taxa clustered is shown next to the branches. Initial tree(s) for the heuristic search were obtained by applying the Neighbor-Joining method to a matrix of pairwise distances estimated using the Maximum Composite Likelihood (MCL) approach. A discrete Gamma distribution was used to model evolutionary rate differences among sites (4 categories (+G, parameter = 0.6597)). The rate variation model allowed some sites to be evolutionarily invariable ([+I], 62.58% sites). The tree is drawn to scale, with branch lengths measured in the number of substitutions per site. This analysis involved 45 nucleotide sequences. Codon positions included were 1st+2nd+3rd+Noncoding. All positions with less than 80% site coverage were eliminated, i.e., fewer than 20% alignment gaps, missing data, and ambiguous bases were allowed at any position (partial deletion option). Bootstrap values are shown in the branches of the tree. The isolates are named by their genotype and GenBank accession number, except for the ones from this study (n=8), which are shown in purple. An additional HBV isolate (B02023) was not included in the tree since the shorter sequence could also be classified as genotype F3.
A good agreement was found between the commercial assay and the in-house method for 9/14 samples, but with an overall low correlation of R2=0.47 (Fig. 2A). The samples exhibiting the discrepant results between the two tests were derived from two samples, corresponding to HBV genotype C2 and F3 isolates. When these samples were excluded, the correlation coefficient increased to R2=0.98 (Fig. 2B).
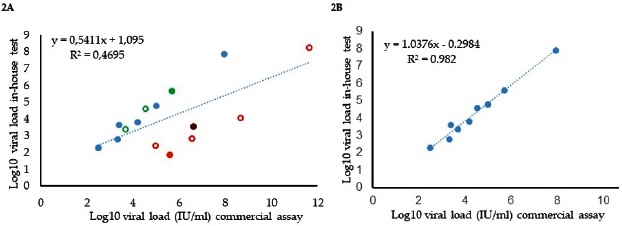
Fig. 2 Correlation between viral load determination with a commercial assay and the in-house method of Portilho et al. 12. 2A. All the samples were tested. Green and open circles represent the dilution of a sample, as shown in the filled green. Orange open circles represent dilution of a synthetic control (amplicon from sample B4810, which is shown in filled orange). 2B. Correlation for samples without discordant results (orange and purple in Fig. 2A, derived from B4810 and B5415, respectively) were omitted.
An alignment of the sequences of the HBV samples for which discrepant results were observed is shown in Fig. 3. The alignment reveals multiple mismatches between the antisense primer and several HBV isolates, absent in the sequences without discrepant results. The mismatches were present, particularly in genotype C isolates.
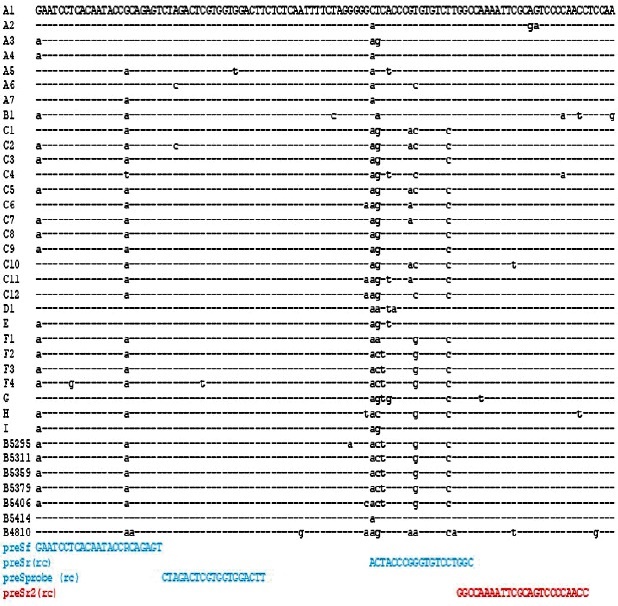
Fig. 3 Sequence alignment of the HBV preS region amplified by the in-house real-time test. Reference sequences are shown with their genotypes. The sequence of the samples used in this study is also included, except for B02023, since the sequence was shorter and does not cover the region. The primers from Portilho et al. 12 for the in-house test are shown in blue. The new modified reverse primer is shown in red. The reverse complement sequences are shown for the reverse primers.
A new antisense primer for an optimized real-time PCR was designed (Fig. 3). The complementarity of the three primers (sense, the new antisense and the probe) was evaluated in a total of 16516 sequences from the HBV database 19, as shown in Table 1. The three primers showed high sequence identity with the analyzed HBV sequences from all the genotypes analyzed: for some sequences, one or two internal mismatches were observed, frequently at the 5´end. These few mismatches per sequence (not at the 3´ end of the primer) may not hamper the adequate performance of the real-time PCR. The probe also demonstrated satisfactory performance. In general, the sequence of this probe was well conserved among all the isolates. The only exceptions might be for the recombinant forms of HBV, for which the mismatches were frequent, particularly with the probe, and for some HBV genotype C sequences.
Table 1 Complementarity of the primers used in the modified in-house method with HBV sequences available in the HBV database.
| HBV genotype | N of sequences | Sequences with divergence1 | ||
|---|---|---|---|---|
| preSf | preSr2 | preSprobe | ||
| A | 2359 | 104 | 48 | 64 |
| B2 | 3534 | 246 | 64 | 68 |
| C3 | 5088 | 386 | 1639 | 160 |
| D4 | 3220 | 399 | 123 | 45 |
| E5 | 894 | 28 | 124 | 17 |
| F5 | 357 | 39 | 4 | 5 |
| G6 | 87 | 2 | 0 | 0 |
| H7 | 48 | 4 | 3 | 0 |
| RF8 | 929 | 237 | 134 | 287 |
| Total (%) | 16516 | 8.85% | 12.95% | 2.34% |
1The complementarity of the primers tested in the new in-house method were analyzed in the 16516 HBV sequences of the HBV database 19. Most of the observed divergences in the complementarity with the primers correspond to only one or two internal mismatches. 2 For preSf and PreSr2, most of the sequences exhibited one mismatch at the 5´end, so this first nt of the primer was not considered in the analysis. 3 Some mismatches were found in the 3´end of the primers: 38 sequences exhibited this mismatch for primer preSf, only 3 for preSr2. 4 One sequence with a mismatch at the 3´end. 5 For preSf primer, most of the sequences exhibited one mismatch at the 5,7´end, so this first nt was not considered in the analysis. 6 All the genotype G isolates have a T instead of an A in the fifth position of the primer preSr2, from 3´to 5´end, so this position was not considered in the analysis. 8 RF: recombinant forms. Many sequences exhibited one or more mismatches, internal or at the 5´end.
Fig. 4 shows the correlation of the optimized in-house real-time PCR with the commercial assay. A strong correlation was observed across all the tested samples, using the new antisense primer, including discrepant samples and their dilutions (R2=0.99, Fig. 4).
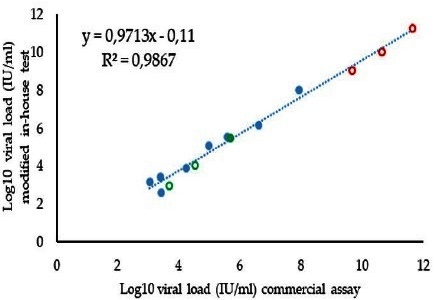
Fig. 4 Correlation between viral load determination with a commercial assay and the optimized in-house method. Dilutions of the sample B4810 (10-1, 10-3, and 10-4) are shown in open orange circles, while sample 5379 and its dilutions (10-1 and 10-2 open circles) are shown in green.
Fig. 5 shows the performance of the in-house test with HBV-positive and negative samples. Most negative samples did not exhibit any signal during the PCR process (40 cycles), although 1/20 negative samples had a cycle threshold (Ct) value of 39.01. The detection limit was fixed at 50 UI/mL (Ct value around 35), which is acceptable for managing HBV-infected patients.
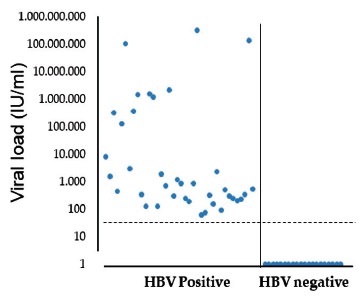
Fig. 5 Performance of the optimized in-house real-time PCR with sera from HBV-infected patients or non-infected with this virus. Ct values of positive (left, 38 samples) and negative (right, 20 samples) HBV samples. The HBV negative samples were samples from six HCV positive, three dengue virus positive, two HIV-1 positive, 1 HAV positive, 1 HEV positive, and six with any known infecting virus.
DISCUSSION
Hepatitis B is still a significant health problem in Venezuela, even if vaccination campaigns may have reduced the burden of this disease, particularly in some indigenous populations, where HBV infection remains highly endemic 20. The most common HBV genotype in Venezuela is F (F3, followed by F2, and less frequently F1 and F4), followed by HBV genotypes with worldwide distribution (A and D) and infrequently the HBV Asian B and C, particularly these last ones in immigrants 13,20. The samples from this study included different subgenotypes circulating in the country, and this diversity was important to assess the performance, particularly in terms of sensitivity, of the real-time PCR test analyzed.
A low correlation was observed between the commercial assay and the original in-house primers proposed by Portilho et al. 12. This finding contrasts with their analysis of 40 serum samples, where a good correlation with the commercial assay was observed 12. However, the authors did not mention the genotype of their samples.
Although HBV is a DNA virus, it displays a level of variability intermediate between RNA and DNA viruses. The dependence of a reverse transcriptase for its replication, which lacks proof-reading activity, increases the mutation rate of this virus. In contrast, the highly compact genome (one of the smallest animal DNA genomes), with a high degree of overlap in the different open reading frames, reduces the viability of some of these mutations. The result is an intermediate mutation rate, compared to a DNA and an RNA virus 20. The variability exhibited by different HBV genotypes leads to differential pathogenesis and variable resistance to IFN treatment 21. In addition, the accuracy of primers in PCR reactions is always limited.
In this study, analyzing more than 16,500 sequences to evaluate the suitability of the new proposed primers suggests that we can be confident in using those modified primers. The only exception might be the recombinant isolates (and some genotype C isolates), although we could not test any recombinant isolates. Recombination is a common phenomenon in HBV 22,23. Infection with some HBV genotypes has been associated with a more severe disease and more rapid progression to HCC, for example, infection with HBV genotype C: the relationship between HBV recombinant genotypes and pathogenesis is unknown at present 20,21. The recombinant forms, in any case, may affect the sensitivity of molecular diagnostic techniques.
In conclusion, modifying the HBVpreS reverse primer significantly improved the correlation of the viral load determination by the in-house method, with the commercial assay, increasing then the performance of this test. The new version of the in-house test displayed a satisfactory sensitivity and specificity, allowing its use for monitoring patients in low-income settings. A limitation of this study is the relatively low number of samples evaluated by the commercial assay and the in-house test. The in-house test tested a higher number of samples (n=38 positive samples, and 20 negative, the last ones without any signal). In addition, the in silico validation of the assay with more than 16,000 sequences makes us confident in the performance of the optimized test.

