


Servicios Personalizados
Revista
Articulo
 Articulo en XML
 Referencias del artículo
 Enviar articulo por email
Indicadores
-
 Citado por SciELO
 -
 Accesos
Links relacionados
-
 Similares en
SciELO
Similares en
SciELO
Compartir

 Permalink
Archivos Latinoamericanos de Nutrición
versión impresa ISSN 0004-0622versión On-line ISSN 2309-5806
ALAN v.53 n.3 Caracas set. 2003
Interactions Among Indicators of B1, B2, B6 and Vitamin C Status in University Students.
Avila AV, Liuzzi JP, Cioccia AM and Hevia P
Escuela de Nutrición y Dietética, Universidad Central de Venezuela, Caracas. Venezuela.
Universidad Simón Bolívar, Caracas Venezuela
SUMMARY: In 209 young university students (109 males and 80 females) with body mass index within the normal range, the activation coefficient of the erythrocyte transketolase (ETKAC) glutathione reductase (EGRAC) and aspartate amino transferase (EASTAC) as well as the circulating levels of vitamin C were determined. Using the usual cutoff points for ETKAC and serum vitamin C and higher than usual cutoff points for EASTAC and EGRAC 99, 95, 92, and 87% of the study subjects exhibited activation coefficients which were compatible with an acceptable status for vitamin B2, B6, C and B1 respectively. A correlation analysis showed a high correlation (r = 0.81) between erythrocyte indicators of B1 and B2 status a lower correlation between indicators of the status of these vitamins and B6 and no correlation between the indicators of B1, B2 and B6 status and serum vitamin C. This study indicated that in this largely nutritionally adequate population, the activation coefficient of the erythrocyte enzymes used here as markers of the nutritional status of B1, B2 and B6 were related between themselves and varied in the same direction. These changes, however, were not associated with circulating levels of vitamin C.
Key words: B1, B2, B6, vitamin C, ETKAC,EASTAC,EGRAC, interactions.
RESUMEN: Relaciones entre indicadores del estado nutricional de las vitaminas B1, B2, B6, y C en una población de estudiantes universitarios. Los niveles séricos de vitamin C y los coeficientes de activación de las enzimas eritrocitarias: transcetolasa (ETKAC), glutation reductasa (EGRAC), y aspartato amino transferasa (EASTAC) se midieron en una muestra de 209 estudiantes universitarios (109 hombres y 80 mujeres) que presentaban índices de masa corporal dentro de los niveles normales. Usando los puntos de corte habituales para la vitamina C y ETKAC así como puntos de corte mayores que lo habitual para EASTAC y EGRAC 99, 95, 92 y 87% de los estudiantes mostraron valores dentro de la normalidad para las vitaminas B2, B6, C y B1 respectivamente. Un estudio de correlación, mostró una alta correlación entre los indicadores eritrocitartios de las vitaminas B1 y B2 (r = 0.81), una correlación intermedia entre los indicadores de estas vitaminas y el de la vitamina B6 y ninguno de estos indicadores correlacionó con los niveles séricos de la vitamina C. En general, este estudio muestra que en esta población de individuos esencialmente normales, los indicadores eritrocitarios del estado nutricional de las vitaminas B1, B2 y B6 mostraron una correlacion entre ellos y cambiaron en la misma dirección. En contraste, el estado nutricional de estas vitaminas del complejo B no se correlacionaron con los niveles séricos de la vitamina C.
Palabras claves : B1, B2, B6, Vitamina C, ETKAC, EASTAC,EGRAC, interacciones.
Recibido: 21-07-2002 Aceptado: 28-02-2003
INTRODUCTION
During the last decades a new concept has evolved concerning with micronutrient requirements. Currently it is accepted that the optimal intake of vitamins and minerals should include not only the amount necessary for preventing the clinical signs of deficiency but also to promote health benefits (1), primarily associated with the prevention of chronic diseases such as cancer, cardiovascular diseases (2), cataracts (3), joint inflammation and arthritis (4). This new role of the micronutrients emphasizes the utility of maintaining, throughout the whole life cycle, an optimal nutritional status for the prevention of these diseases whose symptoms are seen at maturity and old age.
The majority of the benefits offered by the micronutrients "beyond deficiency" is thought to be related to the function of vitamins and minerals as well as other compounds present mainly in fruits and vegetables as potential antioxidants (5). Among the essential vitamins, vitamin C, vitamin E and the carotenes with pro vitamin A activity are considered to be antioxidants (6). Additionally, niacin, riboflavin and thiamin are involved in antioxidant sparing and vitamin C regeneration. This is so because one way of achieving this regeneration is through the oxidation of glutathione which in turn can be reduced in the FAD dependent-glutathione reductase system (7). The NADPH required by this system is generated mainly in the pentose phosphate shunt which includes thiamin dependent-transketolases (8). Therefore, these B vitamins may also contribute in maintaining antioxidant capacity in mammalian organisms as it has been already showed by others in the case of niacin (9).
In this study, indicators of the nutritional status of vitamin C, thiamin, riboflavin and pyridoxine were determined in a sample of university students. The purpose of this, was on the one hand to identify potential deficiencies of these vitamins in the students and on the other hand to look for possible interactions among the indicators of the four water soluble vitamins studied here.
The indicators of the status of B1, B2 and B6 used in this study were the activation coefficient of erythrocyte tranketolase (ETKAC), glutathione reductase (EGRAC), and aspartate amino transferase (EASTAC). The serum levels of vitamin C was used as an indicator of vitamin C status.
SUBJECTS AND METHODS
The studied population included 209 young university students randomly selected from the different undergraduate programs offered by the Universidad Simón Bolívar in Caracas city. The students gave their written consent of participation before entering the study.
After measuring weight and height (Stadiometer Holtain-Limit. UK. Scale Detecto. Spain), a 12 h fast blood sample was drawn into evacuated tubes containing EDTA. Within 1h of collection, samples were centrifuged at 3000xg for 8-10 min at 4° C, plasma and buffy coat were removed and the remaining red cells frozen and stored at - 20° C until analyzed. The erythrocyte activities of the enzymes aspartate amino transferase (AST, EC 2.6.1.2), transketolase (ETK, EC 2.2.1.1) and glutathione reductase (EGR, EC1.6.4.2) as well as their coefficient of activation with pyridoxal-5-phosphate (PLP), thiamin pyrophosphate (TPP) and riboflavin (FAD) were determined as indicators of the nutritional status of B6, B1 and B2 respectively. The conditions for determining these enzymes were those reported by Bayoumi and Rosalki (10). Since the activity of these enzymes is expressed in terms of the hemoglobin content of samples of red cell hemolizates, hemoglobin was determined by the cyanmethemoglobin method (11). In the same subjects, serum ascorbic acid was determined using 2,4-dinitrophenylhydrazine (12).
The population data are presented as means and standard deviation. Cases found to differ from the guidelines used to determine nutritional status for the studied vitamins were expressed as a percent of the total population. Differences between males and females were established using the Student´s t-test at 5%. Correlation and regression analysis were used to determine relationships between variables. The BMDP Statistical Software was used in all cases (13).
RESULTS
Table 1 data shows that the university students studied here, independent of their sex, were slightly older than twenty years. Within the group, there were more males than females and the males were heavier, taller and had a higher body mass index than the female subjects.
Study subjects grouped by sex.
| Population | Males | Females | |
| Age (y) | 20.5 ± 2.4 1 | 20.8 ± 2.47 | 20.2 ± 2.2 |
| Weight (Kg) | 61.6 ± 12.9 | 69.8 ± 12.9 * | 53.33 ± 7.54 |
| Height (cm) | 168.3 ± 9.5 | 175.5 ± 6.7 * | 161.0 ± 5.5 |
| BMI 2 | 21.7 ± 3.8 | 22.7 ± 3.6 | 20.6 ± 4.3 |
| n 3 | 209 | 129 | 80 |
1. Means ± SD. 2. Body mass index. 3 Number of subjects. * Different from the females p<0.05.
The data in Table 2 show the mean activation coefficients found in single samples of erythrocytes obtained from the 129 young males and from the 80 young females under study. As shown in the Table, the three enzymes measured were stimulated by the in vitro addition of their coenzymes. Also, this activation was slightly but significantly higher in the females. Since the higher the activation coefficient of these enzymes by their coenzymes the greater the degree of vitamin deficiency (14), the data in Table 2 suggest that the male group featured a slightly better status of the vitamins B6, B2 and B1 than the female group. Table 2 also shows that the females had higher circulating levels of vitamin C.
Activation Coefficient1 (AC) of the erythrocyte Aspartate Amino Transferase (EASTAC), Glutathione Reductase (EGRAC)and Transketolase (ETKAC) enzymes and serum vitamin C levels in the study subjects.
| Population | Males | Females | |
| EASTAC | 1.75 ± 0.16 2 | 1.74 ± 0.17 | 1.78 ± 0.16* |
| EGRAC | 1.21 ± 0.07 | 1.20 ± 0.06 | 1.23 ± 0.08* |
| ETKAC | 1.11 ± 0.04 | 1.10 ± 0.03 | 1.13 ± 0.04* |
| Vitamin C (m moles/L) | 38.04 ± 11.92 | 36.34 ± 10.79 | 42.02 ± 12.49* |
| n 3 | 209 | 129 | 80 |
1. Enzyme activity with additional coenzyme/Enzyme activity without additional coenzyme. 2. Means ± SD. 3. Number of subjects. * Different from the males p<0.05. EASTAC, EGRAC and ETK were used as indices of B6, B2 and B1 status respectively.
Table 3 information indicates the number of male and female subjects whose indices fell within the acceptable, marginal and deficient range for each of the four water soluble vitamins studied here. Since this study included more males, Table 3 also shows the percentage of males and females found in the same categories for B6, B2, B1 and Vitamin C. The results showed that using the cutoff points indicated in the table, the majority of the subjects independent of their sex were in the acceptable range for all these vitamins. In addition, the results showed that there were no males with a marginal or deficient index of B2 status, only 2.3% of them showed a marginal index for B6 status and slightly more than 7 and 8% had low indices for B1 and vitamin C status respectively. In the case of the females, only a very low fraction of the population showed indices of a marginal B2 status but the fraction of the population with marginal indices for B1 and B6 was approximately three times higher than that found in the male population. In contrast with the lower B vitamin status found in the females, low circulating levels of vitamin C were equally frequent in males and females.
Subjects with activation coefficients1 (AC) for erythrocyte Aspartate Amino Transferase (EASTAC), Glutathione Reductase (EGRAC) and Transketolase (ETKAC) enzymes and serum vitamin C levels in the acceptable, marginal and deficient range.
| Population | Males | Females | ||||
| Subjects | % | Subjects | % | Subjects | % | |
| EASTAC | ||||||
| Acceptable | 199 | 95.22 | 126 | 97.7 | 74 | 92.50 |
| Marginal (>2.0)2 | 10 | 4.78 | 4 | 2.33 | 6 | 7.50 |
| Deficient | 0 | 0 | 0 | 0 | 0 | 0 |
| EGRAC | ||||||
| Acceptable | 207 | 99.04 | 129 | 100 | 78 | 97.50 |
| Marginal (>1.4)3 | 2 | 0.96 | 0 | 0 | 2 | 2.50 |
| Deficient | 0 | 0 | 0 | 0 | 0 | 0 |
| ETKAC | ||||||
| Acceptable | 181 | 86.60 | 119 | 92.25 | 62 | 77.50 |
| Marginal (>1.15)4 | 26 | 12.44 | 10 | 7.75 | 16 | 20.00 |
| Deficient (>1.24)4 | 2 | 0.96 | 0 | 0 | 2 | 2.50 |
| Vitamin C | ||||||
| Acceptable | 192 | 91.87 | 118 | 91.47 | 74 | 92.50 |
| Marginal (<23)5 | 15 | 7.18 | 9 | 6.98 | 6 | 7.50 |
| Deficient (<11)5 | 2 | 0.96 | 2 | 1.55 | 0 | 0 |
| n 6 | 209 | 100 | 129 | 100 | 80 | 100 |
1.Activation coeficient = Enzyme activity with additional coenzyme/ Enzyme activity without additional coenzyme. 2. Value indicating inadequate status according to Sauberlich et al. (18). 3.Value indicating inadequate status according to Bates et al (19) and Boisvert et al (20). 4. Value indicating inadequate status according to Gibson (14) and Sauberlich (15). 5. (m moles/L) Value indicating inadequate status according to Jacobs et al (27). 6. Number of subjects.
Table 4 summarizes the correlation coefficients found between the activation coefficient of erythrocyte aspartate amino transferase, transketolase and glutathione reductase used here as indicators of B6, B1 and B2 status respectively and also between these activation coefficients and the serum levels of vitamin C. The data show that in this sample of young, largely nutritionally adequate students, those having indices of a low B1 or B2 status, had also a tendency to show indices of a low B6 status. However, none of these B vitamin indices, correlated with serum vitamin C. In addition, Table 4 shows a very high correlation between the indexes of B1 and B2 status both in the males and the females.
PEARSON CORRELATION COEFFICIENTS BETWEEN ERYTHROCYTE FUNCTIONAL INDICATORS OF B1, B2, B6 1STATUS AND SERUM VITAMIN C IN THE STUDY SUBJECTS.
| Nutrient | Population | Males | Females |
| B1 vs B2 | 0.81* | 0.75* | 0.85* |
| B1 vs B6 | 0.43* | 0.36* | 0.49* |
| B2 vs B6 | 0.29* | 0.15 | 0.45* |
| B1 vs Vit C | 0.11 | -0.04 | 0.15 |
| B2 vs Vit C | -0.07 | -0.15 | -0.03 |
| B6 vs Vit C | 0.04 | -0.07 | 0.06 |
1. For B1 ETKAC, for B2 EGRAC and for B6 EASTAC. * P< 0.001
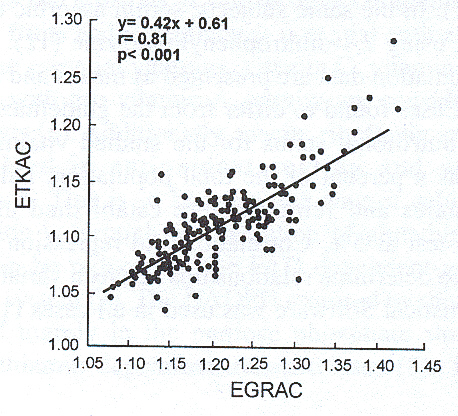
In accordance with the data on Table 4, Figure 1 shows the linear regression line calculated from the activation coefficient of the transketolase and glutathione reductase, measured in the erythrocyte samples, of all the subjects included in this study. The figure indicates that subjects showing a low ETKAC also had a low EGRAC. Conversely, subjects having a high ETKAC also had a high EGRAC.
Relationship between the activation coefficient of the erythrocyte glutathione reductase (EGRAC) and transketolase (ETKAC) in 209 young university students.
DISCUSSION
The studied population included a group of young university students without any obvious sign of nutritional deficiencies. The group was quite homogeneous in terms of age, had more males and their calculated body mass index were in the normal range (14).
In the study group, the activation coefficient of the erythrocyte aspartate amino transferase , glutathione reductase and transketolase were determined. These coefficients are considered functional assays for the status of B6, B2 and B1 respectively (14) and they have been used in the screening for deficiencies of these vitamins both in normal populations (14-15) and also in detecting and correcting B vitamin deficiencies occurring spontaneously in different parts of the world (16-17).
Cutoff points for the interpretation of the activation coefficients of these erythrocyte enzymes have recently been reviewed (14,15) and, the literature shows a good agreement in the case of the transketolase but not for the aspartate amino transferase or glutathione reductase. Accordingly, different investigators (18-21) have used different values to represent acceptable, marginal or deficient status of B6 and B2 in the populations they have studied. In this study, the values used for the transketolase assay are those reported by Sauberlich (15) and Gibson (14). However, the values used for the activation of aspartate amino transferase and glutathione reductase were considerably higher and similar to those recommended by Sauberlich (18) and Bates et al (19) as well as Boisvert et al (20) respectively. Using these cutoff points the mean values for the activation coefficient of the enzymes studied here fell well within the acceptable range both in the males and in the female students.
The decision to use higher activation coefficients for these two enzymes was made since there were no obvious signs of nutritional deficiencies in any of the subjects. In other populations with no signs of deficiency, activation coefficients higher than those established as the upper limit of normality (14-15) have also been used for the three enzymes measured in this study (18-26). These discrepancies limit the value of using these enzymes in predicting vitamin status.
As described by Sauberlich (15), the guidelines for interpreting vitamin C status, from serum vitamin C levels has also been a matter of debate with acceptable levels ranging from 11-34 mm mol/L. In this study we used 23 mm mol/L based on the work of Jacob et al (27). Using this value, it appears that on the average, the study subjects had an appropriate status for this water soluble vitamin. The higher circulating levels of vitamin C found here for the females has also been reported by others (27,28).
This interpretation of the data suggested that in general, the population as a whole as well as the males and females studied here had acceptable indices for B1, B2, B6 and vitamin C. However, there were a few subjects with marginal or deficient indices for some of these vitamins. In general, the fraction of the subjects within the acceptable range was much higher than that within a marginal or deficient range and, among those in the latter group, there were more females than males. After comparing the percentage of the subjects showing low B vitamin indices in this study with those found in non-supplemented healthy subjects in other studies (21), it appears that the incidence of marginal indices for the three B vitamins in this population, fell well within a reasonable range. The incidence of low serum vitamin C levels, found in this study, is similar to previous studies reported by us in an older population (28).
The results of the correlation analysis performed here on EASTAC, EGRAC and ETKAC showed a direct relationship between the activation coefficient for the three enzymes. The strongest of these relationships was seen between EGRAC and ETKAC. The relationship between ETKAC and EASTAC was intermediate and the lowest was seen between EGRAC and EATAC.
A certain degree of agreement between indicators of nutritional status for various nutrients, like those seen in this study for B1 and B6 or B2 and B6 erythrocyte dependent enzymes, may be expected. This agreement may result from coincidences of the same nutrients in the foods consumed or due to biochemical relationships between them. However, a relationship as high as that seen here for the erythrocyte B1 and B2 dependent enzymes was unexpected. Thus, riboflavin and thiamin are not present in the same foods (29-30) and neither riboflavin nor thiamin are required in the synthesis or interconversions of the active thiamin coenzymes (29) or the flavin nucleotides (30). Nevertheless, since in the erythrocyte the utilization of glucose in the pentose phosphate shunt as well as the capacity of reducing glutathione are critical in maintaining integrity and function (31), it is possible that in this cell the enzymes of these two systems, namely the B1 dependent transketolases and the B2 dependent glutathione reductase, may be related.
In contrast to the strong relationship between the indicators of B1 and B2 status just described, these results showed that there was no relationship between the level of vitamin C measured in the serum and the activation coefficient of any of the B vitamin dependent enzymes measured in the erythrocytes of the same individuals. It is possible that a more complete assessment of the status of B1, B2 and vitamin C, together with a larger variability in the nutritional status of these vitamins in the subjects, may be needed to show a relationship between these two B vitamins and vitamin C.
REFERENCES
2. Krebs-Smith SM and Kantor LS. Choose a variety of fruits and vegetables daily: Understanding the complexities. J Nutr 2001;131:487S-501S. [ Links ]
3. Lyle BJ, Mares-Perlman JA, Klein BEK, Klein R, Palta M, Bowen PE and Greger JL. Serum carotenoids and tocopherols and incidence of aged-related nuclear cataracts. Amer J Clin Nutr 1999;69:272-277. [ Links ]
4. Darlington LG and Stone TW. Antioxidants and fatty acids in the amelioration of rheumatoid arthritis and related disorders. Brit J Nutr 2001;85:251-269. [ Links ]
5. Byers T and Guerrero N. Epidemiological evidence for vitamin C and Vitamin E in cancer prevention. Amer J Clin Nutr 1995;62:1385S-1392S. [ Links ]
6. Sies H, Stahl W and Sundquist A. Antioxidant functions of vitamins: Vitamins E and C, Beta-Carotene and other Carotenoids. In: Beyond Deficiency. New Views on the Function and Health Effects of Vitamins. Annals of the New York Academy of Sciences 669 pp. 7-20, 1992. [ Links ]
7. Sen ChK and Packer L. Thiol homeostasis and supplements in physical excercise. Amer J Clin Nutr 2000;72:653S-659S. [ Links ]
8. Schwartz NB. Carbohydrate Metabolism II. Special pathways and glycoconjugates. In: Textbook of Biochemistry with Clinical Correlations (Devlin TM. ed). pp. 665-691, Wiley & Sons, New York, 2002. [ Links ]
9. Melo SS, Arantes MR, Meirelles MS, Jordao AA Jr. and Vannucchi, H. Lipid peroxidation in nicotinamide-supplemented rats with stretozotocin-induced diabetes. Acta Diabetol 2000;37:33-39. [ Links ]
10. Bayomi RA and Rosalki SB. Evaluation of methods of coenzyme activation of erythrocyte enzymes for detection of deficiency of vitamins B1, B2 and B6 in the human. Clin Chem 1976;22:327-335. [ Links ]
11. Drabkin DL and Austin JH. Spectrophotometric studies: spectrophotometric constants for common hemoglobin derivatives in human, dog and rabbit blood. J Biol Chem 1932;98:719-733. [ Links ]
12. Omaye ST, Turnbull JD and Sauberlich HE. Selected methods for the determination of ascorbic acid in animal cells, tissues and fluids. In: Methods in Enzymology (McCormick DB, Wright LD de) 62:3-11, 1979. [ Links ]
13. Dixon WJ, Brown MB, Engelman L and Jennrich RY. BMDP Statistical Software Manual. University of California, 1990. [ Links ]
14. Gibson RS. Principles of Nutritional Assessment. Oxford University Press. Oxford, 1990. [ Links ]
15. Sauberlich HE. Laboratory Tests for the Assessment of Nutritional Status. CRC Press. Boca Raton, 1999. [ Links ]
16. Macias-Matos C, Rodriguez-Ojeda A, Chi N, Jiménez S, Zuleta D and Bates CJ. Biochemical evidence of thiamine depletion during the Cuban neuropathy epidemic, 1992-1993. Amer J Clin Nutr 1996;64:347-353. [ Links ]
17. Bates CJ, Phil D, Prentice AM, Paul AA, Sutcliffe BA, Watkinson M and Whitehead RG. Riboflavin status in Gambian pregnant and lactating women and its implications for recommended dietary allowances. Amer J Clin Nutr 1951;34:928-935. [ Links ]
18. Sauberlich HE, Canham JE, Baker EM, Raica N and Herman YF. Biochemical assessment of the nutritional status of vitamin B-6 in the human. Amer J Clin Nutr 1972;25:629-642. [ Links ]
19. Bates JC, Powers HJ, Downes R, Brubachere D, Sutcliffe V and Thurnill A. Riboflavin status of adolescent vs elderly Gambian subjects before and during supplementation. Amer J Clin Nutr 1989;50:825-829. [ Links ]
20. Boisvert WA, Mendoza I, Castaneda C, De Portocarrero L, Solomons NW, Gershoff SN and Russell R. Riboflavin requirements of healthy elderly humans and its relationship to macronutrient composition of the diet. J Nutr 1993;123:915-925. [ Links ]
21. Manore MM. Effect of physical activity on thiamine, riboflavin and vitamin B-6 requirements. Amer J Clin Nutr 2000;72:598S-606S. [ Links ]
22. Van der Beek EJ, Van Dokkum W, Schrijver J, Wedel M, Gaillard AWK, Wesstra A, Van de Weerd H and Hermus RJJ. Thiamin, riboflavin, and vitamins B-6 and C: impact of combined restricted intake on functional performance in man. Amer J Clin Nutr 1988;48:1451-1452. [ Links ]
23. Fu-Liu CS, Fujitaki C and Lewis JS. Riboflavin status: Dietary intake, urinary excretion, and erythrocyte glutathione reductase coefficient activity of female university students. Nutr Res 1986;6:601-608. [ Links ]
24. Booth CK, Clark T and Fenn A. Folic acid, Riboflavin and B-6 status of a group of first time blood donors. Amer J Clin Nutr 1998;68:1075-1080. [ Links ]
25. Madigan Sh, Tracey F, McNulty H, Eato-Evans J, Coulter J, McCartney H and Strain JJ. Riboflavin and vitamin B-6 intakes and status and biochemical responses to riboflavin supplementation in free-living elderly people. Amer J Clin Nutr 1998;68:389-395. [ Links ]
26. Bailey AL, Finglas PM, Wright AJA and Southo S. Thiamin intake, erythrocyte (EC 2.2.1.1) activity and total erythrocyte thiamin in adolescents. Brit J Nutr 1993;72:111-125. [ Links ]
27. Jacob RS, Skala JH, Omaye ST and Hevia P. Biochemical methods for assessing vitamin C status of the individual. In: Nutritional Status Assessment of the IndividuaL. (Livingston, G.E.,ed.) pp. 323-337, Food and Nutrition Press, New York, 1989. [ Links ]
28. Hevia P, Mella C, Cioccia AM, Carías D, Avila AV, and Arciniegas EL. Lipidos séricos y niveles de las vitaminas A,C y E en una población adulta de Caracas. Arch Latinoam Nutr 1998;48:112-121. [ Links ]
29. Rivlin RS and Pinto JT. Riboflavin (Vitamin B2). In: Handbook of Vitamins. (Rucker RB, Suttie JW, McCormick DB and Machlin LJ, eds.) pp. 255-273, Marcel Dekker Inc., New York, 2001. [ Links ]
30. Tanphaichitr V. Thiamin. In: Handbook of Vitamins. (Rucker RB, Suttie JW, McCormick DB and Machlin LJ, eds.) pp. 275-316, Marcel Dekker Inc., New York, 2001. [ Links ]
31. Harris RA. Carbohydrate metabolism. Major metabolic pathways and their control. In: Textbook of Biochemistry with Clinical Correlations (Devlin, T.M. ed.) pp. 597-664, Wiley & Sons, New York, 2002. [ Links ]

