


 Inglés (pdf)
 Articulo en XML
 Referencias del artículo
 Enviar articulo por email
 Citado por SciELO
  Similares en
SciELO
Similares en
SciELO 
 Permalink
Introduction
Alzheimer's disease (AD) is the most common neurodegenerative disorder and is clinically associated with cognitive impairment, loss of language and changes in the behavior. The main neuropathological changes of AD are the abundant amyloid plaques, neuropil threads, and dystrophic neurites containing hyperphosphorylated tau protein that are accompanied by astrogliosis and microglial cell activation 1. Increased generation of reactive oxygen species (ROS) and inflammatory mediators are associated with loss of mitochondrial function, altered metal homeostasis and lower levels of antioxidant defenses. These mediators directly affect synaptic activity and neurotransmission which lead to cognitive dysfunction 2. Therefore, it has been suggested that the use of molecules that modulate inflammation and oxidative stress may have a positive effect in the early stages of AD. Causative treatments of AD are not currently available and the drugs licensed are some acetylcholinesterase inhibitors and a N-methyl-D-aspartate receptor antagonist, which ameliorate the neurotransmitter alterations alterations but do not significantly prevent disease progression 3.
Omega-3 polyunsaturated fatty acids (PUFAs n-3) are well known to be an important component of cell membranes in the brain and are crucial to maintain cellular activity by modulating membrane order, gene transcription, cell signaling, and enzymatic activity. In fact, membrane lipids convey information and actively participate in presynaptic function 4. Fish oil is a significant source of PUFAs n-3 such as eicosapentaenoicacid (EPA) and docosahexaenoic acid (DHA). DHA constitutes more than 30% of the total phospholipid composition of plasma membranes in the brain 5. Studies in humans and animal models have shown a beneficial effect of EPA and DHA intake in a variety of neurodegenerative conditions. For instance, the Framingham heart study showed that persons with a high plasma phosphatidylcholine DHA values had lower risk of developing dementia and a DHA-EPA intake of 380 mg/day seemed to prevent cognitive decline 6. However, other epidemiological studies suggest that fish intake is just part of a dietary and behavioral pattern, synergistically associated with a protection versus AD 7-9. Thus, there is no consistent evidence about the efficacy of PUFAs n-3 as complementary AD treatment in the short and medium term 10. The purpose of the present study was to assess the effect of dietary fish oil supplementation on the fatty acid composition of erythrocyte membranes and plasma oxidative stress markers in patients with probable AD.
Materials y methods
Study design
A randomized, double blinded clinical trial was performed at the Cognitive Impairment Clinic of the Neurology Department of the Western National Medical Center, Mexican Institute of Social Security at Guadalajara, Jalisco, Mexico. This study was performed according with the updated Declaration of Helsinki and all procedures were approved by the Ethics and Health Research Committee of the Mexican Social Security Institute (Protocol number: 2014-785-011).
All patients were assessed by the Mini Mental State Evaluation (MMSE). Then, a comprehensive neuropsychological assessment was performed in patients with MMSE score less than 23 for alphabetized subjects and 20 for non-alphabetized subjects 11. Patients fulfilling criteria of the Diagnostic and Statistical Manual of Mental Disorders, fifth edition 12, and the National Institute of Neurological and Communicative Disorders and Alzheimer's Disease and Related Disorders Associationwere included in this study 13. In addition, the enrolled patients had stage 3 based on the Functional Assessment Staging Scale 14 and were elderly adults.
Patients had at least a 2.5-year history of cognitive decline. Patients were excluded if they were taking another supplement; had history of acute liver or renal dysfunction; had history of tobacco, drug, or alcohol abuse; had intolerance, contraindication, or allergy to fish oil; and had customary antioxidant intake. At the study entry and at 6 months and 12 months after enrollment blood samples were collected to ascertain fatty acid profile of erythrocyte plasma membrane and plasma oxidative stress markers. In addition, at baseline and the end of the trial, laboratory parameters measured included levels of lipids, hemoglobin, leukocytes, platelets, glucose, thyroid-stimulating hormone and thyroxine, and some markers to ascertain kidney and liver function.
Randomization and blinding
Twenty patients diagnosed with probable AD were randomly assigned in a 1:1 ratio to receive fish oil or placebo, with a computer-generated randomization sequence. Fish oil and placebo were administered in pharmaceutical gels forms containing water, gelatin, gum, and sugar and were identical in appearance, packaging, and labeling. Fish oil gels contained 0.45 g EPA and 1 g DHA. Randomization and allocation were concealed from the researchers and patients until the final analyses were completed. Identification numbers were assigned to assure patient confidentiality. Informed consent was obtained from the patient and caregiver (when indicated) by a physician staff. All patients were instructed to ingest orally one gel daily. Participants reported daily consumption of the supplement in a consumption posting sheet. The rate of adherence to treatment was >80% and was determined by using the following formula:
Adherence to treatment (%) = number of gels actually taken from the last count/number of gels should be taken at the same stage x 100%.
Outcomes measurements
Peripheral venous blood were obtained by venipuncture from all study participants after an 8-h overnight fast and collected in Vacutainer® polypropylene tubes (Becton Dickinson, Franklin Lakes, NJ, USA) containing ethylenediaminetetraacetic acid (EDTA). The plasma and the globular concentrate were separated by centrifugation at 1000 xg for 10 minutes at 4°C. Erythrocytes were washed in PBS buffer containing 1.4 mM KH2PO4, 8 mM Na2PO4, 140 mM NaCl, 2.7 mM KCl (pH 7.3), by centrifugation at 2500 xg for 5 min. Then, were lysed with 5 volumes of 10 Tris buffer and membranes were collected by centrifugation at 11400 xg for 30 minutes at 4°C. Erythrocyte membranes were washed three times with Tris buffer by centrifugation each time, and resuspended in 200 µl of PBS buffer and stored at -80 °C until use.
Fatty acid composition of erythrocyte plasma membrane were assessed after lipid extraction with chloroform/methanol (2:1, v/v) according to the Folch method 15 using 25 µg of heptadecanoic acid as internal standard, 5 mg/mL of erythrocyte membrane proteins resuspended in PBS buffer (pH 7.3) containing butylhydroxytoluene (0.002 %, v/v). Then, fatty acids were esterified to their corresponding methyl esters as described by Tserng et al.,16 and methyl esters were extracted with hexane-diethylether (1:1, v/v) and evaporated to dryness under a stream of nitrogen gas (16). Identification of methyl esters was performed with a Shimadzu gas chromatograph (GC 2010, Kyoto, Japan) equipped with an auto-injector/autosampler (AOC-20i). Analysis of peak areas was performed with the Shimadzu GC solution software (version 2.3, Shimadzu, Kyoto Japan).
Lipoperoxides in plasma were evaluated using a commercially available kit (FR12; Oxford Biomedical Research, Oxford, MI, USA) according to the manufacturer´s instructions.
To determine nitric oxide catabolites, plasma samples were deproteinizedwith zinc sulfate, followed by centrifugation at 10000 xg at 4°C for 10 min. Then, 100 µL vanadium (III) chloride (8mg/mL) was added to 100 µL of supernatants for reduction of nitrate to nitrite and this was followed by addition of the Griess reagents. After 30 min incubation at 37°C, absorbance of the samples was read at 540 nm 17. A standard curve (0-150 µmol) sodium nitrite was established.
Total glutathione levels were assessed by the enzymatic recycling process wherein, the reduced glutathione (GSH) was oxidized by 5,5´-dithiobis-2-nitrobenzoic acid to give 2-nitro-5thiobenzoic and oxidized glutathione (GSSG). GSSG was reduced to GSH by the action of glutathione reductase and NADPH. The rate of 5-thio-2-nitrobenzoic acid formation was monitored at 412 nm. A standard curve (0-100 µmol/L) GSH was established. GSSG was determined by the aforementioned recycling method. However, the samples were treated with 2-vinylpyridine in order to eliminate all the GSH 18.
The fluidity of plasma membranes was quantitatively estimated from the excimer to monomer fluorescence intensity ratio (le/lm) of the fluorescent probe 1,3 dipyrenylpropane (DyPP) incorporated in plasma membranes as reported elsewhere 19. In this method a high Ie/Im value indicates high membrane fluidity 19. The reference value of Ie/Im in healthy subjects is 0.36 ± 0.04.
Statistical Analysis
Data were analyzed as mean values ± standard deviation. Mann-Whitney U test was performed to assess differences between baseline and final parameters in group assigned to fish oil or placebo. Also a nonparametric and multivariate analysis of variance for repeated measurements (ANOVA) was done to determinate whether there was time differences in fish oil or placebo groups. A value of p <0.05 was considered statistically significant. The analyses were done in SPSS version 21.
Results
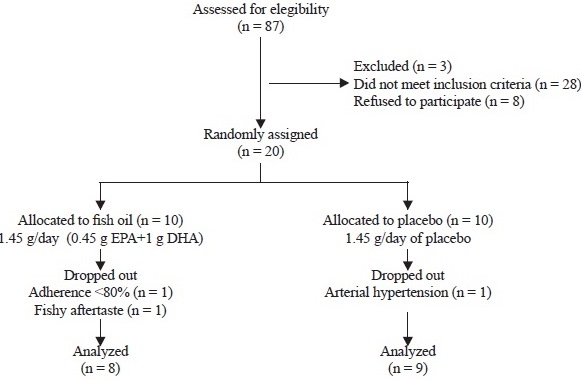
As shown in Figure 1, of the 87 AD patients treated at the Cognitive Impairment Clinic of the Neurology Department, 20 of them met the inclusion criteria and were randomly assigned to receive fish oil (10 patients) or placebo (10 patients). At the end of the intervention, 17 patients completed the 1-year trial. In the fish oil group, two patients withdrew from the study; one due to lack of adherence to treatment and other one due to an intolerable fishy aftertaste. In the placebo group, one patient discontinued study participation because of the development of arterial hypertension.
The demographical data and blood biochemical markers at baseline were similar between the intervention groups and were also within normal ranges, although minor increases in aspartate aminotransferase and alanine aminotransferase activities were detected in the fish oil group at the end of the intervention (Table 1).
Table 1 Demographic data and clinical characteristics of subjects enrolled in the study
| Basal | 12 months | |||
|---|---|---|---|---|
| Placebo | Fish oil | Placebo | Fish oil | |
| men/women | 1/9 | 2/8 | ||
| Age (years) | 70.6±12.1 | 73.3±13.5 | ||
| Glucose (mg/dL) | 96±0.9 | 92±0.8 | 98±0.5 | 96±0.5 |
| Urea (mg/dL) | 31±0.2 | 28±0.6 | 30±0.3 | 28±0.8 |
| Creatinine (mg/dL) | 0.7±0.1 | 0.7±0.2 | 0.8±0.2 | 0.7±4 |
| Uric acid (mg/dL) | 3±0.9 | 4±0.3 | 5±0.6 | 4±0.4 |
| Hemoglobin (g/dL) | 13±0.9 | 14±0.3 | 13±0.8 | 14±0.5 |
| Hematocrite (%) | 41±0.8 | 42±0.3 | 40±.5 | 41±0.5 |
| Platelets (thousans/Ál) | 219±0.5 | 194±0.7 | 200±12 | 250±8 |
| Cholesterol (mg/dL) | 202±0.7 | 175±0.5 | 198±0.5 | 178±0.8 |
| Triglicerides (mg/dL) | 122±0.4 | 165±0.3# | 178±0.8* | 166±0.9 |
| HDL-cholesterol (mg/dL) | 48±0.5 | 43±0.3 | 48±0.5 | 42±0.7 |
| VLDL-cholesterol (mg/dL) | 26±0.1 | 33±0.3 | 28±0.5 | 26±0.5 |
| Aspartate aminotransferase (U/L) | 20±0.9 | 45±0.5# | 38±0.8 | 32±0.5 |
| Alanine aminotransferase (U/L) | 22±0.6 | 44±0.7# | 32±0.5 | 38±0.5 |
| Thyroid-stimulating hormone (IU/mL) | 2±0.9 | 2.6±0.6 | 2.6±0.4 | 2.4±0.8 |
| Thyroxine T4 (ng/dL) | 1.4±0.1 | 1.6±0.7 | 1.8±0.5 | 1.4±0.5 |
Data are expressed as mean ± standard deviation. Comparison between groups at baseline, 6 and 12 months were calculated with Mann-Whitney U test.*p<0.05 with respect to baseline within group. #p<0.05 with respect to placebo group.
Table 2 shows the fatty acid composition of erythrocyte plasma membranes in patients receiving fish oil as dietary supplement or placebo. After 6 months of intervention, in the fish oil group there were significant increases in the percentage of stearic acid, behenic acid, EPA, DHA and a significant decrease of arachidonic acid. These changes remain at similar values at the end of the intervention. Therefore, the omega-6/omega-3 ratio decreased significantly at 6 months and the end of the intervention. In contrast, in the placebo group, the fatty acid composition at the end of the intervention was similar at baseline.
Table 2 Fatty acid composition of erythrocyte plasma membranes in Alzheimer's disease patients receiving fish oil or placebo
| Fatty acid | Basal | 6 months | 12 months | |||
|---|---|---|---|---|---|---|
| Placebo | Fish oil | Placebo | Fish oil | Placebo | Fish oil | |
| C14:0 | 0.35±0.03 | 0.34±0.04 | 0.38±0.03 | 0.41±0.07 | 0.42±0.09 | 0.40±0.05 |
| C16:0 | 28.05±0.66 | 27.83±1.32 | 28.23±0.41 | 29.02±0.68 | 27.54±0.90 | 28.87±0.95 |
| C16:1 | 0.43±0.05 | 0.47±0.02 | 0.42±0.05 | 0.43±0.03 | 0.5±0.18 | 0.43±0.03 |
| C18:0 | 15.12±0.73 | 14.95±0.49 | 15.15±0.60 | 18.25±0.72* | 15.5±1.11 | 18.36±0.68* |
| C18:1 | 8.5±0.15 | 8.43±0.25 | 8.47±0.14 | 7.92±0.41 | 8.52±0.34 | 8.02±0.37 |
| C18:2n6 | 21.78±0.9 | 22.74±1.02 | 21.77±0.67 | 19.76±1.28 | 21.81±0.62 | 19.57±1.16 |
| C18:3n6 | 0.03±01 | 0.04±0.01 | 0.04±0.00 | 0.03±0.01 | 0.03±0.01 | 0.028±0.01 |
| C20:0 | 0.41±0.01 | 0.40±0.09 | 0.41±0.01 | 0.41±0.02 | 0.43±0.07 | 0.42±0.02 |
| C20:3n6 | 3.24±0.10 | 3.46±0.26 | 3.27±0.12 | 2.45±0.25 | 3.26±0.11 | 2.46±0.37 |
| C20:4n6 | 11.71±0.4 | 12.27±0.48 | 12.04±0.32 | 8.2±0.76*# | 11.15±1.26 | 8.23±0.79*# |
| C22:0 | 0.14±0.03 | 0.16±0.03 | 0.20±0.09 | 0.57±0.12*# | 0.31±0.14 | 0.56±0.13*# |
| C22:1 | 0.40±0.03 | 0.40±0.07 | 0.40±0.03 | 0.49±0.15 | 0.39±0.04 | 0.48±0.16 |
| C24:0 | 1.10±0.9 | 0.26±0.12 | 0.28±0.18 | 0.29±0.05 | 0.33±0.21 | 0.29±0.05 |
| C24:1 | 0.22±0.01 | 0.23±0.02 | 0.22±0.01 | 0.26±0.04 | 0.27±0.103 | 0.27±0.04 |
| C20:2n6 | 0.36±0.05 | 0.40±0.09 | 0.37±0.06 | 0.33±0.05 | 0.38±0.06 | 0.32±0.06 |
| C22:2n6 | 1.15±0.98 | 0.36±0.03 | 1.11±0.93 | 0.31±0.04 | 1.34±0.86 | 0.32±0.04 |
| C20:5n3 EPA | 1.91±0.41 | 1.99±0.29 | 1.91±0.41 | 3.62±0.72*# | 2.02±0.48 | 3.71±0.62*# |
| C22:5n3 DPA | 1.52±0.39 | 1.26±0.29 | 1.67±0.33 | 1.13±0.09 | 1.6±0.35 | 1.1±0.09 |
| C22:6n3 DHA | 3.63±0.31 | 3.92±0.38 | 3.57±0.35 | 6.02±0.21*# | 3.7±0.53 | 6.03±0.27*# |
| Saturated | 43.97±1.12 | 45.2±1.01 | 44.68±0.72 | 48.99±1.08* | 44.55±1.11 | 48.92±1.25 |
| Monosaturated | 9.54±0.22 | 9.57±0.19 | 9.53±0.16 | 9.12±0.42* | 9.69±0.45 | 9.22±0.37 |
| Polyunsaturated | 46.48±1.05 | 45.37±1.01 | 45.78±0.68 | 41.89±1.19* | 45.32±1.07 | 41.79±1.16 |
| omega-6 | 39.29±0.68 | 38.29±1.19 | 38.62±0.71 | 31.11±1.69 | 38.00±0.86 | 30.95±1.61 |
| omega-3 | 7.18±0.47 | 7.08±0.69 | 7.16±0.65 | 10.78±0.78* | 7.32±0.65 | 10.84±0.66 |
| omega-6/omega-3 | 5.48±0.3 | 5.47±0.69 | 5.43±0.58 | 2.91±0.35* | 5.22±0.49 | 2.87±0,31 |
Values are expressed as a percentage of total fatty acids. Data are expressed as mean ± standard deviation. Comparison between groups at baseline, 6 and 12 months were calculated with Mann-Whitney U test. *p<0.05 with respect to baseline within group. #p<0.05 with respect to placebo group.
As seen in figures 2A and 2B, the plasma levels of lipoperoxides and nitrites-nitrates at baseline were similar between the fish oil group and placebo group. Nonetheless, significant decreases of both oxidative stress markers were seen at 6 months and 12 months for patients in the fish oil group. In contrast, no changes were detected for the placebo group. The fluidity of plasma membranes in the fish oil group was similar in the fish oil group and placebo group at baseline and 6 months of intervention. However, membrane fluidity increases significantly at the end of intervention in the fish oil group (figure 2C).
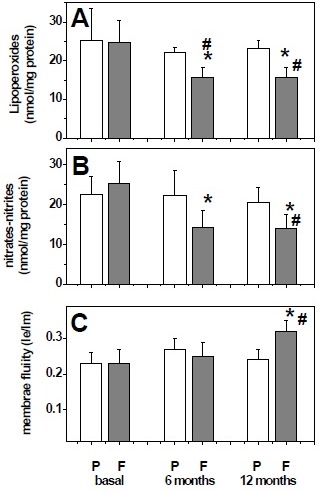
Figure 2 Plasma levels of biochemical markers at baseline and after 6 and 12 months treatment with placebo (P) or fish oil (F). Lipoperoxide levels (A), nitrates plus nitrites level (B), and membrane fluidity (Ie/Im) (C). Data are expressed as mean ± standard deviation. Comparisons were calculated with Mann-Whitney U test. *p <0.05 with respect to baseline within group. #p <0.05 with respect to placebo group.
Plasma levels of GSSG and GSH were similar in both groups at baseline. After 6 months and 12 months of treatment with fish oil, oxidized and reduced glutathione levels were decreased and increased respectively (figures 3A and 3B). Therefore, the GSH/GSSG ratio was significantly increased in patients treated with fish oil (figure 3C).
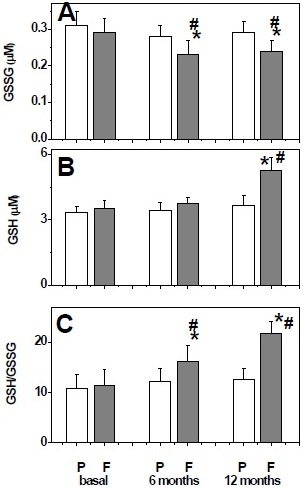
Figure 3 Plasma levels of glutathione system at baseline and after 6 and 12 months treatment with placebo (P) or fish oil (F). Oxidized glutathione levels (A), reduced glutathione levels (B), and GSH/GSSG ratio (C). Data are expressed as mean ± standard deviation. Comparisons were calculated with Mann-Whitney U test. *p <0.05 with respect to baseline within group. # p <0.05 with respect to the placebo group.
Discussion
In recent years, epidemiological evidence suggests that nutrition and diet are modifiable risk factors in AD. Although the mechanisms by which nutrients modify the disease course are not elucidated, it is believed that oxidative stress, inflammation and amyloid beta-peptide (Aβ) accumulation plays a major role in the progression of AD 20. The results of our clinical trial showed that after 12 months of intervention with fish oil rich in EPA and DHA, the plasma levels of lipoperoxides and nitric oxide catabolites decreased significantly. These changes were correlated with a higher ratio of GSH/GSSG in plasma. In addition, the fluidity of the plasma membranes was significantly improved at the end of the intervention. Therefore, fish oil treatment shows efficacy in reducing oxidative stress markers in human plasma.
GSH and GSSG are the most abundant intracellular sulfhydryl compounds and are cosubstrates of glutathione peroxidase and glutathione reductase, respectively, and GSH plays an important role as a neuroprotectant by nullifying the toxic effects of reactive oxygen species 21. Our data showed that fish oil intervention increase significantly the GSH/GSSG ratio. At this regard, it has been proposed that a GSH/GSSG ratio <8.73 is an excellent marker for oxidative stress in AD and it has been proposed that, when oxidative stress is limited, cells are able to maintain the appropriate GSH/GSSG ratio, causing an diminution of GSSG which decreases the oxidative modification of biomolecules 22.
Our findings shows that EPA and DHA were efficiently incorporated into the plasma membrane of erythrocytes after fish oil treatment and are consistent with the proposal that membrane phospholipid fatty acid composition provides a measure of relative dietary fatty acid intake over several months 23. In fact, EPA and DHA levels in erythrocyte membranes are a better indicator of long-term availability and of whether the body is receiving an adequate supply of PUFAs n-3 24. PUFAs n-3 play and essential role in the normal development and functioning of brain and may integrate into cell membranes to change their physical properties. In addition, PUFAs n-3 affects signal transduction and modulates gene expression 25.
In this work it was found that an increase in the content of EPA and DHA in the membrane of erythrocyte is associated with an improvement of the fluidity of the plasma membranes. This can be attributed to the fact that EPA and DHA exert some of their metabolic functions forming part of the structure of the phospholipids that make up cellular membranes and provide fluidity to the membranes, an essential feature that allows the mobility of proteins, either on the surface or inside the lipid bilayer 26. In consonance, diets enriched in DHA have been shown to increase membrane fluidity of neurons and other cells 27.
The effect of PUFAs n-3 on cell membranes may be important due to the nature of the interaction of biological membranes with amyloid β peptide (Aβ) 28. Aβ oligomers seem to alter the membrane structure and functions and its presence is related to the dysregulation of cellular ionic homeostasis 29. Consistent with the above it is known that DHA decreases the amount of Aβ deposition 28 and reduced Aβ burden 30, and stimulates the non-amyloidogenic APP processing in cellular models of AD 31. In addition, enhanced membrane fluidity favors the non-amyloidogenic pathway of amyloid precursor protein processing 32 and influences Aβ aggregation, size and hydrophobicity, which is critical for the formation of Aβ plaques and downstream cellular pathways 33. Therefore, high levels of PUFAs n-3in the plasma membrane can affect the metabolism of β-amyloid peptide and reduce the risk of progression of AD.
Lower levers of DHA have been reported in serum samples of AD patient 34 and DHA consumption significantly reduced the likelihood of developing AD 35. In contrast, dietary PUFA n-3 depletion has been shown to activate caspases and decrease NMDA receptors in the brain of a transgenic mouse model of AD 36. In addition, DHA have been shown to suppress Aβ-induced phosphorylation of tau tangles and the inactivation of insulin receptors in primary rat neurons 37. Significant increases in stearic and behenic fatty acids were detected after fish oil dietary supplementation. That unexpected finding highlight the need to study the role of the enzymes involved in lipid metabolism.
In this work we found that fish oil intervention decreases lipid oxidation products and nitric oxide catabolites in human plasma. This has repercussions in reestablishing the membrane fluidity to its physiological ranges. It has been reported that oxidation of biomolecules in the context of AD is mainly related to neuronal membrane biomolecules and to a disruption of membrane integrity 38. At this regard, oxidative stress is involved in the oxidation of LRP1, a multifunctional protein that is involved in Aβ clearance 39.
The mechanisms involved in the beneficial effect of omega 3 fatty acids have focused on: a) its anti-inflammatory actions which is based on the regulation of the nuclear factor kB 40, peroxisome proliferator-activated receptors 41, G-protein coupled receptor GPR120 42; b) the production of oxygenated metabolites of EPA and DHA that actively promote the resolution of inflammation, such as resolvins, protectins and maresins 43; c) its effect on modifying the biophysical properties of the membranes resulting in changes in the activity of ion channels, receptors and the interaction between phospholipids and proteins 44; d) its antioxidant effects by upregulating genes encoding antioxidant enzymes such as heme oxygenase 1 (HO-1) and glutathione peroxidase 45.
On the other hand, administration of PUFAs n-3 decreases the production of proinflammatory cytokines suchas IL-1, IL-6, Interleukin 8 (IL-8) and TNFα and oxidative stress 46, diminish the proliferation of T lymphocytes 47. Furthermore, EPA competes for the site of action of cyclooxygenases 1, and 2, and lipoxygenase 5 with arachidonic acid, the latter being responsible for favoring the synthesis of inflammatory cytokines and leukotrienes in conditions where oxidative stress prevails 48.
We found slight increases in aminotransferase activities in the fish oil group at the end of the intervention, but the aspartate aminotransferase to alanine aminotransferase ratio was not modified. In contrast, a recent report showed that the increase in the aforementioned ratio was significantly associated with specific biomarkers of AD such as increased amyloid-β deposition and higher cerebrospinal fluid levels of phosphorylated tau and total tau 49. Thus, the relationships between altered liver function and AD pathology warrants further study.
In conclusion dietary supplementation with PUFAs n-3 diminishes the levels of peripheral oxidative stress markers and improves the fluidity of membranes. Thus, the presented data support future studies evaluating the safety, efficacy and long-term effects of PUFA n-3.

