Services on Demand
Journal
Article
Indicators
-
 Cited by SciELO
 -
 Access statistics
Related links
-
 Similars in
SciELO
Share
Revista de la Facultad de Ingeniería Universidad Central de Venezuela
Print version ISSN 0798-4065
Rev. Fac. Ing. UCV vol.23 no.4 Caracas Dec. 2008
Turbulence modeling in the numerical estimation of hemolysis in hemodialysis cannulae
Félix A. Salazar1, Luis R. Rojas-Solórzano2, Armando J. Blanco3
1 Universidad Simón Bolívar. Laboratorio de Mecánica de Fluidos. Caracas-Venezuela e-mail: felix.salazar@usb.ve
2 Universidad Simón Bolívar. Departamento de Conversión y Transporte de Energía. Caracas-Venezuela e-mail: rrojas@usb.ve
3 Universidad Simón Bolívar, Departamento de Mecánica. Caracas-Venezuela e-mail: ajblanco@usb.ve
ABSTRACT
In recent years, CFD has become an increasingly used tool in the design of blood-based devices. Particularly, the estimation of red blood cells damage (hemolysis) becomes a very important challenge to CFD scientists since the blood is a complex fluid present in turbulent regime in most pumping devices. Thus, previous CFD studies on blood hemolysis lack of appropriate turbulence modeling and consequently, reliable relationships between hydraulic results and hematological responses. Cannula geometries were studied to numerically assess a relatively simple flow with well documented laboratory hematological data. For benchmarking purposes, numerical data from a coaxial jet array direct numerical simulation (DNS) was used in the selection of the most appropriate and economical turbulence model to be used in the cannula numerical analysis. Velocity and stress time-averaged profiles were compared between DNS results and RANS simulations with different turbulence models. These results, pointed to the Shear Stress Transport with Gamma-Theta transition model as the appropriate turbulence model in that geometry. Accurate and reliable hydrodynamic CFD results were obtained for the cannula as an important previous step to the study and development of further hematological calculations with a minimum degree of uncertainty in the flow field. These hematological calculations led to interesting results about the important role played by turbulence modeling in hemolysis estimation.
Keywords: Blood, Hemolysis, Cannula, Turbulence, Validation.
Modelado de turbulencia en la estimación numérica de hemólisis en cánulas de diálisis
RESUMEN
En años recientes, la dinámica de fluidos computacional (CFD por sus siglas en inglés) se ha venido utilizando en forma creciente en el diseño de dispositivos que manejen sangre. En particular, la estimación de la ruptura de glóbulos rojos (hemólisis) representa un importante reto para los científicos, ya que la sangre es un fluido complejo presente en régimen turbulento en la mayoría de los dispositivos. Asimismo, los estudios previos de hemólisis utilizando CFD carecen de un modelaje apropiado de turbulencia, y consecuentemente, de una relación confiable entre los resultados hidráulicos y la respuesta hematológica. Se estudió la geometría de cánulas para evaluar un flujo relativamente simple del cual se disponen datos experimentales de hemólisis. Para la validación del modelo de turbulencia, se utilizó una simulación numérica directa (DNS por sus siglas en inglés) de un arreglo de chorros coaxiales, para así seleccionar el modelo de turbulencia más apropiado para el análisis de las cánulas. Los perfiles de velocidad y de esfuerzo cortante promediados temporalmente fueron comparados entre el DNS y las simulaciones RANS con distintos modelos de turbulencia. Se obtuvo que el modelo de turbulencia más adecuado para la cánula es el de Transporte de Esfuerzos Cortantes con transición modelo Gamma- Theta. De esta manera se pudieron obtener resultados hidrodinámicos confiables, que serán utilizados en posteriores cálculos de hemólisis, con un mínimo de incertidumbre en el campo de flujo.
Palabras clave: Sangre, Hemólisis, Cánula, Turbulencia, Validación.
Recibido: enero de 2008 Recibido en forma final revisado: julio de 2008
INTRODUCTION
When the blood enters in contact with a non-biological environment, several issues may arise. Osmotic and thermal effects, chemical processes, or even the wall contact could lead to damage of blood cells. However, the most relevant source of blood damage usually comes from shear stresses. Under certain conditions, these stresses will provoke the rupture of the membrane of red blood cells, and the subsequent release of hemoglobin into plasma, which is called hemolysis.
The study of this phenomenon is primordial in the design of biomedical devices, such as blood pumps, dialysis machines, heart valves, catheters and cannulae, among others. The invitro evaluation of these devices is the most reliable way to perform the hematologic study, as it can be seen in the ASTM standard F 1841-97 (ASTM, 1997). However, to assure the validity of the results, it requires a great number of repetitions, due to statistical variations. These experiments are quite expensive, increasing both the time of design and development cost of the blood-based medical devices.
A numerical hemolysis analysis by means of computational fluid dynamics (CFD) appears as an attractive alternative, as stated by Burgreen et al. (2001) and Apel et al. (2001), because it may decrease the cost and time of design and development of such medical devices. With CFD analysis, accurate calculation of hydrodynamic variables, such as velocity, pressure and stress fields could be obtained for the devices under study. Through a hemolysis model, a relationship between these hydraulic results and the corresponding hemolytic response might be calculated. Nevertheless, a reliable and validated general hemolysis model does not exist up till now. So far, the data obtained for hemolysis at one-dimensional stress experiments has been correlated by Giersiepen et al. (1990) into a multi-variable regression in terms of shear stress and exposure time, but consensus about a methodology for the application of such correlations to CFD results has not been established yet.
Previous authors performed CFD hemolysis analysis without any care in the selection of the turbulence model. Some of them, like De Wachter et al. (2002), Garon et al. (2004) and Farinas et al. (2006) solved the laminar steady-state Navier- Stokes equations, even though the flow into the domain is turbulent. Others, like Kameneva et al. (2004), used a turbulence model in the simulation, but the selection was not validated, and the CFD hydrodynamics results lack of reliability and so does the hemolysis calculation.
For evaluation of reliability and accuracy of hemolysys models, it is advisable to progressively test complex geometries. The cannulae, which were studied in this work, and capillaries are the simplest geometries of biomedical devices for which experimental measurements of hemolysis are available. The experimental measurements of hemolysis at cannulae were performed by De Wachter et al. (1997), and the measurements for the capillaries were performed by Kameneva et al. (2004).
Hemolysis Calculation and Estimation
As mentioned before, the most popular hemolysis model, the Giersiepen-Wurzinger equation (Giersiepen et al. 1990), is based on a multi-variable regression over experimental data obtained from a one-dimensional stress case. The equation has the following form:
where:
Δ
PfHb is the change on the plasma-free hemoglobin, Hb is the total amount of hemoglobin in the blood sample, τ is the constant shear stress which the blood sample, t undergoes and is the exposure time to that stress.Several methods have been proposed for the calculation of hemolysis departing from Equation 1. The integration along streamlines is certainly the most popular (De Wachter et al. 2002; Arora et al. 2004). Other authors propose a Lagrangian technique of particle seeding (Wu et al. 2005), and tracking the evolution of the hemolysis on individual particles. The accuracy of both methods is related with the accuracy of CFD results, and the number of streamlines or particles. An Eulerian approach has been proposed (Garon et al. 2004; Farinas et al. 2006), based on a transport equation (Equation 2) derived directly from Equation 1 and ASTM standards:
where:
DL
stands for the local linear blood damage. This variable represents a measure of the hemolysis rate at each point of the computational domain. Details about the development and simplifications of Equation 2 can be found at Garon et al. (2004). They state that the accuracy of this Eulerian approach is related only with the accuracy of the CFD results, which depend basically on the mesh resolution and the turbulence model selected.The actual rheological behaviour of the blood is non- Newtonian, manifested in its shear-thinning and relaxation properties. Yeleswarapu et al. (1998) have showed that these characteristics can be described quite well with a generalized Oldroyd-B fluid model. Most of the previous works with CFD blood simulations, the Newtonian behavior is assumed for the blood. This was done by Arora et al. (2004); De Wachter et al. (2002) and Garon et al. (2006); just to mention a few of them. According to Mazumdar (2004), the Newtonian-flow approximation is valid for shear rates higher than 50 s-1. For these shear rates, the blood has an asymptotic Newtonian behavior.
De Wachter et al. (2002) and Garon et al. (2004) used calf blood in their investigations. For comparative purposes, the same fluid was studied within this work. The asymptotic value of viscosity for the calf blood at high shear rates is 2.42 mPa s (cP), which is the same value used by De Wachter et al. (2002) and Garon et al. (2004).
Turbulence Modelling
An adequate modeling of turbulent stresses is very important in systems where blood is present, because in most of the biomedical devices, and particularly in blood pumps, the flow regime is predominantly turbulent. For example, Kameneva et al. (2004) have proved numerically and empirically the remarkable effect of turbulent stresses over hemolysis rates.
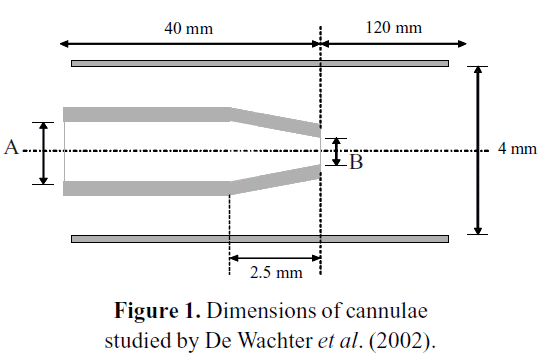
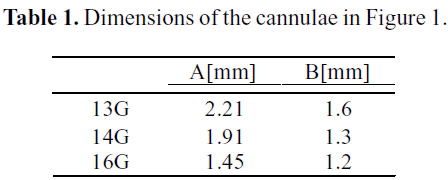
De Wachter et al. (2002) studied empirically and numerically the hemolysis in cannulae during a dialysis procedure. Figure 1 describes the geometry used in the numerical study. The inner diameters A and B stand for the cannulae core and its tapered end, respectively. The dimensions of the different sizes of cannulae studied are listed in Table 1.
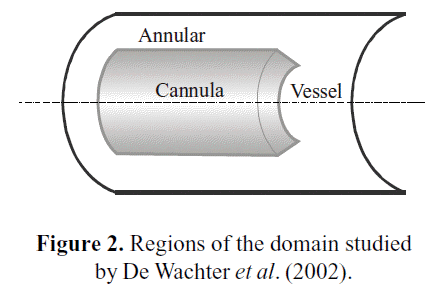
De Wachter et al. (2002) specified an operational range of blood flow through cannulae in a dialysis procedure, with a maximum of about 400 ml/min, and a physiological range of blood flow through the arteries between 500 and 1200 ml/ min. Figure 2 details the different regions inside the vessel and around the cannula.
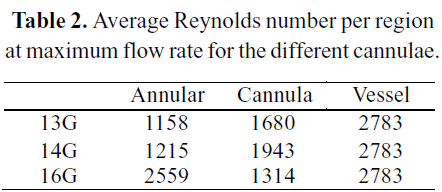
The Annular region corresponds to the zone bounded by the blood vessel wall and the outer wall of the cannula. The Cannula region, as its name indicates, is bounded by the cannula. The Vessel region is neither part of the cannula nor annular regions, and its bounded by the blood vessel. Taking the maximum value of flow ranges, the average Reynolds number for each region can be calculated. The results are reported in Table 2.
Reynolds numbers above 2300 ~ 2500 are a signal of the existence of a turbulent regime in that region. Therefore, those Reynolds numbers indicate that transition from laminar to turbulent regime may occur within the domain under study.This transition was not considered neither in the previous numerical work by De Wachter et al. (2002), or by Garon et al. (2004). Both of them solved the laminar steadystate Navier-Stokes equations. On the other hand, Kameneva et al. (2004) have studied numerically and experimentally a blood capillary tube. They analyzed both laminar and turbulent regimes, showing a prominent effect of turbulence onto hemolysis rate. Therefore, and accurate modeling of the turbulence its highly relevant, due to the high amount of uncertainty added to the flow solutions by the selection of different turbulence models.
Turbulence Benchmark
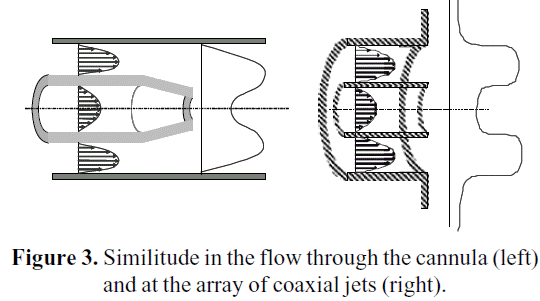
Based on the geometrical characteristics of cannulae and the capillary, a benchmark to validate the selection of the turbulence model has been selected. Balarac et al. (2005) performed a direct numerical simulation (DNS) for an array of coaxial jets, which resembles very closely the characteristics of the flow through a cannula, as it can be seen in Figure 3.
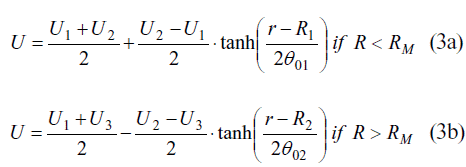
In both cases, there is a shear layer between the inner and outer streams. The capillary might be considered as a particular case of a jet flow (especially at the diverging cone), where both annular and central velocity are alike. In this benchmark, a laminar velocity profile is set at the inlet of a rectangular parallelepiped domain. The shape of that profile is according to Equation 3:
where:
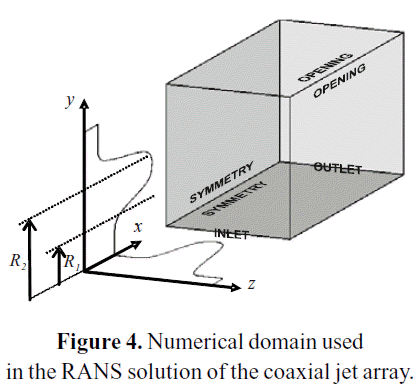
U1, U2 and U3 stand for the average velocities at the inner jet, the outer jet and the free stream, respectively. R1 and R2 are the radius of the inner and outer jets, respectively, as specified at Figure 4. RM is the arithmetic average between R1 and R2. θ01 and θ02 are the inlet momentum thickness of the inner and outer shear layers, respectively.
NUMERICAL RESULTS
Hydrodynamic results of jets array studied by Balarac et al. (2005) were obtained with a commercial 3D finite volume code (ANSYS CFX 10.0, Canonsburg, PA). This code uses finite volume for the discretization of the incompressible Reynolds-Averaged Navier-Stokes (RANS) equations. For the mathematical closure, the set of differential equations corresponding to the turbulence model is solved within the preceding numerical system. By comparison between the DNS velocity profiles and the corresponding ones from the RANS simulation, the best suitable turbulence model was selected. The velocity at centerline of the jets, and the radius of the jet were the comparison variables.
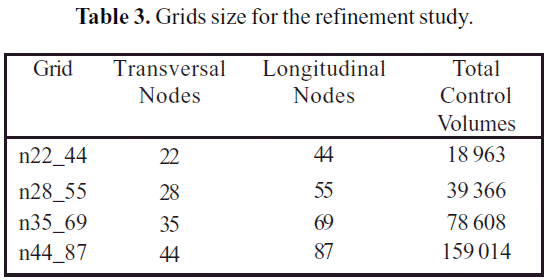
Figure 4 shows the structure of the numerical domain used for the solution of the RANS equations. The domain was discretized with a non-uniform hexahedral mesh. The hexahedral grid takes advantage of the polar symmetry of the jet array, working only with one-quarter of the domain. Table 3 presents the number of control volumes on each grid used in the refinement study.
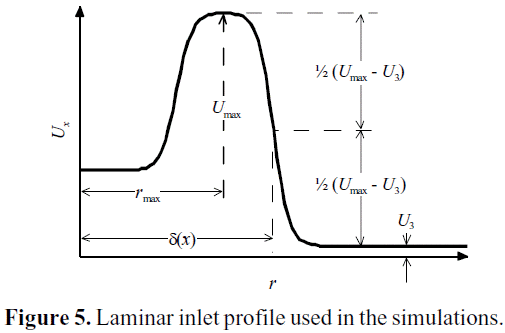
The boundary conditions for the RANS simulations were set to mimic those from the DNS 2_17 simulation case performed by Balarac et al. (2005): a laminar inlet profile, as shown in Figure 5. This figure also shows the significance of the spreading rate of the jet δ(x), defined accordingly Balarac et al. (2005). The jet development length is highly dependent of the turbulence parameters at the inlet, particularly the turbulent-to-molecular viscosity ratio. A low viscosity ratio means a less turbulent flow at inlet. In these simulations, the viscosity ratio was set to a value as low as possible, resulting on a numerically stable simulation (νT /ν= 0.05). Of that way, the laminar profile used at the inlet of the DNS 2_17 case can be matched with the «turbulent» profile at the inlet of the RANS simulation.
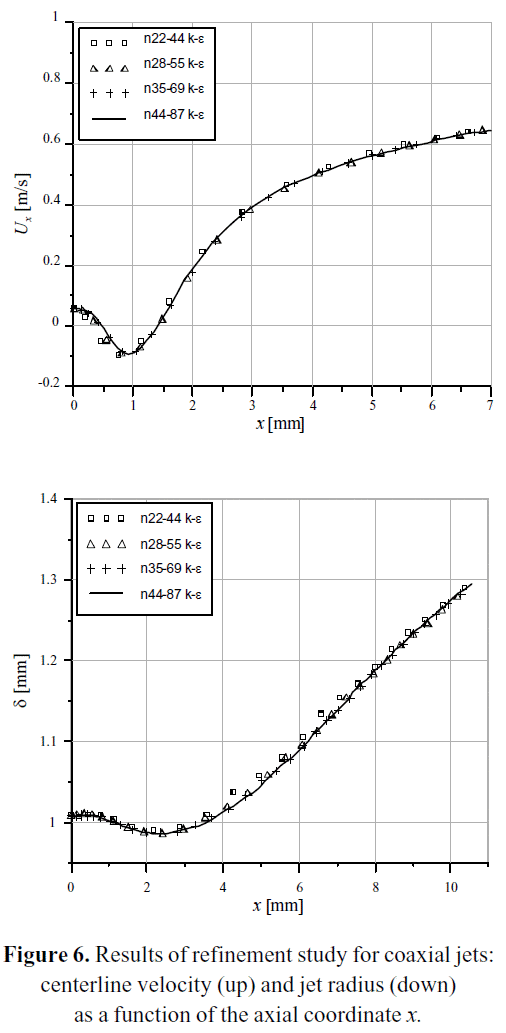
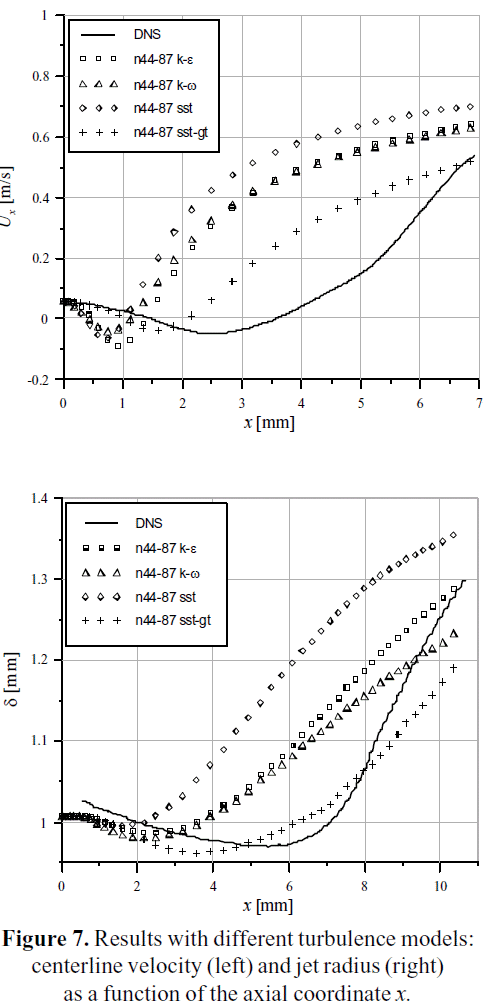
The centerline velocity Ux and the jet spreading rate δ were calculated for each grid of the Table 3, with a standard k-ε turbulence model. The results are plotted in Figure 6 as a function of the axial coordinate x. As it can be seen, the curves are almost congruent, which is a signal of a sufficiently refined grid. Additional simulations were performed using the n44_87 grid with different turbulence models, specifically k-ω, standard SST and SST with Gamma-Theta transition. The results are plotted on Figure 7, in comparison with the values of the DNS 2_17 case.
DISCUSSION
Different turbulence models (k-ε, k-ω, SST and SST with Gamma-Theta transition model) were found to significantly differ in predicting the flow development and the laminar to turbulence transition. Among the considered models, the one that better resembles the behavior of the jets DNS benchmark is the Shear Stress Transport (SST) with Gamma- Theta transitional model, as it can be seen in Figure 7. The SST transitional model predicts quite well the centerline velocity evolution, and the spreading rate variation, in contrast with the other models evaluated. Also, the wall treatment of this model could consider the effects of the near wall behavior that exist in cannulae, and which is captured at a very high computational cost when using DNS benchmark simulations. Therefore, this turbulence model appears to be the choice for the simulation of cannulae, capillaries and other geometrically similar biomedical devices, where the transition from laminar to turbulent regime is present.
CONCLUSIONS
In this work, a simple validation procedure for a turbulence model to be used in cannulae and capillaries was developed. The accurate calculation of the turbulent stresses becomes mandatory, especially when they have a predominant role in the numerical estimation of blood damage inside these biomedical devices. The use of a validated turbulence model diminishes the amount of uncertainty inherent to numerical blood-damage estimation.
In the case of the cannula geometry, the turbulence model that has the best representation of the physics within the fluid flow is the SST with Gamma-Theta transition model.
ACKNOWLEDGEMENTS
The authors want to acknowledge the financial support of this investigation by the Universidad Simon Bolívar´s Deanship of Research and Development under a Research Assistantship grant. Thanks also to the Department of Energy Conversion and the Laboratory of Fluid Mechanics, whose PC cluster hosted a large number of the simulations performed in this investigation.
REFERENCES
1. APEL, J., PAUL, R., KLAUS, S., SIESS, T., REUL, H. (2001). Assessment of hemolysis related quantities in a microaxial blood pump by computational fluid dynamics. Artif. Organs, 25(5):341-347. [ Links ]
2. ARORA, D., BEHR, M., PASQUALI, M. (2004). A tensor-based measure for estimating blood damage. Artif. Organs, 28(11):1002-1015. [ Links ]
3. ASTM (1997). Designation F 1841-97: Standard practice for assessment of hemolysis in continuous flow blood pumps. Annual Book of ASTM Standards, vol. 13:01. [ Links ]
4. BALARAC, G., MÉTAIS, O. (2005). The near field of coaxial jets: a numerical study. Phys. Fluids, 17(6): 065102/ 1-14. [ Links ]
5. BURGREEN, G.W., ANTAKI, J.F., WU, Z.J., HOLMES, A.J. (2001). Computational fluid dynamics as a development tool for rotary blood pumps. Artif. Organs, 25(5):336- 340. [ Links ]
6. DE WACHTER, D.S., VERDONCK, P.R., DE ROS, J.Y., HOMBROUCKX, R.O. (1997). Blood trauma in plastic haemodialysis cannulae. Int. J. Artif. Organs, 20(7): 366-370. [ Links ]
7. DE WACHTER, D., VERDONCK, P. (2002). Numerical calculation of hemolysis levels in peripheral hemodialysis cannulas. Artif. Organs, 26(7): 576-582. [ Links ]
8. FARINAS, M.I., GARON, A., LACASSE, D., NDRI, D. (2006). Asymptotically consistent numerical approximation of hemolysis. J. Biomech. Eng., 128(5):688-696. [ Links ]
9. GARON A., FARINAS, M.I. (2004). Fast three-dimensional numerical hemolysis approximation. Artif. Organs, 28(11):1016-1025. [ Links ]
10. GIERSIEPEN, M., WURZINGER, L.J., OPITZ, R., REUL, H. (1990). Estimation of shear stress-related blood damage in heart valve prostheses - in vitro comparison of 25 aortic valves. Int. J. Artif. Organs, 13(5):300-306. [ Links ]
11. KAMENEVA, M.V., BURGREEN, G.W., KONO, K., REPKO, B., ANTAKI, J.F., UMEZU, M. (2004). Effects of turbulent stresses upon mechanical hemolysis: experimental and computational analysis. ASAIO J., 50(5): 418-423. [ Links ]
12. MAZUMDAR, J.N. (2004). Biofluid mechanics. World Scientific, Third. Edition, Singapore. [ Links ]
13. WU, J., ANTAKI, J.F., SNYDER, T.A., WAGNER, W.R., BOROVETZ, H.S., PADEN, B.E. (2005). Design optimization of blood shearing instrument by computational fluid dynamics. Artif. Organs, 29(6): 482-489. [ Links ]
14. YELESWARAPU, K.K., KAMENEVA, M.V., RAJAGOPAL, K.R., ANTAKI, J.F. (1998). The flow of blood in tubes: theory and experiment. Mechanics Res. Commun., 25(3): 257-262. [ Links ]


